


Problem 33: More curve sketching ( ) 1999 Paper II
The curve has equation
where the square root is positive. Show that, if , then has exactly one stationary point.
Sketch when (i) and (ii) .
Comments
You have to be sure of the definition of to do this question. You might think that it is ambiguous, because the square root could be positive of negative, but by convention it means the positive square root. Thus (not ).
For the sketches, you just need the position of any stationary points, any other interesting points that the graph passes through, behaviour as and any vertical asymptotes. It should not be necessary in such a simple case to establish the nature of the stationary point(s). The sketches are not particularly difficult, but they do need thought because they turn out to be rather different from the sketches of polynomials or trigonometric functions that you are probably used to.
You should at some stage think about the conditions given on . In fact, I doubt if many of you will want to leave it there. It is clear that the examiner would really have liked you to do is to sketch in the different cases that arise according to the value of but was told that this would be too long and/or difficult for the exam; but I am sure that this is what you will try to do (or maybe what you have already done by the time you read this).
Please do not use your calculator (or Wolfram Alpha or Geogebra or Desmos24, etc) for these sketches, except perhaps to check your answers: there is no point.
Solution to problem 33
First differentiate to find the stationary points:
which is only zero when . I’ve used the quotient rule, but the product rule is just as good.
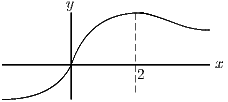
(i) When ,
the stationary point is at
(which can be seen to be a maximum
by evaluating the second derivative at
,
though this is not necessary). The curve passes through
.
As ,
;
as ,
. 
(ii) When ,
we can rewrite
as .
The modulus signs arise because the square root is taken
to be positive (or zero — but that can be discounted
here since it is in the denominator). The graph is as
before, except that the maximum point has been stretched
into a vertical asymptote (like a volcanic plug) at
.
Note that if
is much larger than ,
it doesn’t really matter whether
or . 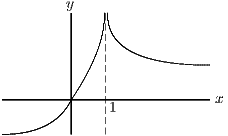
Post-mortem
The first thing to do after finishing the question is to try to understand the role of the parameter . Part (ii) above is the key. Writing
we see that for all if but if there are values of for which . The borderline value is , for which and .
If , we find that when and between these two values of . The significance of this is that the square root in the denominator of the function we are trying to sketch is imaginary, so there is a gap in the graph between and . There are vertical asymptotes at these values.
Is that the whole story? Well, no. We now have to decide whether the two significant points of our graph, namely where the curve crosses the axis and where the curve has a maximum, lie inside or outside the forbidden zone . This turns out to depend on whether or or . The graph will look qualitatively different in each case, so there is still quite a lot of work to do in this case! We can why it was excluded from the original question.
24

