


Problem 38: Discontinuous integrands ( )
For any number , the largest integer less than or equal to is denoted by . For example, and .
- (i)
- Sketch the graph of
for
and evaluate
- (ii)
- Sketch the graph of
for ,
where
is an integer, and show that
Hence show that .
Comments
I had to add a bit to the original question because it was all dressed up with nowhere to go. The question is clearly about estimating so I added in the last line, which makes the question a bit longer but not much more difficult. I could have added another part, but I thought that you would probably add it yourself: you will easily spot, once you have drawn the graphs, that a similar result for with the inequality reversed can be obtained by considering rectangles the tops of which are above the graph of instead of below it. You therefore end up with a nice sandwich inequality for .
Stirling (1692 – 1770) proved in 1730 that for large . This was a brilliant result — even reading his book, it is hard to see where he got from (especially as he wrote in Latin). Then he went on to obtain the approximation in terms of an infinite series; the expression above is just the first term.
Solution to problem 38
(i)
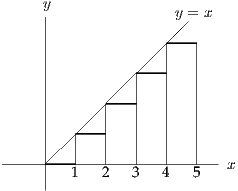
The integral is the sum of the areas of the rectangles shown in the figure:
(ii)
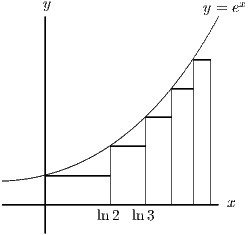
The value of changes from to when i.e. when . Thus when and the area of the corresponding rectangle is .
The total area under the curve is therefore
which you can rearrange to obtain as required.
For the last part, note that (this is clear from the definition) so
Taking exponentials gives the required result.
Post-mortem
Usually when you draw a graph of a discontinuous function, you should specify at the jump whether the function takes the upper or lower value. For example takes the value 1 at , which is the upper value. This can be achieved by putting (say) a circle round the upper or lower point, as appropriate. I didn’t bother on the above graphs, because it doesn’t affect the value of the integral and I didn’t want to clutter up the graphs.
Considering instead of gives rectangles above the graph of rather than below. The calculations are roughly the same, so you should easily arrive at . We have therefore proved that
This gives a pretty good (given the rather elementary method at our disposal) approximation for for large .

