


8. Statistical Testing of Regality Theory
© 2017 Agner Fog, CC BY 4.0 https://doi.org/10.11647/OBP.0128.08
8.1. Problems of cross-cultural statistics
We need to compare different cultures when we want to test the predictions of regality theory. However, the statistical comparison of different cultures is full of problems that we have to deal with. The first problem is the availability of data. Many data sources are available for modern cultures, but few for ancient cultures. The quality of the data is a matter of serious concern. Data collected from different cultures may not be fully comparable because of language problems, differences in definitions, or different frames of reference. There is a general problem with quantifying culture, because it is not always meaningful to put numbers on things like ideas, beliefs, emotions, or understandings. How can we know if concepts such as prestige or patriotism have the same meaning in different cultures?
The available data for contemporary modern western countries are generally of a satisfactory quality because the methods of data collection have been refined and standardized to a certain degree. But here we encounter another problem. Modern cultures are too similar. We need variation in the measured variables in order to get useful statistical results. Any similarity that we find between two countries may simply be due to cultural diffusion rather than to some causal factor that influences both countries in the same way.
The best way to overcome the problem of cultural similarity, known as Galton’s problem, is to look at the more isolated cultures of the past. No culture is completely isolated, but many of the non-modern and non-industrial cultures of the past were sufficiently autonomous to make cross-cultural comparisons useful. The Standard Cross-Cultural Sample, mentioned in chapter 8.2, is a database of cultures selected specifically with the purpose of minimizing Galton’s problem. The data in this database have been obtained from the ethnographic literature.
Unfortunately, the quality of the data in the Standard Cross-Cultural Sample is often problematic. Some of the variables are poorly defined or interpreted differently for different cultures. Some variables refer to concepts that make sense only in particular cultural contexts. Data are coded in the database as missing when a variable is irrelevant for a particular culture or the information is not available. In the course of the present study, it was discovered that data were often missing for non-random reasons. Special care was needed to reduce the systematic bias caused by such missing data.
Many of the problems with data quality and unclear interpretation of data are best dealt with by qualitative methods. A qualitative study can look into the life situation of the informants to put the information into a meaningful context. It allows us to discover new phenomena or mechanisms that were not anticipated when the study was planned. A qualitative study can give us a better understanding not only of what people do but also of the motives behind. For example, it is important for regality theory to study not only whether people fight but also why they fight.
It has been suggested that a combination of qualitative and quantitative methods is a particularly fruitful way of doing cross-cultural research.1 We shall do this here with a subsample of the Standard Cross-Cultural Sample. Relevant information is gathered for each culture in the subsample by studying the original ethnographic literature (chapter 7). The qualitative study assures that we can gather meaningful information that actually reflects what we want to measure. The advantage of this mixed method is that we get more reliable data and that we are able to better understand the context and mechanisms that lie behind these data. The disadvantage is that we have fewer cultures to compare, because it requires more work to gather the information about each culture.
A study with a large data set (large N) makes it possible to construct bigger statistical models with more independent variables and still have enough statistical power to get significant results; a smaller data set (small N) can support only a smaller model with fewer independent variables. Each method has its advantages and disadvantages. The present study uses several different statistical methods and data sources, and we must keep in mind the strengths and weaknesses of each method when interpreting the results. The following statistical studies are included here:
- A statistical study based on George Murdock and Douglas White’s Standard Cross-Cultural Sample (SCCS), which contains data from 186 non-industrial societies around the world. This study includes an exploratory factor analysis to identify the most relevant variables, a structural equation model to analyze the causal network in the proposed model, and a multiple correlation analysis of various variables against the central variables in the structural equation model.
- A statistical test based on the societies that were analyzed in chapter 7. This is a subsample of the SCSS. The results of the detailed analyses of these societies are compared with the predictions of regality theory.
- A study of individuals in contemporary cultures using data from the Survey of World Views Project, based on a survey of data from 8,883 persons in 33 countries. This study includes a factor analysis and various correlation analyses based on relevant factors that emerge from the factor analysis.
- A comparison with previously published statistical studies of social, psychological, and cultural effects of collective danger.
- Various tests based on previous studies of tight versus loose cultures and other cultural variables presented in chapter 3.8.
We are using these methods to test the predictions of regality theory, explained in chapter 7. No other known theory generates the same set of predictions.
8.2. Ancient cultures, large sample
Regality theory predicts effects both at the individual level and at the level of whole societies. The predictions of social-level effects should preferably be tested on distinct sociocultural groups. We prefer to compare different societies that have as little connection with each other as possible in order to avoid spurious correlations due to cultural diffusion or common descent (Galton’s problem). Since almost all contemporary cultures are heavily influenced by modern western culture, we have used ethnographic data from non-industrial cultures of the past that were less influenced by global trends. The available archaeological data are insufficient for statistical testing, so we have used data mainly from ethnographic studies of non-industrial cultures.
Description of the data
Murdock and White’s Standard Cross-Cultural Sample (SCCS) is a database covering more than a thousand variables recorded for 186 non-industrial societies around the world.2 These societies are intended to form a representative sample of world cultures studied at a time when cultural independence was higher than today. The data are based on ethnographic records, many of which were collected by early explorers in the nineteenth and early twentieth centuries.
The variables include information about subsistence ecology, intergroup relations, political organization, culture, beliefs, and child—rearing practices.3 Relevant variables from the SCCS were used in this study. Statistical calculations were done in the R programming language.4
The quality of the data in the SCCS is far from perfect, but it is the best available. The data have been collected from the original ethnographic literature and coded into a database. This process involves many potential sources of error, despite elaborate precautions. The native informants that were interviewed, the anthropologists or explorers conducting the field studies, the coders who interpreted the original literature and coded it into predefined categories for the database, and the database designers who defined the variables and categories to include in the database—all of these people may have influenced the data by their own agendas, predilections, selectivity, taboos, and language problems. Most of the field studies were conducted many years ago, often by people without adequate scientific training, such as explorers and missionaries.
Re-reading some of the original ethnographic literature revealed several flaws in the database, mainly due to imprecise definitions of the categories in soft areas such as religion, morals, and psychology. The data in the SCCS appear to be severely influenced by the observers in the area of religion; some of the psychological variables depend on psychoanalytical interpretations; and the reliability of the data is questionable in taboo-ridden areas such as sexual behavior.5
Many data values in the SCCS are coded as missing, and it was suspected that data might be missing for non-random reasons. For some variables, more than half of the data values were missing. There is reason to suspect that the coders tended to err on the side of caution and entered the code for ‘data not available’ rather than ‘trait absent’ when a particular trait was not mentioned in the ethnographic literature for a particular society. This leads to a systematic bias, so that data are more likely to be coded as missing when a trait is absent than when it is present. This suspicion was tested statistically by correlating missingness for each of the variables against the factors that emerge from the factor analysis described below. This correlation was highly significant (p < 0.001) for several variables. It is quite understandable, for example, that the value for ‘leadership during battle’ is coded as ‘data not available’ if there is no battle, but the statistical models do not work correctly if data are missing for non-random reasons. Hence, it is better to replace ‘data not available’ with no ‘leadership during battle’ here. Similar replacements were made for the variables ‘despotic bias in conflict resolution’ and ‘interpersonal violence’.
Exploratory factor analysis
Regality theory predicts that many different variables are related to regality. If these variables are sufficiently strongly correlated, then they might form a single factor in a factor analysis. In other words, we will expect cultural indicators of regality, such as hierarchy and discipline, to load on the same factor as war and other indicators of collective danger. Collective danger and individual danger have different effects on regality but similar effects on r/K life history strategy, as explained in chapter 3.3. It will be interesting to see whether these turn out as two different factors or as a single factor.
The database includes more than a thousand variables for each society, but not all variables were relevant for the present study. Factor analysis requires that the number of variables must be less than the number of societies in order to avoid the covariance matrix becoming singular. It was therefore necessary to exclude a large number of variables and retain only those considered most relevant to the theory. Variables that had little or no relevance to the purpose of the current analysis, such as language and geographic region, were excluded. Also excluded were: categorical variables that could not be made ordinal, variables where more than half of the values were missing, and variables with low variance or high uniqueness. Unfortunately, many of the variables that are relevant to regality theory had to be excluded from the factor analysis because they had too many missing values, especially psychological variables and variables relating to childrearing.
Where a group of variables all relate to the same subject area, either the redundant variables were excluded or closely related variables were combined into one. After this reduction, ninety-one variables remained for the factor analysis (see table 8). These variables were normalized to unit variance.
Missing data was a big problem because the factor analysis model has no standard way of dealing with missing data. Missing values were replaced with appropriate values for three of the variables in the manner explained above. The factor analysis was performed twice on the same data set, using two different methods for dealing with the remaining missing data: (1) replacement with the mean, and (2) multiple imputation by the hot-deck method with population density as auxiliary variable.6 The second method gave higher variance and poorer correlation than the first method on those variables that had many missing values. The results of the factor analyses are shown in tables 6 and 7 respectively for these two methods.
|
Factor interpretation |
% variance explained |
|
Political complexity and population density |
7.9 |
|
War |
5.2 |
|
Other conflict and violence |
4.9 |
|
Agriculture |
4.1 |
|
Urbanization |
2.7 |
|
Animal husbandry |
2.6 |
|
Fishing |
2.1 |
|
Gathering |
1.9 |
Table 6. Factor analysis of sociocultural variables in 186 societies. Missing data values were replaced by the mean.
The number of factors was chosen to be eight based on a scree plot. Oblique rotation (Promax) was used in order to allow factors to be correlated. Detailed factor loadings are shown in table 8.
|
Factor interpretation |
Occurrences in 25 runs |
% variance explained |
Standard deviation between runs |
|
Political complexity and population density |
25 |
9.8 |
0.9 |
|
Climate |
25 |
5.1 |
0.3 |
|
War, conflict, and violence |
25 |
4.9 |
0.3 |
|
Animal husbandry |
25 |
3.3 |
0.7 |
|
Gathering |
24 |
2.0 |
0.3 |
|
Fishing |
23 |
2.8 |
0.9 |
|
Urbanization |
21 |
2.8 |
0.1 |
|
Hunting |
19 |
2.9 |
1.2 |
|
Agriculture |
11 |
3.6 |
0.8 |
|
Uninterpreted |
2 |
3.3 |
0.0 |
Table 7. Factor analysis of sociocultural variables in 186 societies. Same data as in table 6, but missing data values were replaced by multiple imputation in 25 runs.
Results
The first factor analysis (Table 6) shows that political complexity is highly correlated with population density, and these variables combine to form the strongest factor. The second factor represents intergroup conflict as well as its correlates. This factor has high loadings on variables related to war, army, and bellicosity (Table 8). The third factor has high loadings on both internal and external conflicts as well as individual violence. In other words, we have two factors that relate to conflict. These two conflict factors are both positively related to polygamy. Other indicators of life history strategy show only weak and inconsistent correlations with the two conflict factors.
It is interesting that the second factor (the war factor) has its highest loadings on prestige and rewards for warriors and cultural valuation of war (Table 8). This confirms the prediction of regality theory that warriors are rewarded by their group. Other theories of war rely on punishment of defectors, while rewards are too costly to be explained by traditional evolutionary theories (see chapter 2.2).
The two conflict factors merge into one in the second factor analysis (Table 7). The difference between the results of the two factor analysis methods is a mathematical artifact. The method used in the second factor analysis has a higher tendency to form factors around variables with few missing values. This is seen in the formation of a factor of climate variables, which have no missing values. While the first method probably gives more accurate results, the second method is useful for estimating the inaccuracy due to missing data.
It is noteworthy that the war factor is always distinct from population density and political complexity. This means that the level of war is not simply determined by population factors. The prediction that internal and external conflicts have different psychological and cultural effects gets weak support from the first factor analysis and no support from the second. We must conclude that the factor analyses do not give a clear answer to the difference between internal and external conflicts, due to mathematical problems and poor data quality.
Comparison with other studies
A similar factor analysis made earlier by Elbert Russell found a war factor that correlates clearly with social hierarchy, slavery, polygyny, achievement, and crime.7 Interestingly, the war factor in Russell’s study is also significantly correlated with a number of variables relating to sexual restrictiveness, tough treatment of children, and early socialization. The correlation with religious variables is weak. An interesting finding in Russell’s study is that people in warlike and hierarchical societies show a high level of boasting and display of wealth. The status competition and striving for wealth may lead to increased levels of theft and other crimes and conflicts.8 This finding may contribute to our understanding of the connection between external and internal conflicts. Another possible explanation is that, in warlike societies, boys are socialized for aggression.9 Other studies have found that the level of intergroup conflict is positively correlated with harsh and punitive treatment of children and socialization for aggression10 and a moralizing religion.11
A comprehensive meta-analysis of wars throughout history has found a number of correlations of war with large civilizations and empires, weapon technology, grasslands, social stratification, slavery, authoritarianism, boastfulness, crime, punishment, discipline, sexual repression, games of chance and strategy, and artistic creativity.12
Some of the predicted correlations have also been observed in modern cultures. Pippa Norris and Ronald Inglehart find that existential insecurity is linked with religiosity and high fertility,13 Nicholas Carnagey and Craig Anderson find increased pro-war attitudes,14 and Richard Sipes finds a link with warlike sports.15
A caveat is in place here when interpreting factor analysis results. The factors and factor loadings are quite sensitive to the design of the factor analysis and, in particular, to the choice of variables included in the analysis. Other cross-cultural studies have found only weak correlations with a war factor, or no war factor at all.16
|
Variable number |
Variable name |
F1 |
F2 |
F3 |
F4 |
F5 |
F6 |
F7 |
F8 |
|
V64, V156 |
Population density |
0.30 |
0.50 |
0.20 |
0.15 |
||||
|
V61 |
Fixity of settlement |
0.23 |
0.67 |
-0.25 |
0.13 |
0.20 |
|||
|
V62 |
Compactness of settlement |
0.30 |
-0.15 |
-0.18 |
-0.11 |
||||
|
V63 |
Community size |
0.91 |
|||||||
|
V66 |
Large or impressive structures |
0.39 |
0.25 |
-0.18 |
0.19 |
||||
|
V149 |
Writing and records |
0.66 |
-0.20 |
0.11 |
0.11 |
-0.11 |
|||
|
V152 |
Urbanization |
-0.13 |
0.93 |
||||||
|
V203 |
Dependence on gathering |
-0.11 |
-0.44 |
-0.14 |
-0.21 |
-0.92 |
|||
|
V204 |
Dependence on hunting |
-0.16 |
-0.74 |
-0.38 |
-0.27 |
||||
|
V205 |
Dependence on fishing |
-0.11 |
-0.16 |
-0.21 |
0.94 |
0.22 |
|||
|
V206 |
Dependence on animal husbandry |
-0.17 |
0.98 |
0.1 |
|||||
|
V207 |
Dependence on agriculture |
0.19 |
0.92 |
-0.29 |
-0.27 |
0.27 |
|||
|
V677 |
Migration |
-0.31 |
0.26 |
0.13 |
0.16 |
||||
|
V732 |
Importance of trade in subsistence |
0.13 |
-0.10 |
||||||
|
V1265 |
Occurrence of famine |
0.22 |
0.11 |
||||||
|
V1267 |
Severity of famine |
0.23 |
-0.12 |
||||||
|
V1684 |
Threat of weather or pest disasters |
0.14 |
0.17 |
||||||
|
V1685 |
Chronic resource problems |
-0.12 |
-0.11 |
0.15 |
0.15 |
||||
|
V1260 |
Total pathogen stress |
0.21 |
0.42 |
-0.25 |
|||||
|
V854 |
Niche temperature |
0.21 |
0.42 |
-0.24 |
-0.24 |
||||
|
V855 |
Niche rainfall |
-0.17 |
0.41 |
-0.3 |
0.19 |
0.11 |
|||
|
V921 |
Agricultural potential |
0.19 |
0.30 |
0.13 |
-0.20 |
-0.13 |
-0.20 |
||
|
V1122 |
Total population |
0.58 |
0.22 |
0.14 |
-0.13 |
||||
|
V157 |
Political integration |
0.91 |
|||||||
|
V1132 |
Political integration, state |
0.41 |
-0.12 |
0.15 |
0.12 |
||||
|
V158 |
Social stratification |
0.79 |
|||||||
|
V72 |
Intercommunity marriage |
0.10 |
-0.17 |
0.15 |
-0.39 |
0.12 |
|||
|
V861, V79 |
Polygamy |
-0.26 |
0.37 |
0.38 |
-0.20 |
||||
|
V82 |
Trend in autonomy |
0.51 |
-0.20 |
||||||
|
V83 |
Levels of sovereignty |
0.87 |
0.14 |
-0.11 |
|||||
|
V237 |
Jurisdictional hierarchy |
0.92 |
|||||||
|
V270 |
Class stratification |
0.77 |
|||||||
|
V272 |
0.21 |
0.22 |
-0.15 |
||||||
|
V274 |
0.11 |
0.22 |
0.22 |
0.12 |
|||||
|
V920 |
Proportion of slaves |
0.14 |
0.12 |
||||||
|
V79, V1133 |
Polygamy, maximum harem size |
0.13 |
0.22 |
0.28 |
-0.31 |
-0.26 |
-0.12 |
||
|
V1134 |
Despotic bias in conflict resolution |
0.41 |
0.32 |
-0.20 |
|||||
|
V1743 |
Sanctions |
0.18 |
-0.17 |
0.28 |
0.12 |
0.13 |
|||
|
V1650, V774, V892, V893, V670 |
Frequency of external warfare |
0.14 |
0.24 |
0.39 |
-0.12 |
||||
|
V892 |
Frequency of external war—Attacking |
0.16 |
0.56 |
0.13 |
-0.19 |
||||
|
V893 |
Frequency of external war—Being attacked |
0.46 |
-0.13 |
||||||
|
V668 |
Wives taken from hostile groups |
0.34 |
-0.12 |
0.10 |
0.14 |
||||
|
V894 |
Form of military mobilization |
0.27 |
0.53 |
||||||
|
V902 |
Leadership during battle |
0.40 |
0.45 |
0.15 |
|||||
|
V903 |
Prestige, soldiers or warriors |
-0.13 |
0.82 |
||||||
|
V905 |
Rewards for killing enemy |
-0.22 |
0.73 |
0.17 |
|||||
|
V907 |
Value of war |
0.72 |
|||||||
|
V908 |
Military success |
0.37 |
0.10 |
||||||
|
V909 |
Subjugation of territory or people |
0.61 |
|||||||
|
V1654 |
Pacification |
-0.23 |
-0.23 |
||||||
|
V1649, V1748, V773, V891 |
Frequency of internal warfare |
0.12 |
0.17 |
0.34 |
-0.11 |
0.13 |
|||
|
V666 |
Interpersonal violence |
-0.15 |
0.51 |
||||||
|
V906 |
Expect violence to solve problems |
0.54 |
|||||||
|
V1776 |
Intraethnic violence |
-0.16 |
0.42 |
0.16 |
|||||
|
V1665 |
Homicide |
0.17 |
0.56 |
||||||
|
V1666 |
Assault |
0.13 |
0.63 |
-0.15 |
|||||
|
V1667 |
Theft |
0.16 |
0.47 |
-0.18 |
|||||
|
V1676 |
Socially organized assault |
0.36 |
|||||||
|
V1677 |
Socially organized theft |
0.40 |
-0.14 |
||||||
|
V1678 |
Socially organized trespass |
0.23 |
0.20 |
||||||
|
V1721 |
Rich people |
-0.13 |
0.31 |
0.13 |
0.20 |
||||
|
V1726 |
Communality of land |
-0.28 |
-0.16 |
0.40 |
-0.13 |
||||
|
V24, V25 |
Bodily restrictiveness in infancy |
0.12 |
-0.16 |
-0.16 |
|||||
|
V31 |
Infant crying response |
0.24 |
-0.10 |
||||||
|
V33 |
Childhood pain infliction |
0.26 |
-0.12 |
0.10 |
|||||
|
V41 |
Autonomy—encouragement in childhood |
0.17 |
0.14 |
0.15 |
|||||
|
V43 |
Covering genitals—age |
0.18 |
-0.10 |
-0.11 |
0.30 |
||||
|
Variable number |
Variable name |
F1 |
F2 |
F3 |
F4 |
F5 |
F6 |
F7 |
F8 |
|
V44, V45 |
Weaning age |
-0.11 |
-0.10 |
0.19 |
-0.11 |
0.13 |
|||
|
V53, V54 |
Role of father, infancy/early childhood |
-0.25 |
|||||||
|
V242 |
Segregation of adolescent boys |
-0.18 |
0.40 |
||||||
|
V293 |
Duration of early childhood |
-0.14 |
0.24 |
||||||
|
V831, V832 |
Differentiation of adolescence from childhood |
0.12 |
0.13 |
||||||
|
V453, V454, V455, V456 |
Corporal punishment of boys/girls |
0.35 |
0.18 |
||||||
|
V667 |
Rape |
0.30 |
0.12 |
||||||
|
V34 |
Postpartum sex taboo |
0.21 |
0.13 |
-0.14 |
|||||
|
V671 |
Menstrual taboos |
0.28 |
0.20 |
||||||
|
V672 |
Male avoidance of female sexuality |
-0.18 |
0.29 |
0.11 |
|||||
|
V827, V828 |
Sexual expression in adolescent boys/girls |
0.20 |
0.26 |
-0.17 |
-0.13 |
||||
|
V829, V830 |
Lack of sexual restraint in adolescent boys/girls |
||||||||
|
V740 |
Marriage arrangements (female) |
0.15 |
0.28 |
0.20 |
-0.11 |
||||
|
V864 |
Rooming arrangement for wives |
0.28 |
0.27 |
0.27 |
-0.14 |
0.11 |
0.11 |
||
|
V868 |
Multiple wives for leaders, headman, chiefs |
0.14 |
0.37 |
-0.20 |
|||||
|
V664 |
Ideology of male toughness |
-0.11 |
0.32 |
||||||
|
V657 |
Flexible marriage mores |
-0.11 |
0.16 |
0.19 |
-0.17 |
0.12 |
|||
|
V661 |
Female political participation |
-0.26 |
0.21 |
-0.17 |
0.16 |
-0.12 |
|||
|
V665 |
Male segregation |
0.41 |
0.15 |
||||||
|
V238 |
High gods |
0.13 |
-0.13 |
0.33 |
-0.13 |
0.10 |
|||
|
V713 |
Classical religion |
-0.22 |
|||||||
|
V529, V530 |
Adolescent initiation ceremonies |
-0.13 |
0.12 |
0.33 |
-0.11 |
0.22 |
-0.25 |
||
|
V1188 |
Evil eye |
0.14 |
0.12 |
0.44 |
0.11 |
||||
|
V1694, V1695 |
Scarification |
-0.11 |
0.19 |
||||||
|
Total factor loading, square sum* |
7.20 |
4.72 |
4.49 |
3.71 |
2.42 |
2.40 |
1.91 |
1.74 |
Table 8. Factor loadings for factor analysis of table 6. *Values below 0.1 are not shown in the table because they are insignificant, but included in the square sum.
Structural equation model
The purpose of a structural equation model is to study latent variables that cannot be observed directly, but only through their causes and effects. The theoretical constructs ‘regality’ and ‘life history strategy’ are latent variables that we cannot observe or measure directly.
Figure 29 shows a structural equation model based on the same data as used above in the factor analysis. Several indicators related to intergroup war are combined into a war variable. The regality dimension is inserted as a latent variable based on the war variable and a number of cultural indicators according to the theory. The r versus K life history strategy dimension is also inserted as a latent variable based on internal and external war as well as other dangers and cultural indicators of life history strategy. ‘Sexual morals’ is included as another latent variable, because sexual behavior could rarely be observed directly. The influences of cultural regality and life history strategy on sexual morals are included in the model.
Missing values are replaced with appropriate values for those variables where missingness correlates significantly with the factors in the exploratory factor analysis and where the reason for data missing is clear, in the same way as for the factor analysis. Missing values are replaced by the mean for the remaining variables.
Relevant variables according to the theory are included, but variables that fail to reach significance at the 0.05 level are removed. Unfortunately, most of the variables used by Robert Quinlan as indicators of parental investment fail to reach significance in the present model.17 A few variables that relate to parental investment remain significant, while only one variable related to art and three variables related to religion remain significant.
The removal of non-significant variables may have caused selection bias resulting in false significance. Ideally, the confirmatory test on the structural equation model should not use the same data set as the exploratory factor analysis. Unfortunately, no extra data set is available, since the number of relatively independent cultures is limited. This is a general problem in cross-cultural research.
The model is analyzed with the R package named ‘lavaan’.18
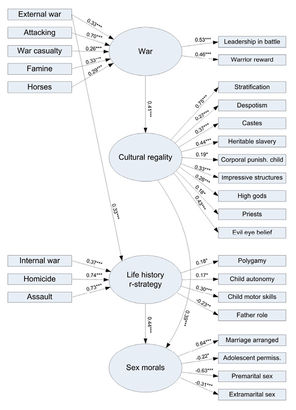
Figure 29. Structural equation model showing the influence of collective dangers and individual dangers on cultural regality and life history strategy, as well as the influence of both of these variables on sexual morals. Rectangles indicate measured variables while ovals indicate latent variables. The directions of the arrows indicate the assumed dominating direction of causality, but the statistical results are insensitive to the directions of these arrows. It is impossible to distinguish between cause and effect with this method. Numbers on the arrows are path coefficients. Levels of significance are indicated as: * p ≤ 0.05, ** p ≤ 0.01, *** p ≤ 0.001. (Measures of fit: RMSEA = 0.076, 90% CI: 0.067–0.084, SRMR = 0.091, CFI = 0.61, AIC = 13782). By Agner Fog, 2017.
The structural equation model shown in figure 29 is based on the theory that war and other collective dangers influence the level of regality while both collective dangers and individual dangers influence the life history strategy. Both factors influence sexual behavior. Various cultural indicators of regality and life history strategy are included in the model.
The war factor emerges from the level of war and various indicators that we expect to be correlated with war. The results suggest that famine is a significant cause of war. The availability of efficient means of transportation (horses) appears to be a significant contributing factor as well.
The war factor is significantly correlated with rewards for successful warriors. There are few variables relating to cowardice and desertion, and these variables show no significant correlation. The database has no variable indicating punishment for defection in war. Therefore, we have more support for the theory that attaches importance to the rewarding of brave warriors than to the alternative theory that relies on the punishment of defectors only.
The cultural regality is modeled here as a latent variable that is influenced by war and other collective dangers. However, the regality is also influenced by unmeasured factors such as cultural traditions and subjective beliefs about dangers, including religious beliefs. A number of cultural indicators of regality are included in the model, and it is confirmed that they fit into the model with highly significant path coefficients.
The life history strategy is influenced by internal and external conflict as well as by other dangers. Only a few cultural indicators of life history strategy and parental investment are included in the model. Several other indicators of life history strategy were excluded because they failed to give significant coefficients.
Sexual morals are influenced by both the regality dimension and by the life history dimension, and reflected in various attitudes towards sexuality and marriage. No reliable measure of fertility was available, but we may assume that strict sexual morals lead to high fertility. The hypothesis is that strict sexual morals allow only reproductive sex within marriage, while sex for pleasure is suppressed. This puts pressure on young people to marry early and have many children because alternative outlets for their sex drive are blocked.19
The results from the structural equation model confirm that cultural regality is connected with political stratification, caste stratification, despotism, and slavery. These results are highly significant. The connection with disciplining of children is weaker, but still statistically significant (p = 0.013). Few relevant variables relating to art are available, but the presence of large or impressive structures (such as large buildings) has a highly significant connection to cultural regality. Three variables relating to religion are also significant. Finally, it is confirmed that sexual morals are influenced in the strict direction by both cultural regality and life history r-strategy. No direct path between regality and life history strategy was found.
Various correlation coefficients are given in table 9. The correlation between regality and life history strategy is moderate but highly significant (p = 7∙10-4). Regality is also significantly correlated with population density and with various modes of subsistence.
|
Variable |
Regality |
Life history strategy |
War |
|
Regality |
0.25*** |
0.49*** |
|
|
Population density |
0.52*** |
0.11 |
0.20** |
|
Political integration |
0.73*** |
0.21** |
0.43*** |
|
Urbanization |
0.48*** |
0.04 |
0.31*** |
|
Agriculture |
0.41*** |
0.13 |
0.15* |
|
Animal husbandry |
0.43*** |
0.09 |
0.17* |
|
Hunting |
-0.49*** |
-0.10 |
-0.09 |
|
Gathering |
-0.50*** |
-0.13 |
-0.22** |
|
Fishing |
-0.25*** |
-0.11 |
-0.15* |
|
Warrior reward |
0.10 |
0.12 |
0.58*** |
|
Warrior prestige |
0.18* |
0.15* |
0.61*** |
Table 9. Correlation coefficients of selected variables against cultural regality, life history strategy, and war. Level of significance: * p ≤ 0.05, ** p ≤ 0.01, *** p ≤ 0.001.
While the structural equation model supports our theory, it is not a definite proof. It may be possible to construct other models that fit the data equally well.20
Multiple correlation analysis
A simultaneous multiple correlation analysis was made for several variables according to the linear model
v = k0 + k1 f1 + k2 f2 + k3 f3 + ε
where v is any of the variables in the standard cross-cultural sample. f1 represents cultural regality and f2 represents life history r-strategy, both obtained from the structural equation model. f3 is the population density, which was included in the model because it is a very likely confounding factor according to the results of the factor analysis. k0, k1, k2, and k3 are coefficients, and ε is the residue of unexplained variance. The levels of significance for k1, k2, k3 ≠ 0 were calculated.
The results of the multiple correlation analysis for various variables, v, are shown in table 10. There is a correlation of regality with agriculture, which disappears when population density is controlled for, as we can see when comparing tables 9 and 10, while the correlations of regality with other means of subsistence remain significant. The correlation of sexual morals with both regality and life history strategy remains significant when population density is controlled for. Polygamy is significantly related to life history strategy but, contrary to expectation, not to cultural regality in this test. The expected correlation between regality and suicide was not found. The variable named ‘classical religion’ is a mixture of very different religions and therefore not as specific as we would wish, but it is included in table 10 because it has a significant correlation with regality.
|
Variable |
Regality |
Life history strategy |
Population density |
|
Political integration |
0.59*** |
0.04 |
0.27*** |
|
Urbanization |
0.26*** |
-0.07 |
0.46*** |
|
Agriculture |
0.07 |
0.05 |
0.63*** |
|
Animal husbandry |
0.47*** |
-0.01 |
-0.08 |
|
Hunting |
-0.21** |
0.01 |
-0.55*** |
|
Fishing |
-0.20* |
-0.06 |
-0.06 |
|
Gathering |
-0.30*** |
-0.01 |
-0.37*** |
|
Sexual morals |
0.42*** |
0.42*** |
-0.11 |
|
Trend in autonomy |
0.24** |
0.02 |
0.19* |
|
Urbanization |
0.26*** |
-0.07 |
0.46*** |
|
Class stratification |
0.85*** |
-0.11** |
0.04 |
|
0.52*** |
-0.08 |
-0.08 |
|
|
0.27** |
-0.03 |
-0.04 |
|
|
0.63*** |
0.00 |
-0.17* |
|
|
Polygamy |
-0.04 |
0.24** |
-0.13 |
|
Suicide |
-0.01 |
0.38*** |
-0.09 |
|
Formal sanctions |
0.23** |
0.10 |
0.14 |
|
Horses |
0.22* |
-0.12 |
-0.18* |
|
Classical religion |
-0.24** |
0.10 |
-0.09 |
|
High gods |
0.41*** |
-0.05 |
-0.15 |
|
Evil eye beliefs |
0.55*** |
0.03 |
-0.05 |
Table 10. Multiple regression of various variables against regality, life history strategy, and population density. Level of significance: * p ≤ 0.05, ** p ≤ 0.01, *** p ≤ 0.001.
8.3. Subsample, 18 cultures
A subsample of eighteen of the cultures represented in the Standard Cross-Cultural Sample (SCCS) was selected for further study, and the desired data were extracted from the original ethnographic literature rather than from the SCCS database. This method was intended to reduce the problems with data quality and to obtain information that was not available in the SCCS.
The literature listed as sources for the SCCS21 was supplemented by any additional literature published later. All coding of data was done by the author. Every conscious effort was made to avoid expectation bias. No funding was available for hiring extra raters or testing inter-rater reliability. A brief description of each society including an explanation of how it is evaluated and the literature used is provided in chapter 7.
The purpose of the subsample study is to test the prediction that certain environmental factors influence the level of intergroup conflict, which in turn influences the social and cultural indicators that we associate with regal and kungic cultures.
Many of the cultural traits that we would like to test—especially those that belong to soft areas such as religion, sexuality, discipline, treatment of children, and art—are poorly represented in the standard cross-cultural sample. The relevant variables are either not included in the SCCS database, or they are unreliable, or they have too many missing values. The data in the database are coded into simple categories and values that may be poor representations of the complex behaviors, beliefs, and social structures in the cultures that we study. It is difficult to guess what the human realities are that lie behind a number in a database.
Firsthand observation and collection of the missing data is no longer a possibility, because the cultures in question have been heavily transformed by modernization if not completely annihilated or absorbed into modern cultures. We must resort to the original ethnographic literature and hope that we can find the missing data there. Using this literature has the advantage that the data are presented in a coherent and meaningful way. Therefore, it was decided to extract the relevant data from the original ethnographic literature for a subset of the cultures represented in the SCCS.
The subsample was selected on the basis of the following criteria:
- The selected cultures must be geographically, culturally, and genetically distant from each other in order to minimize similarity due to cultural diffusion or common descent (Galton’s problem).
- The cultures should be different in terms of subsistence ecology. Where multiple cultures resemble each other too much, only one is included.
- The population of each society must have lived in relative isolation long enough to develop a distinct culture and language.
- The influence from modern cultures must be minimal.
- The culture is not pacified by any colonial authority or other external power.
- The culture must be well described by more than one ethnographer.
Many cultures had to be excluded for not meeting these criteria. In particular, criteria 4 and 5 were difficult to meet.
The subsample consists of eighteen cultures that were selected for further study. The ethnographic literature for the selected cultures was studied in order to extract sociocultural information relevant to the theory. A number of cultural variables were evaluated in order to test if the correlations predicted by our theory could be confirmed.
The different types of conflict, such as war, raiding, and feuding are often difficult to distinguish, and this is a serious problem for the testing of regality theory. Feuding is usually motivated by the desire to obtain justice by retaliating against the perpetrator of some wrongdoing or against his or her family. This takes place mostly where there is no organized system of justice, which is typical for a kungic culture. Territorial war, on the other hand, is expected mainly in regal cultures, according to our theory. Any confusion between feuding and territorial war will thus tend to blur the statistics. Unfortunately, it is difficult to determine whether the main motive behind a raid is retaliation, plundering, capturing women, or territorial expansion. For example, anthropologists cannot agree whether Yanomamo Indians fight over women, hunting territory, or steel tools.22
It was decided to use environmental, ecological, and technological parameters, rather than the level of war, as the independent variable in order to avoid the difficulties in determining the level of war and distinguishing between different motives for conflict. A statistical correlation cannot distinguish between cause and effect, but it seems reasonable to assume that the environment influences the culture more than the culture influences the environment, even when the available technology is included as an environmental factor. The semi-fixed status of ecological environment and available technology makes statistics based on these factors less ambiguous in terms of distinguishing between cause and effect.
The assumptions about environmental causation of conflict do not hold when the society is pacified by colonial rule or other foreign powers. This is the reason why pacified and modernized societies are excluded from our subsample.
To summarize, the prediction we want to test is that environmental and technological factors that enable intergroup conflict are positively correlated with those sociocultural variables that indicate a regal culture, as the theory claims. Other environmental factors that threaten a sociocultural group, such as unpredictable natural disasters, may also have an influence in the regal direction.
The statistical tests use rank correlation. This is a non-parametric test that makes no assumption about linear relationships or normal distribution, unlike the previous tests. Kendall’s tau, τ, was calculated and the level of significance, p, was calculated for the one-tailed tests. There was no control for confounding factors. Most variables were evaluated on an arbitrary five-point scale as follows.
Expected conflict level. The expected conflict level is evaluated on a five-point scale, where 1 indicates that intergroup conflict is unlikely because of environmental factors or niche specialization, and 5 indicates that environmental factors make large scale war possible and likely.
War or intergroup conflict. The observed level of intergroup conflict is interpreted as the frequency, intensity, degree of violence, and casualty rate of conflicts against other social groups that do not have the same self-defined ethnic or tribal identity. Territorial conflicts are given higher weight than plundering and retaliation of injustice. (In the coding used, 1 = no intergroup conflict; 2 = only small raids, feuds, or vendettas; 3 = rare or low scale intergroup conflict; 4 = intermediate intergroup conflict; 5 = frequent large wars).
Internal conflicts and feuds. Internal or intragroup conflicts are conflicts between people with the same ethnic or tribal belonging. Examples are conflicts between families over properties or marriage, or conflicts between leaders and followers. Feuds are series of retaliations over real or alleged wrongdoing. The theory predicts that intergroup conflicts, but not necessarily internal conflicts, are positively correlated with regal indicators. (Coded as 1 = rare internal conflicts; 5 = frequent internal conflicts).
Political system. A hierarchical political system with strong centralized power is expected in a regal society. In a kungic society, we will expect an egalitarian political system with little or no hierarchy, or in extreme cases no formal system of leadership at all. (Coded as 1 = no leadership, or simple political system; 2 = formal leadership; 4 = complex or varying political system; 5 = strong and highly hierarchical political system).
Justice and punishment. We expect a strict justice system and harsh punishments in a regal society, but a mild or lenient degree of punishment in a kungic culture. (Coded as 1 = mild or lenient punishment; 2 = somewhat mild punishment; 4 = somewhat strict punishment; 5 = very strict punishment).
Religion. We expect the religion in a regal society to support the power structure by mirroring or being part of the hierarchical political structure and by legitimizing or exalting the ruler. The religion in a regal culture often has a disciplining function by enforcing strict rules, possibly with supernatural punishments. The religion in a kungic culture is typically non-discriminatory and not connected with political power, discipline, elitism, dogmatism, or strict rules, according to the theory. (Coded as 1 = mild, unorganized, or non-authoritarian religion; 2 = religion supports politics; 4 = some disciplining connected with religion; 5 = strict religion, legitimizes ruler).
Group identity. We expect people to be hostile to strangers and have a strong sense of ethnic or tribal identity in a regal society. We expect less distinction between ‘them’ and ‘us’ in a kungic culture. (Coded as 1 = low sense of group identity; 3 = hostility to strangers; 5 = high sense of group identity).
Fertility. We expect people to have more children in a regal than in a kungic society. Kungic cultures may keep the birth rate down by means of postpartum sexual taboos, long breastfeeding periods, contraceptive means, abortion, or infanticide. (Coded as 1 = low fertility; 3 = medium fertility; 5 = high fertility).
Suicide. We expect the incidence of suicide to be higher in kungic than in regal cultures.23 This applies only to the types of suicide that Durkheim has labeled anomic and egoistic suicide,24 not to culturally prescribed suicide or self-sacrifice in battle. (Coded as 1 = rare or no mention of suicide; 3 = suicide occurs; 5 = suicide is common).
Sexual morals. We expect regal societies to have strict taboos and rules regulating sexual behavior, including bans on premarital and extramarital sex. Kungic societies are likely to be more tolerant of a variety of sexual behaviors. (Coded as 1 = lax, permissive sexual morals; 3 = mixed or intermediate sexual morals; 5 = strict sexual morals).
Marrying age. We expect the marrying age to be lower in regal than in kungic societies. The marrying age is recorded separately for men and women. Where the literature specifies a range for the marrying age, the median of this range is used in the statistics.
Divorce. We expect divorce to be easier and more tolerated in kungic than in regal societies. (Coded as 1 = divorce is rare, difficult; 3 =divorce occurs; 5 = divorce is easy, frequent).
Children work. We expect children to work harder, and from an earlier age, in regal than in kungic societies. (Coded as 1 = children do not work; 3 = children do some work; 5 = children work a lot, or from an early age).
Art. Different cultures produce different kinds of art. We are considering many different forms of art, including carving, painting, sculptures, decorated clothing, body adornment, architecture, and other material art, as well as poetry, tales, drama, music, singing, and dance. We expect the artistic production of regal cultures to be highly embellished and perfectionist, possibly glorifying representatives or symbols of power. We expect kungic cultures to produce a more individualistic art with less conformity. (Coded as 1 = simple, individualistic art; 3 = somewhat embellished art; 5 = embellished, repetitive, stylized art).
The evaluation of these variables for the eighteen societies is summarized in table 11. A rank correlation of these variables against the predicted conflict level is shown in the table. A review of the analysis of each culture is given in chapter 7.
|
Culture |
Expected conflict level based on environment |
War or intergroup conflict |
Internal conflict, feuds |
Political system |
Justice, punishment |
Religion |
Group identity |
Fertility |
Suicide |
Sexual morals |
Marrying age, men |
Divorce |
Children work |
Art |
|
|
1 |
1 |
1 |
1 |
1 |
1 |
1 |
1 |
1 |
1 |
26 |
15.5 |
5 |
1 |
1 |
|
|
Inuit |
1 |
1 |
3 |
1 |
1 |
1 |
1 |
1 |
5 |
1 |
18 |
15 |
5 |
1 |
1 |
|
Gilyak |
1 |
1 |
5 |
1 |
1 |
1 |
1 |
1 |
5 |
1 |
22.5 |
na |
5 |
na |
3 |
|
2 |
1 |
1 |
1 |
1 |
1 |
3 |
1 |
3 |
1 |
18 |
16 |
5 |
1 |
1 |
|
|
Yahgan |
2 |
1 |
5 |
1 |
2 |
2 |
3 |
5 |
1 |
3 |
18 |
15 |
3 |
3 |
1 |
|
2 |
3 |
1 |
1 |
1 |
4 |
3 |
5 |
1 |
1 |
21 |
19 |
3 |
3 |
1 |
|
|
Andaman |
2 |
3 |
5 |
1 |
1 |
1 |
3 |
1 |
1 |
1 |
20 |
18 |
1 |
3 |
1 |
|
Arrernte |
2 |
3 |
5 |
1 |
4 |
1 |
1 |
1 |
1 |
1 |
na |
na |
3 |
1 |
1 |
|
Yi |
3 |
5 |
5 |
2 |
2 |
1 |
3 |
na |
5 |
1 |
13 |
13 |
3 |
3 |
3 |
|
Yanomamo |
3 |
4 |
5 |
1 |
1 |
1 |
1 |
3 |
1 |
3 |
na |
na |
5 |
3 |
1 |
|
Apache |
4 |
4 |
5 |
1 |
5 |
4 |
na |
na |
3 |
5 |
20 |
18.5 |
na |
na |
3 |
|
Maasai |
4 |
5 |
3 |
2 |
2 |
2 |
5 |
5 |
3 |
1 |
28 |
17 |
5 |
5 |
3 |
|
4 |
5 |
5 |
4 |
2 |
5 |
na |
na |
1 |
5 |
21 |
16 |
5 |
5 |
3 |
|
|
5 |
5 |
5 |
4 |
4 |
4 |
3 |
3 |
1 |
3 |
na |
na |
1 |
3 |
3 |
|
|
5 |
5 |
1 |
5 |
4 |
4 |
3 |
5 |
1 |
3 |
20.5 |
15 |
5 |
3 |
3 |
|
|
Ganda |
5 |
5 |
1 |
5 |
5 |
2 |
5 |
5 |
1 |
5 |
15.5 |
14 |
5 |
5 |
1 |
|
5 |
5 |
1 |
5 |
5 |
5 |
na |
na |
1 |
5 |
25 |
18 |
1 |
5 |
5 |
|
|
Babylon |
5 |
5 |
1 |
5 |
5 |
5 |
na |
na |
1 |
3 |
29 |
17 |
na |
5 |
5 |
|
τ |
.85 |
-.18 |
.80 |
.72 |
.63 |
.61 |
.60 |
-.34 |
.62 |
.10 |
.04 |
-.15 |
.70 |
.57 |
|
|
p |
.00002 |
.20 |
.00006 |
.0002 |
.001 |
.007 |
.01 |
.06 |
.002 |
.34 |
.45 |
.27 |
.0009 |
.004 |
Table 11. Rank correlation of various sociocultural parameters against the expected conflict level for eighteen non-industrial cultures. Variables are indicated on a scale of 1 to 5 as described above, except for marrying age, which is indicated by the median. τ = Kendall’s tau; p = level of significance, one-tailed; na = data not available.
Table 11 is sorted by expected conflict level. At the peaceful beginning of the table, we find isolated cultures, such as the Inuit and the Gilyak, and niche cultures, such as the Mbuti pygmies and !Kung bushmen. At the high-conflict end of the table, we find empires such as the Babylonians and the Incas. This corresponds to the regality scale with kungic cultures at the beginning of the table and regal cultures at the end. Values of p below 0.05 are considered statistically significant. We can see that most of the correlations are in the predicted direction and highly significant.
First, we notice that there is a strong correlation between the expected conflict level and the observed level of war and conflict. This is a strong confirmation of the hypothesis that the level of war in non-modern societies is determined mainly by environmental factors. The cultures with a typical niche ecology, such as !Kung, Mbuti, and Warao, are all found to be peaceful and kungic. The same is the case for isolated cultures and cultures with scramble competition for food, such as Inuit and Yahgan. This indicates that competition over food sources is a major cause of conflict and that other reasons for violent intergroup conflict are less important in non-modern cultures.
The correlation for ‘internal conflicts and feuds’ shows a slightly negative, and non-significant, correlation with the expected conflict level. This confirms that the distinction between intergroup and intragroup conflicts is important, as predicted by our theory.
The correlations for ‘political system’, ‘justice and punishment’, ‘religion’, ‘sexual morals’, ‘children work’, and ‘art’ are all highly significant with p levels below 0.01. These results give strong support to regality theory. ‘Group identity’ and ‘fertility’ are significant at the 0.01 level.
Suicide seems to be more common in kungic than in regal societies, as predicted, but the correlation is only marginally significant (p = 0.06). It should be noted here that it was difficult to find reliable data for suicide and that it was difficult to distinguish between the different motives for suicide.
Divorce shows a weak correlation in the expected direction, but not a significant one. This correlation is weakened by the higher incidence of polygamy in regal societies.
There was no noticeable correlation between marrying age and expected conflict level. The data for marrying age were quite inaccurate, but this is probably not the only explanation for the absence of correlation. It appears that marrying age is determined more by economic factors and level of education than by ecology.
The significant correlation of sexual morals with regality is interesting because cultural differences in sexual morals are difficult to explain by other theories. We observe that the sexual morals are permissive in kungic societies and strict in most regal societies. But not all regal societies have strict sexual morals. For example, premarital sex is common among the unmarried Maasai warriors, and extramarital sex is common among the Hausa. High-ranking and prestigious men in regal cultures have the power to give themselves more sexual opportunities than the morals would otherwise dictate.
8.4. Contemporary cultures, large sample
Data and methods
The Survey of World Views project is a psychometric study based on a survey of data from 8,883 persons in 33 countries carried out in 2012. The participants were mainly college students who were rewarded for filling out an online questionnaire with 293 questions. The methods are described in detail by Gerard Saucier and coworkers.25 A copy of the raw data files was kindly provided by Saucier.
An exploratory factor analysis on the complete data set was performed first in order to identify relevant items with significant factor loadings. A scree plot, given in figure 30, shows that there are at least four important factors. These factors could be interpreted as follows:
- Universalism ethics, benevolence, and self-direction
- Cynicism, traditional family values, spirit beliefs, materialism, violence
- Religiousness
- Egalitarian society
The factor interpretations were less clear when more factors were included.
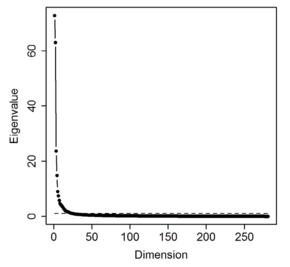
Figure 30. Scree plot for factor analysis of World Views Survey, 2012. By Agner Fog, 2017.
Construction of variables
Twelve composite variables were constructed for the purpose of the current analysis. Each variable was formed by a combination of questionnaire items. These items were selected based on their theoretical relevance and on their loadings in the exploratory factor analysis. Items with low factor loadings and items with ambiguous interpretations were not included. The composite variables are listed in table 12. The items were scored on various Likert scales with different numbers of points, some of them with a forced choice. All items and variables were scaled in order to obtain equal weighting.
Table 12. Variables constructed from Survey of World Views items. α values are Cronbach’s alpha, which is a measure of internal consistency in the variable.
The items included in each variable express the theoretical concepts less clearly than we could wish. This is a consequence of the current state of cross-cultural psychology, where it is not yet known which variables are most important.26 Theories about causal relationships are not very developed. Many of the questionnaire items were formulated without any clear underlying theory and definitely without any knowledge of regality theory. A discussion of the quality of each variable is in place here:
- The items included in ‘perceived danger’ are somewhat abstract and probably do not capture the full diversity of collective dangers and the distinction between individual and collective dangers that regality theory presupposes.
- The variable ‘want tough leader’ depends on just a single item that expresses a rather extreme opinion.
- The variable ‘bellicosity’ does not include any items relating explicitly to war, as there were no such items in the questionnaire. The Cronbach’s alpha is low, indicating some inconsistency.
- The variable ‘discipline’ includes items relating both to behavior and opinion. It covers the concept well.
- The variable ‘hierarchy’ reflects only a subjective evaluation of the hierarchy of the culture in question, with no standard or reference specified. People tend to evaluate things with their own culture as a frame of reference. Evaluating a culture with the same culture as reference makes little sense.27 It is possible that participants have used some other culture as reference when answering the questions, but it is also possible that they have used their own idea of an ideal society as reference. Thus, a participant indicating that the level of hierarchy is high may actually mean ‘higher than I would like’.
- It was expected that ‘egalitarianism’ would be the opposite of ‘hierarchy’ and that these two concepts would load on the same factor with opposite signs. However, the exploratory factor analysis showed, quite surprisingly, that egalitarianism and hierarchy loaded on different factors and that they had in fact a significant positive correlation with each other, rather than a negative one. This paradox may be due to acquiescence bias: some people tend to answer ‘yes’ to anything. The items under ‘egalitarianism’ are general statements that are easy to agree with, and none of these items are reverse scored. The problems with ‘egalitarianism’ are further discussed on page 263.
- The variables ‘conformity’ and ‘xenophobia’ contain enough relevant items to express the concepts adequately.
- The variable ‘religiosity’ reflects the strength of religious beliefs and the involvement in religious activities, but perhaps not the strictness of religious observance or the disciplining function of the religion, which would be more relevant to regality theory.
- The variable ‘cynicism’ was included because it turned up strongly in the factor analysis with significant correlations to relevant variables. Cynicism is related to a pessimistic worldview, but the relationship of this variable with regality has not been fully investigated yet.
- The variable ‘violence’ does not adequately distinguish between organized or socially sanctioned violence and simple crime and rage, or between group-internal and external conflicts. However, it may be related to collective danger in its broadest sense.
- ‘Patriarchy’ includes values and opinions that have been thoroughly described in the literature. The questions are appropriate and consequently the alpha is high.
Correlations of the variables
There are significant differences between countries for all of the variables defined here. For example, many of the variables correlate strongly with the gross domestic product (GDP) and the human development index (HDI) of the countries, as shown in table 13. Therefore, we need to control for country-specific effects in the statistical investigations of relationships between these variables.
|
Variable |
Human development index |
log gross domestic product |
|
perceived danger |
-0.71*** |
-0.71*** |
|
want tough leader |
-0.71*** |
-0.75*** |
|
bellicosity |
-0.35* |
-0.37* |
|
discipline |
-0.60*** |
-0.59*** |
|
hierarchy |
-0.28 |
-0.32 |
|
egalitarianism |
-0.46** |
-0.45** |
|
conformity |
-0.73*** |
-0.75*** |
|
xenophobia |
-0.60*** |
-0.66*** |
|
religiosity |
-0.72*** |
-0.72*** |
|
cynicism |
-0.71*** |
-0.74*** |
|
violence |
-0.33 |
-0.39* |
|
patriarchy |
-0.63*** |
-0.66*** |
Table 13. Correlation coefficients (r) of the country average of each variable with HDI and GDP. Levels of significance: * p < 0.05, ** p < 0.01, *** p < 0.001.28
The country-specific effects are not limited to economic factors. Environmental factors and cultural differences are also very likely to influence these variables. We can get an indication of the influence of all country-specific factors on each variable by testing how much of the variance in each variable is accounted for by between-country differences. Table 14 lists the correlation of each variable with country differences. The correlation coefficients in table 13 are mostly higher than in table 14 because the former is looking at country averages while the latter is looking at differences between individuals.
|
Variable |
Correlation with country differences |
|
perceived danger |
0.19*** |
|
want tough leader |
0.53*** |
|
bellicosity |
0.34*** |
|
discipline |
0.39*** |
|
hierarchy |
0.40*** |
|
egalitarianism |
0.29*** |
|
conformity |
0.48*** |
|
xenophobia |
0.53*** |
|
religiosity |
0.65*** |
|
cynicism |
0.37*** |
|
violence |
0.28*** |
|
patriarchy |
0.55*** |
Table 14. Correlation coefficients (r) of each variable with country differences. Level of significance: *** p < 0.001.
The next step in our analysis is to study the correlations between the variables while controlling for country differences. Table 15 lists all pairwise correlations between two variables with country differences as control. We can see that most of the variables are correlated significantly with each other, even after controlling for confounding country differences. The averages of each variable within each nation are listed in table 16.
|
Variable |
perceived danger |
want tough leader |
bellicosity |
discipline |
hierarchy |
egalitarianism |
conformity |
xenophobia |
religiosity |
cynicism |
violence |
patriarchy |
|
perceived danger |
1 |
0.17 *** |
0.11 *** |
0.01 |
0.22 *** |
0.22 *** |
0.12 *** |
0.13 *** |
0.09 *** |
0.37 *** |
0.19 *** |
0.16 *** |
|
want tough leader |
0.17 *** |
1 |
0.08 *** |
0.18 *** |
0.02 |
0.07 *** |
0.37 *** |
0.24 *** |
0.27 *** |
0.20 *** |
0.07 *** |
0.30 *** |
|
bellicosity |
0.11 *** |
0.08 *** |
1 |
-0.35 *** |
-0.07 *** |
-0.27 *** |
-0.10 *** |
0.32 *** |
-0.09 *** |
0.51 *** |
0.51 *** |
0.19 *** |
|
discipline |
0.01 |
0.18 *** |
-0.35 *** |
1 |
0.11 *** |
0.36 *** |
0.47 *** |
-0.10 *** |
0.29 *** |
-0.29 *** |
-0.41 *** |
0.08 *** |
|
hierarchy |
0.22 *** |
0.02 |
-0.07 *** |
0.11 *** |
1 |
0.28 *** |
0.02 |
-0.11 *** |
-0.05 *** |
-0.01 |
-0.08 *** |
-0.05 *** |
|
egalitarianism |
0.22 *** |
0.07 *** |
-0.27 *** |
0.36 *** |
0.28 *** |
1 |
0.14 *** |
-0.22 *** |
0.05 *** |
-0.20 *** |
-0.28 *** |
-0.05 *** |
|
conformity |
0.12 *** |
0.37 *** |
-0.10 *** |
0.47 *** |
0.02 |
0.14 *** |
1 |
0.23 *** |
0.45 *** |
0.05 *** |
-0.08 *** |
0.39 *** |
|
xenophobia |
0.13 *** |
0.24 *** |
0.32 *** |
-0.10 *** |
-0.11 *** |
-0.22 *** |
0.23 *** |
1 |
0.16 *** |
0.45 *** |
0.37 *** |
0.36 *** |
|
religiosity |
0.09 *** |
0.27 *** |
-0.09 *** |
0.29 *** |
-0.05 *** |
0.05 *** |
0.45 *** |
0.16 *** |
1 |
0.00 |
-0.07 *** |
0.35 *** |
|
cynicism |
0.37 *** |
0.20 *** |
0.51 *** |
-0.29 *** |
-0.01 |
-0.20 *** |
0.05 *** |
0.45 *** |
0.00 |
1 |
0.59 *** |
0.31 *** |
|
violence |
0.19 *** |
0.07 *** |
0.51 *** |
-0.41 *** |
-0.08 *** |
-0.28 *** |
-0.08 *** |
0.37 *** |
-0.07 *** |
0.59 *** |
1 |
0.25 *** |
|
patriarchy |
0.16 *** |
0.30 *** |
0.19 *** |
0.08 *** |
-0.05 *** |
-0.05 *** |
0.39 *** |
0.36 *** |
0.35 *** |
0.31 *** |
0.25 *** |
1 |
Table 15. Partial correlation coefficients between all pairs of two variables, controlling for country differences. Levels of significance: *** p < 0.001.
|
Nation |
perceived danger |
want tough leader |
bellicosity |
discipline |
hierarchy |
egalitarianism |
conformity |
xenophobia |
religiosity |
cynicism |
violence |
patriarchy |
|
Argentina |
0.52 |
0.56 |
0.19 |
0.81 |
0.77 |
0.76 |
0.60 |
0.33 |
0.40 |
0.25 |
0.17 |
0.37 |
|
0.40 |
0.37 |
0.31 |
0.72 |
0.60 |
0.74 |
0.54 |
0.28 |
0.33 |
0.19 |
0.20 |
0.33 |
|
|
Bangladesh |
0.70 |
0.80 |
0.41 |
0.78 |
0.76 |
0.83 |
0.68 |
0.67 |
0.64 |
0.50 |
0.36 |
0.59 |
|
Brazil |
0.54 |
0.29 |
0.16 |
0.74 |
0.81 |
0.85 |
0.52 |
0.22 |
0.49 |
0.21 |
0.15 |
0.23 |
|
0.43 |
0.38 |
0.29 |
0.71 |
0.61 |
0.72 |
0.54 |
0.29 |
0.37 |
0.21 |
0.21 |
0.35 |
|
|
0.41 |
0.58 |
0.37 |
0.72 |
0.70 |
0.77 |
0.60 |
0.56 |
0.31 |
0.39 |
0.31 |
0.46 |
|
|
Egypt |
0.62 |
0.63 |
0.31 |
0.70 |
0.70 |
0.78 |
0.65 |
0.44 |
0.70 |
0.38 |
0.30 |
0.62 |
|
0.44 |
0.47 |
0.35 |
0.71 |
0.67 |
0.72 |
0.54 |
0.29 |
0.30 |
0.29 |
0.24 |
0.33 |
|
|
Ethiopia |
0.52 |
0.63 |
0.42 |
0.77 |
0.61 |
0.76 |
0.67 |
0.43 |
0.68 |
0.37 |
0.29 |
0.48 |
|
0.38 |
0.14 |
0.24 |
0.70 |
0.54 |
0.69 |
0.45 |
0.21 |
0.27 |
0.18 |
0.12 |
0.20 |
|
|
Greece |
0.63 |
0.35 |
0.20 |
0.73 |
0.76 |
0.82 |
0.58 |
0.34 |
0.38 |
0.30 |
0.19 |
0.31 |
|
0.59 |
0.71 |
0.34 |
0.76 |
0.72 |
0.82 |
0.66 |
0.49 |
0.50 |
0.37 |
0.29 |
0.53 |
|
|
Ireland |
0.36 |
0.34 |
0.20 |
0.76 |
0.67 |
0.78 |
0.53 |
0.22 |
0.31 |
0.17 |
0.14 |
0.23 |
|
Japan |
0.38 |
0.64 |
0.39 |
0.59 |
0.62 |
0.65 |
0.57 |
0.36 |
0.22 |
0.32 |
0.32 |
0.42 |
|
0.58 |
0.70 |
0.24 |
0.83 |
0.75 |
0.84 |
0.74 |
0.43 |
0.67 |
0.30 |
0.21 |
0.60 |
|
|
Korea |
0.46 |
0.58 |
0.43 |
0.69 |
0.70 |
0.72 |
0.63 |
0.53 |
0.46 |
0.36 |
0.42 |
0.50 |
|
Malaysia |
0.63 |
0.77 |
0.29 |
0.81 |
0.58 |
0.76 |
0.76 |
0.52 |
0.82 |
0.39 |
0.23 |
0.72 |
|
Mexico |
0.52 |
0.51 |
0.23 |
0.80 |
0.71 |
0.78 |
0.66 |
0.42 |
0.51 |
0.32 |
0.20 |
0.43 |
|
Morocco |
0.56 |
0.63 |
0.32 |
0.71 |
0.62 |
0.76 |
0.67 |
0.48 |
0.73 |
0.39 |
0.30 |
0.63 |
|
Nepal |
0.63 |
0.80 |
0.44 |
0.81 |
0.77 |
0.80 |
0.68 |
0.43 |
0.55 |
0.42 |
0.25 |
0.48 |
|
Netherlands |
0.40 |
0.34 |
0.23 |
0.73 |
0.56 |
0.77 |
0.53 |
0.19 |
0.28 |
0.21 |
0.16 |
0.21 |
|
0.50 |
0.53 |
0.22 |
0.76 |
0.78 |
0.72 |
0.58 |
0.37 |
0.41 |
0.30 |
0.23 |
0.36 |
|
|
Philippines |
0.51 |
0.67 |
0.39 |
0.82 |
0.65 |
0.74 |
0.72 |
0.54 |
0.68 |
0.36 |
0.27 |
0.58 |
|
Poland |
0.41 |
0.31 |
0.22 |
0.68 |
0.68 |
0.71 |
0.57 |
0.21 |
0.41 |
0.23 |
0.16 |
0.37 |
|
0.46 |
0.56 |
0.34 |
0.73 |
0.82 |
0.67 |
0.58 |
0.38 |
0.35 |
0.30 |
0.23 |
0.50 |
|
|
Singapore |
0.46 |
0.49 |
0.35 |
0.73 |
0.66 |
0.73 |
0.59 |
0.37 |
0.45 |
0.30 |
0.24 |
0.46 |
|
0.54 |
0.29 |
0.27 |
0.72 |
0.74 |
0.78 |
0.52 |
0.29 |
0.22 |
0.30 |
0.23 |
0.23 |
|
|
Taiwan |
0.43 |
0.47 |
0.36 |
0.68 |
0.65 |
0.80 |
0.58 |
0.43 |
0.40 |
0.33 |
0.31 |
0.36 |
|
Tanzania |
0.72 |
0.87 |
0.36 |
0.80 |
0.67 |
0.75 |
0.71 |
0.54 |
0.69 |
0.47 |
0.28 |
0.61 |
|
Thailand |
0.53 |
0.69 |
0.31 |
0.79 |
0.72 |
0.80 |
0.68 |
0.44 |
0.57 |
0.36 |
0.25 |
0.61 |
|
0.62 |
0.46 |
0.36 |
0.73 |
0.80 |
0.81 |
0.61 |
0.28 |
0.42 |
0.34 |
0.23 |
0.42 |
|
|
Ukraine |
0.46 |
0.76 |
0.33 |
0.74 |
0.78 |
0.73 |
0.61 |
0.43 |
0.40 |
0.30 |
0.23 |
0.56 |
|
0.43 |
0.45 |
0.34 |
0.70 |
0.66 |
0.68 |
0.57 |
0.36 |
0.44 |
0.26 |
0.25 |
0.41 |
Table 16. Nation averages for twelve variables.
Factor analysis on the variables
A factor analysis was carried out in order to search for a structure in the relationships between these variables. Mixed factor analysis was used in order to allow both quantitative variables and a qualitative variable (‘nation’) to be included.29 Missing values were imputed.30 The two strongest factors account for 9.5% and 6.5% respectively of the total variance. The contributions of the twelve variables to these two factors are shown in figure 31. Figure 32 shows how the nations are distributed along the dimensions of these two factors.
This analysis was repeated using multiple factor analysis. This is a two-step procedure which carries out first a principal component analysis on each group of items that make up the twelve variables in table 12, and then a factor analysis of the dimensions that result from the principal component analyses.31 The results of the latter analysis were almost identical to figures 31 and 32 and are therefore not shown here.
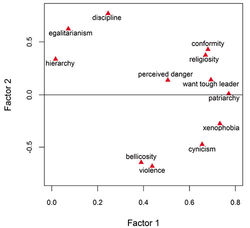
Figure 31. Mixed factor analysis. The figure shows the distribution of the variables along the two strongest factors. By Agner Fog, 2017.
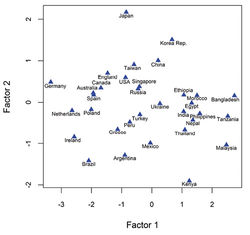
Figure 32. Mixed factor analysis. The figure shows the distribution of nations along the two factors. By Agner Fog, 2017.
Most of the variables have a significant loading on factor 1, as predicted. We can regard factor 1 as reflecting the basic aspects of regality, with a central focus on perceived danger and the desire for a tough leader.
Factor 2 is more difficult to interpret. It is dominated by discipline at the positive end and violence at the negative end, both of which are indicators of regality as evidenced by their positive loading on factor 1. The two factors are almost orthogonal, and it appears that factor 2 distinguishes between different variants of regal cultures. The interpretation of this factor is further discussed below.
Discipline is unrelated to perceived danger, according to table 15, but positively correlated with the desire for a tough leader. Discipline is strongly correlated with conformity, and conformity is strongly correlated with the desire for a tough leader and moderately correlated with perceived danger.
The variable ‘hierarchy’ has only an insignificant effect in the factor analysis (Figure 31), but it has a significant correlation with perceived danger (Table 15). The weak effect of this variable is very likely due to the reference group effect discussed on page 256. The respondents are probably evaluating the degree of hierarchy in their own culture with that same culture as reference.
It is puzzling that the variable ‘egalitarianism’ is positively correlated with hierarchy, while we would expect egalitarianism and hierarchy to be each other’s opposites (see table 15). Egalitarianism is negatively correlated with bellicosity and xenophobia, as expected, but positively correlated with perceived danger, contrary to expectation. However, perceived danger is positively correlated with bellicosity and xenophobia. An explanation for this paradox can perhaps be found in the strong correlation of egalitarianism with discipline. People who score high on discipline may be more likely to express agreement than disagreement with any statement. People with such an acquiescent response style will score high on egalitarianism because this variable has no reverse scored items. An acquiescent response style may be linked to hierarchy, collectivism, and uncertainty avoidance, according to one study.32
Perhaps some people express egalitarian opinions as a reaction against a level of hierarchy that they perceive as too high. This may also contribute to the positive correlation between egalitarianism and hierarchy. It is also possible that people who agree with egalitarian values are conforming to an egalitarian ideology expressed by their political leaders. An egalitarian society requires some discipline to suppress the pursuit of egoistic goals. Note that conformity is positively correlated with egalitarianism and discipline but not correlated with hierarchy (Table 15).
The two variables that are called bellicosity and violence here do not actually make a proper distinction between internal and external conflicts, because the survey questions failed to make this distinction. Given the mainly peaceful environment, it is likely that these variables mostly express internal conflicts.
Correspondence with other theoretical constructs
It can be useful to compare the factors in figures 31 and 32 with similar measures found by other scientists. Table 17 lists the correlations of these two factors with the various cultural and psychological measures that have been listed for different countries by other authors, as discussed in chapters 3.7 and 3.8. It is clear that all these measures, under different names, have something in common. They are all correlated in the predicted direction with factor 1, and all these correlations are statistically significant, except for Lazar Stankov’s harshness versus softness variable (p = 0.053, n = 18).
|
Other studies |
Regality factors |
||
|
Author and theory |
Cultural measure |
Factor 1: Perceived danger and desire for tough leader |
Factor 2: Discipline versus violence |
|
Uz: Cultural tightnessi |
Tightness, domain specific |
0.60** |
0.06 |
|
Tightness, domain general |
0.54** |
0.33 |
|
|
Tightness, combined |
0.78*** |
0.15 |
|
|
Gelfand et al.: Tight versus loose culturesii |
Tightness |
0.60** |
0.22 |
|
Inglehart and Welzel: Human development and valuesiii |
Secular/rational versus traditional values |
-0.44* |
0.63*** |
|
Self-expression versus survival values |
-0.56*** |
-0.24 |
|
|
Welzel: Human empowermentiv |
Secular values |
-0.49** |
0.32 |
|
Emancipative values |
-0.74*** |
0.18 |
|
|
Stankov, Lee and Vijver: Personality, attitudes, values, normsv |
Conservatism versus liberalism |
0.74*** |
-0.38 |
|
Harshness versus softness |
0.46 |
0.46 |
|
|
Stankov and Lee: Social attitudesvi |
Nastiness |
0.66*** |
0.14 |
|
Religiosity |
0.79*** |
-0.46** |
|
|
Morality |
0.77*** |
-0.57*** |
|
|
United Nations |
Life expectancy |
-0.65*** |
-0.40* |
|
Human development index |
-0.76*** |
0.35* |
|
|
i Uz (2015) ii Gelfand et al. (2011) iii Inglehart and Welzel (2005), Inglehart (2007) iv Welzel (2013) v Stankov, Lee and van de Vijver (2014) vi Stankov and Lee (2015) |
|||
Table 17. Correlation of factors from the present study with various other cultural measures at the country level. Levels of significance, two-tailed: * p < 0.05, ** p < 0.01, *** p < 0.001.33
If we accept the suggestion of Irem Uz and coworkers that life expectancy is a useful measure of threat,34 then we can confirm that factors 1 and 2 are both significantly correlated with threat. The human development index (HDI) is a less accurate measure of threat and danger. While factor 1 is negatively correlated with HDI, factor 2 is positively correlated with HDI. This will be discussed later.
Discussion
The results of our analysis are useful for investigating relationships between important political and cultural phenomena, but it must be emphasized that it is not possible to infer causal relationships from correlations without time series data. The results are quite interesting despite the fact that many of the items in the Survey of World Views questionnaire are somewhat off the mark from the concepts that are relevant to regality theory. Future research will need to include questions, methods, and samples that are designed specifically to test the predictions of regality theory.
Most of the twelve variables that we defined in table 12 are significantly correlated with each other, as we can see in table 15.
The first and strongest factor in the factor analysis is centered around perceived danger and the desire for a tough leader, as shown in figure 31. This fits nicely with the central claim of regality theory that perceived danger leads to the desire for a strong leader, and that this affects many aspects of a culture. All the variables except hierarchy and egalitarianism have substantial loadings on this factor. Patriarchy has particularly strong loading because of the high internal consistency (α) of this variable. Factor 1 also has significant negative correlations with life expectancy and human development index, which can both be seen as rough measures of safety and absence of dangers.
Several scientists have tried to map cultural differences and have each developed their own methods and measures. It is interesting that all these different measures seem to be related. There must be some core phenomenon that is reflected in these different measures, and this is exactly what regality theory asserts.
The phenomenon that we call regality is expected to have a strong influence on many different aspects of culture, such as politics, religion, morals, and art, as shown in table 1 (chapter 2.6). This makes it very likely that attempts to map cultural differences will reveal some of these connections, regardless of which methods are used. Factor 1 in the factor analysis is a reasonably good indicator of the core aspects of regality, and this factor is correlated significantly with almost all the other cultural measures, as we can see in table 17. Some of these correlations are due to confounding economic factors, of course, but we can see from table 15 that significant correlations persist when economic and other country-specific effects are controlled for.
Factor 2 is dominated by discipline versus violence, as we can see in figure 31. A possible interpretation of this factor relates to the way conflicts are solved. Internal conflicts are solved by official legal or political means in countries with strong and efficient moral or legal systems. However, people tend to use violence in the absence of other means of conflict solving. Efficient ways of disciplining people are seen not only in regal societies, but also in highly developed societies regardless of regality. Countries with low loadings on factor 2 have less efficient legal or moral means for disciplining people. We saw the same phenomenon in the study of non-industrial cultures (page 246 in chapter 8.3). There is a lot of internal violence in the form of feuds and vendettas in some moderately kungic cultures without strong legal systems. Regal societies, however, were able to suppress internal violence, but engaged in a lot of external violence against other societies. We can conclude that factor 2 is related to the disciplining aspect of regality, but also to other effects that have less to do with regality.
The distribution of nations across the two factors, shown in figure 32, has notable similarities with cultural maps published by other scientists using other constructs and methods. Figure 32 is very similar to a map of the distribution of countries along two dimensions named conservatism versus liberalism and harshness versus softness, published by Stankov and coworkers,35 despite the non-significant correlation of their harshness/softness dimension with factor 2 of the present study (p = 0.056, see table 17).
The factor map of figure 32 also has striking similarities with Ronald Inglehart and Christian Welzel’s cultural map in figure 6 (chapter 3.7). It is interesting that factor 2 is strongly correlated with Inglehart and Welzel’s secular/rational values, which do not measure conflict solving but industrialization and secularization of authority. Inglehart and Welzel’s map can be seen roughly as a mirrored and somewhat rotated version of our factor map. Regal countries are found at the lower left corner of figure 6 and kungic countries at the upper right. Countries with a strong disciplining system are found at the top of figure 6 and countries with weak discipline at the bottom.
The most conflict-ridden countries were not included in the Survey of World Views study because of technical and political difficulties.36 Therefore, we cannot see the full effect of war in these statistics. Fortunately, Inglehart and Welzel’s study is more inclusive, and we can see that the most conflict-ridden countries tend towards the lower left corner of figure 6, which we have identified as the most regal.
The position of Germany at the kungic end of figure 32 and the upper right corner of figure 6 is evidence that the regality of a culture can change quite dramatically in just a few generations. In addition to the obvious explanation that Germans felt safe at the time the studies were made, we should also note that Germans are determined to distance themselves ideologically from the Nazism of their past.
Our evaluation of the present results must take into account that the survey has been made in modern cultures with student samples. Furthermore, the countries included here were dominated by relative peace and security at the time of the study. This is far from the environment under which the mechanism behind regality evolved. Nevertheless, we can see highly significant correlations between nearly all the variables we have studied. This confirms that the psychological mechanism of regality that evolved in a very different environment still operates in modern cultures today.
8.5. Evidence from existing studies
Many previous studies have found effects of collective danger that are relevant to our theory. Some of these studies are listed in table 18. All of these studies find correlates of collective danger that are in accordance with regality theory, though a few of them fail to find all the effects that we would predict.
|
Study |
Level of effect |
Type of culture |
Type of danger |
Sample |
Source of variation |
Observed effect |
Theory |
|
Russelli |
culture |
non-industrial |
war |
world cultures |
natural |
punitiveness |
psychology |
|
Sipesii |
culture |
non-industrial |
war |
world cultures |
natural |
combative sports |
cultural evolution |
|
Roes and Raymondiii |
culture |
non-industrial |
intergroup competition |
world cultures |
natural |
religion |
various |
|
Inglehart and Welzeliv |
individual and culture |
modern |
existential insecurity |
world cultures |
natural |
nationalism, politics, religion, discipline, fertility |
political psychology |
|
Canetti et al.v |
individual |
modern |
political violence |
representative |
natural |
attitude to peace, xenophobia |
political psychology |
|
Jugert and Duckitt vi |
individual |
modern |
economy, violence |
students |
imagined scenario |
prejudice |
|
|
Feldman and Stennervii |
individual |
modern |
economy, war |
representative |
correlation study |
hostility to minorities, etc. |
|
|
Wohl et al.viii |
individual |
modern |
group extinction |
self-selected |
salience manipulation |
strengthen group |
social psychology |
|
Riek, Mania, and Gaertnerix |
individual |
modern |
various |
meta-analysis |
various |
hostility to out-group |
various |
|
Laddx |
individual |
modern |
representative |
natural |
support for president |
political psychology |
|
|
Carnagey and Andersonxi |
individual |
modern |
students |
natural |
war attitudes, punitiveness |
psychology |
|
|
Huddy and Feldmanxii |
individual |
modern |
representative |
natural |
strict foreign policy |
psychology |
|
|
Bonanno and Jostxiii |
individual |
modern |
natural |
social psychology |
|||
|
Echebarria-Echabe et al.xiv |
individual |
modern |
self-selected |
natural |
social psychology |
||
|
Curşeu, Stoop, and Schalkxv |
individual |
modern |
immigration |
semi-random |
correlation study |
prejudice |
integrated threat theory |
|
i Russell (1972) ii Sipes (1975) iii Roes and Raymond (2003) iv Inglehart and Welzel (2005) v Canetti et al. (2015), Hirsch-Hoefler, Canetti, Rapaport and Hobfoll (2014) vi Jugert and Duckitt (2009) vii Feldman and Stenner (1997) |
viii Wohl, Branscombe and Reysen (2010) ix Riek, Mania and Gaertner (2006) x Ladd (2007) xi Carnagey and Anderson (2007) xii Huddy, Feldman and Weber (2007), Huddy and Feldman (2011) xiii Bonanno and Jost (2006) xiv Echebarria-Echabe and Fernández-Guede (2006) xv Curşeu, Stoop and Schalk (2007) |
||||||
Table 18. Previous studies that found correlates of collective danger.
Several of the studies listed in table 18 use non-representative samples and unrealistic manipulations of danger, and measure only short-term effects. The cited studies are based on other theories than the one discussed here, or on no theory at all. We need similar studies based on regality theory in order to make more detailed predictions that can be tested, including predictions that differ from alternative theories.
8.6. Conclusion of the statistical tests
In this chapter, we have tested the predictions of regality theory systematically in several different ways. The effects at the individual level have been tested on contemporary societies only, while the effects at the social level have been tested on both contemporary and ancient non-industrial societies, using a combination of comparative historical analysis and various statistical methods. Few social science theories have been tested as thoroughly as this. Most of the predictions of the theory were confirmed. We now have empirical support for all the links in the causal chain hypothesized by our theory:
- The geography, ecology, and available technology have a strong influence on the level of intergroup conflict in a non-modern setting.
- A high level of intergroup conflict influences the psychological disposition of the individual members of the society in the direction of a desire for a strong leader, bellicosity, xenophobia, conformity, discipline, patriarchy, and strict religiosity.
- The emergent effects of individual psychological preferences makes the political system more hierarchical, makes the justice system more strict and punitive, and shapes the culture in the direction of a strong group identity, strict sexual morals, strict treatment of children, and a preference for perfectionist and highly embellished art.
- The opposite situation, where the environment makes violent conflict difficult or unlikely, has the opposite effects, leading to peace and tolerance at both the individual and the social level.
Thus, the central claims of regality theory are strongly confirmed by the data. A few less important predictions were only weakly supported or not supported at all. The prediction that anomic suicide is more common in kungic societies than in regal societies was only weakly supported for the non-industrial cultures. It was not supported for modern cultures in a country-level statistic (not shown here). The predictions for divorce rate and marrying age were not supported.
While the regality level is strongly connected with the political complexity and population density, it cannot be reduced to these factors alone. The first factor analysis (Tables 6 and 7) and the multiple correlation analysis (Table 10) indicate that significant effects remain when population density is controlled for.
None of the tests in the present study includes a time sequence which could be used to verify the direction of causality, but several of the studies cited in table 18 demonstrate the direction of causality based on single events, such as terror attacks or laboratory experiments.
In the study of non-industrial cultures (chapter 8.3), we can infer the direction of causality from the influence of the environment. This relies on the assumption that these cultures had little influence on their own environment.
Radical changes in the environment are so rare and case-specific that it would be difficult to make a statistical time series analysis to study the influence of the environment on whole societies, but individual case studies can be quite indicative. One example is the Moriori people mentioned in chapter 3.1. These people became isolated on the Chatham Islands because the islands lacked materials for building boats. The Moriori culture changed from violent to peaceful in a few hundred years. When the population was finally attacked by invading Maoris, the Moriori were easily wiped out because they lacked an efficient culture of defense.37
The problems and weaknesses of the different statistical studies are discussed in chapter 8.1.
1 Harding and Seefeldt (2013)
2 “Standard Cross-Cultural Sample”. World Cultures, 2008, http://www.worldcultures.org/
3 Murdock and White (1969), Murdock and White (2006), http://repositories.cdlib.org/imbs/socdyn/wp/Standard_Cross-Cultural_Sample
4 Dow (2003)
5 Broude and Greene (1976)
6 Reilly (1993)
7 Russell (1972)
8 Russell (1972), Stewart (1971)
9 Ember and Ember (1994)
10 Ember and Ember (1994)
11 Roes and Raymond (2003)
12 Eckhardt (1992)
13 Norris and Inglehart (2011)
14 Carnagey and Anderson (2007)
15 Sipes (1975)
16 Rummel (1972), Sawyer and LeVine (1966)
17 Quinlan (2007)
18 “Lavaan: Latent Variable Analysis”. The Comprehensive R Archive Network. http://cran.r-project.org/web/packages/lavaan/index.html
19 Garcia and Kruger (2010)
20 Breckler (1990)
21 White (1989)
22 Ferguson (1995, p. 7), Chagnon (1979), Gat (2017, chapter 4)
23 Fog (1999)
24 Durkheim (1897)
25 Saucier et al. (2015)
26 Saucier et al. (2015)
27 Heine, Lehman, Peng and Greenholtz (2002)
28 Data sources: United Nations Development Programme (2013), New World Encyclopedia (2016), International Monetary Fund (2012)
29 Pagès (2004), Lê et al. (2008)
30 Audigier, Husson and Josse (2013)
31 Lê et al. (2008), Bécue-Bertaut and Pagès (2008)
32 Harzing (2006)
33 Data sources: Inglehart and Welzel (2005), Gelfand et al. (2011), Uz (2015), Stankov, Lee and van de Vijver (2014), Welzel (2013), United Nations Development Programme (2013), New World Encyclopedia 2016), Inglehart and Welzel (2013), Welzel (2016), United Nations Data Retrieval System (2012)
34 Uz (2015)
35 Stankov, Lee and van de Vijver (2014)
36 Saucier et al. (2015)
37 Endicott (2013)

