


17. PressEd — Where the Conference Is the Hashtag
#Advanced #Twitter #pressedconf18
© Pat Lockley and Natalie Lafferty, CC BY 4.0 https://doi.org/10.11647/OBP.0162.17
‘I’ve been to conferences that used a hashtag, but this is my first conference that is a hashtag #pressedconf18’ (Groom, 2018).
You may ask what a Twitter conference is. There have been five hashtags: #IconTC, #UPMTC, #PressTC, #PATC, and #PressEDconf18 (Lafferty, 2018) that have been billed as Twitter conferences, and of those #PATC has run multiple times. In such fledgling times it would seem dangerous to be prescriptive about what is and what is not a Twitter conference. Can we consider Twitter chats such as #LTHEchat, #digped or #ETCMOOC to be conferences? Innovations such as Virtually Connecting (2018) connected on-site conference presenters with virtual participants in small groups and blurred the distinctions between purely virtual and purely — what? What is the opposite of virtual? Physical, real, absolute? (Webopedia, 2018). We can say the same about some Twitter conferences — they don’t happen purely on Twitter. Many use email and WordPress for submission and as a central hub. Does this make it less of a Twitter conference? Could it be seen as a more structured Twitter chat?
While we can see academia and social media intertwining in such ways as the ‘#icanhazpdf’ hashtag (used to request access to academic articles which are behind paywalls), related to the ‘I can haz cheeseburger?’ meme (Wikipedia, 2018), is this an osmotic process in which one is changing the other, or a didactic co-existence/dependency? Are we seeing a ‘sea change’, or perhaps something more structural such as a ‘napster moment’ (Shirky, 2012)? There are also other Twitter events such as #10DoT developed by Helen Webster, which may well have elements that seem or act conference-like. Perhaps the openness of Twitter makes organising a conference on it a contradiction. Twitter chats often effectively invite in new participants by being open and visible. A Twitter conference with a schedule and fixed speakers is in some way, closed and perhaps ‘untwitterlike’. Terras et al.’s (2011) work on Twitter as a backchannel stresses the role Twitter plays at physical conferences, but as per Groom, how does Twitter function when it is not a backchannel but the only channel? Is there a requirement for a hashtag to act as the backchannel? #PressedConf18 had only the main hashtag (with which presenters were encouraged to tag all their tweets). Only once the hashtag became akin to a backchannel was consideration given to potentially having a ‘#pressedconf18chat’ hashtag to act as a backchannel, to reduce the volume of tweets on the #PressedConf18 channel that weren’t from the presenters. ‘Backchannel’ itself though seems a pejorative term, and assumes that the conference has a nature to which a secondary form of backchannel can exist. Is a Twitter conference itself a backchannel to the notion and concept of a conference?
A key question in these opening paragraphs has been the nature, and the character of conferences. Can the role that physical conferences play, and the benefits they offer, become tangible in a Twitter form so that a Twitter conference might act as an alternative? In Vega and Cornell’s work (2007) they surveyed nearly 800 librarians and found ‘professional rejuvenation’ and ‘networking’ as the top two reasons to attend a conference. Price (1993) lists ‘Education, networking, and career path and leadership enhancement’ as the key reasons for attendance. There is obvious common ground between the two papers, and there is little reason why a Twitter conference could not perform these functions as well as a physical conference. Networking might even be easier on Twitter, and enhancing careers would be just as possible.
What of the reasons for not attending a conference? Bongkosh and Beck (2000) list perceived risk to one’s safety; inconvenience; insecurity or unfamiliarity with overseas destinations; distance; time; money and health problems. Only time, availability of the technology and perhaps government censorship (Twitter is blocked in China) could apply to a Twitter conference. Likewise, Oppermann and Chon (1997) and Sönmez, and Graefe (1998) list reasons including situational constraints of money, time, travel costs, health constraints and family obligation for not attending conferences, and again, only access to devices and time is perhaps true of Twitter conferences.
Do the hashtags of Twitter conferences look differently to the hashtags of physical conferences? Analysis was performed using a tool (Github, 2018) that downloads all of a hashtag’s tweets to a file that can be opened in Excel. No effort was taken to remove spam or tweets from hashtag ‘crossover’ where the tweet didn’t appear to be ‘from the conference’. On all the following graphs, Twitter conferences are grey, physical conferences black.
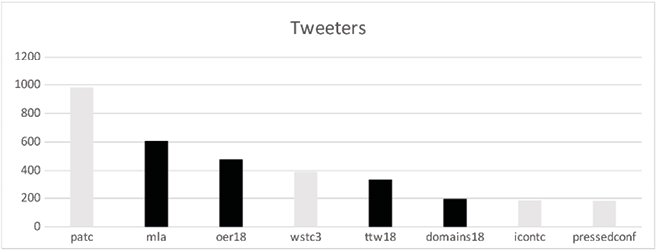
Fig. 17.1 Pat Lockley, Tweeters (2018), CC BY 4.0
Here we see Twitter conferences tend to be smaller in terms of the number of people tweeting on the hashtag.
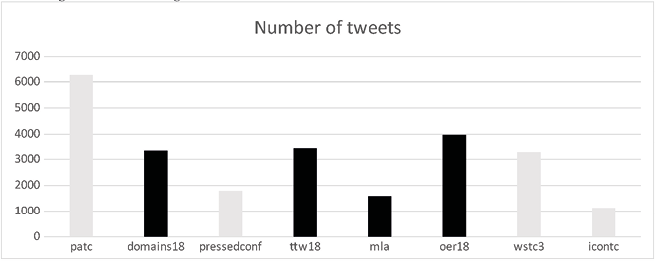
Fig. 17.2 Pat Lockley, Number of tweets (2018), CC BY 4.0
However, Twitter conferences sometimes have more tweets than physical conferences.
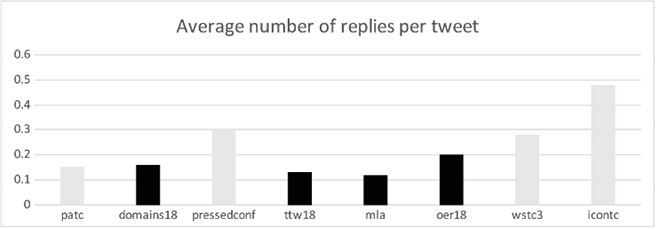
Fig. 17.3 Pat Lockley, Average number of replies per tweet (2018), CC BY 4.0
Twitter conference tweets receive more replies than physical conferences.
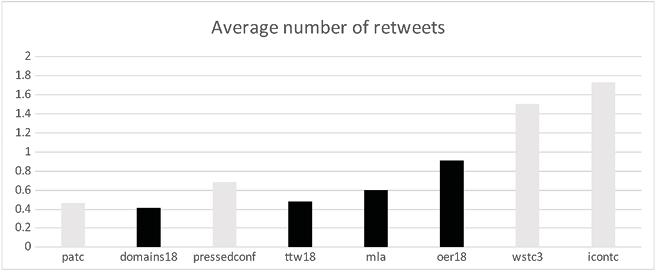
Fig. 17.4 Pat Lockley, Average number of retweets (2018), CC BY 4.0
Twitter conferences tend to attract a higher number of retweets (above) and a higher number of favourites (below).
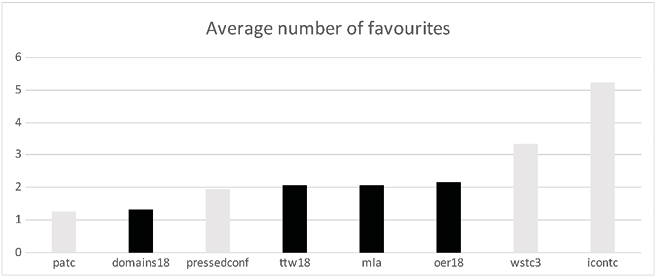
Fig. 17.5 Pat Lockley, Average number of favourites (2018), CC BY 4.0
The following table shows users on the hashtag #pressedcon18 (ordered by number of tweets) and shows a high level of engagement.
|
Status |
Sum of replies |
Sum of retweets |
Sum of favourites |
||
LornaMCampbell |
Presenter |
50 |
21 |
61 |
193 |
Todd_Conaway |
Presenter |
46 |
14 |
14 |
57 |
cogdog |
Presenter |
35 |
22 |
42 |
125 |
SFaulknerPandO |
Presenter |
34 |
16 |
14 |
111 |
twoodwar |
Presenter |
32 |
9 |
9 |
49 |
Derekrobertson |
Keynote |
32 |
4 |
9 |
23 |
WarwickLanguage |
30 |
4 |
7 |
25 |
|
drlouisegrove |
Presenter |
30 |
11 |
22 |
107 |
jimgroom |
Keynote |
29 |
11 |
32 |
183 |
greeneterry |
Presenter |
29 |
9 |
32 |
80 |
cjrw |
Presenter |
26 |
20 |
15 |
44 |
Chri5rowell |
Presenter |
26 |
8 |
32 |
51 |
HJSears |
Presenter |
25 |
12 |
17 |
45 |
edteck |
Presenter |
22 |
13 |
16 |
38 |
fearghalobrien |
Presenter |
21 |
4 |
6 |
24 |
lisajscott82 |
Presenter |
21 |
21 |
30 |
54 |
Pgogy |
Presenter |
21 |
3 |
2 |
8 |
PgrStudio |
Presenter |
20 |
5 |
28 |
112 |
TelPortsmouth |
Presenter |
20 |
0 |
21 |
52 |
jar |
Presenter |
20 |
4 |
40 |
107 |
urbaneprofessor |
Presenter |
20 |
0 |
1 |
2 |
RissaChem |
Presenter |
19 |
1 |
4 |
13 |
johnjohnston |
Presenter |
19 |
20 |
22 |
69 |
wentale |
Presenter |
19 |
6 |
1 |
13 |
clhendricksbc |
Presenter |
18 |
2 |
26 |
36 |
econproph |
18 |
2 |
2 |
17 |
|
TelLibrary |
Presenter |
17 |
1 |
16 |
47 |
ThomsonPat |
Keynote |
17 |
0 |
11 |
44 |
ryanseslow |
Presenter |
17 |
4 |
5 |
36 |
jennihayman |
Presenter |
16 |
0 |
3 |
29 |
laura_ritchie |
Presenter |
16 |
7 |
14 |
45 |
UoMTELIM |
Presenter |
15 |
7 |
20 |
86 |
outwither |
Presenter |
15 |
5 |
10 |
34 |
mattlingard |
Presenter |
14 |
6 |
21 |
48 |
GKBhambra |
Keynote |
14 |
3 |
41 |
44 |
JMUSpeColl |
Presenter |
13 |
16 |
8 |
48 |
cinigabellini |
Presenter |
13 |
5 |
8 |
12 |
SFarley_Charlie |
Presenter |
12 |
5 |
14 |
41 |
villaronrubia |
Presenter |
12 |
4 |
15 |
18 |
mkgold |
Presenter |
11 |
9 |
11 |
48 |
openetc |
Presenter |
11 |
4 |
20 |
73 |
BexFerriday |
Presenter |
11 |
5 |
21 |
24 |
ammienoot |
Presenter |
11 |
6 |
15 |
43 |
edtechfactotum |
Presenter |
11 |
5 |
30 |
65 |
lwaltzer |
Presenter |
10 |
11 |
17 |
89 |
Videlais |
Presenter |
10 |
13 |
3 |
32 |
esembrat |
Presenter |
9 |
3 |
3 |
5 |
frenchdisko |
Presenter |
8 |
1 |
7 |
29 |
trixieBooth |
Presenter |
8 |
0 |
0 |
0 |
Lucwrite |
Presenter |
8 |
3 |
23 |
78 |
LaurenHeywood |
Presenter |
7 |
3 |
5 |
11 |
iab_uk |
6 |
0 |
0 |
0 |
|
debbaff |
6 |
2 |
2 |
5 |
|
georgeroberts |
6 |
4 |
0 |
4 |
|
mdvfunes |
6 |
4 |
2 |
6 |
|
sueinasp |
5 |
4 |
1 |
10 |
|
philbarker |
5 |
1 |
0 |
4 |
|
hj_dewaard |
5 |
3 |
0 |
10 |
Fig. 17.6 Pat Lockley, #pressedcon18 user data (2018), CC BY 4.0
We can also consider tweet impressions (Twitter calls the presence of a tweet on a user’s timeline an ‘impression’). The graph below shows on how many timelines #PressedConf18 tweets were seen, on the day of the conference. Each tweet was seen on an average number of 491 timelines.
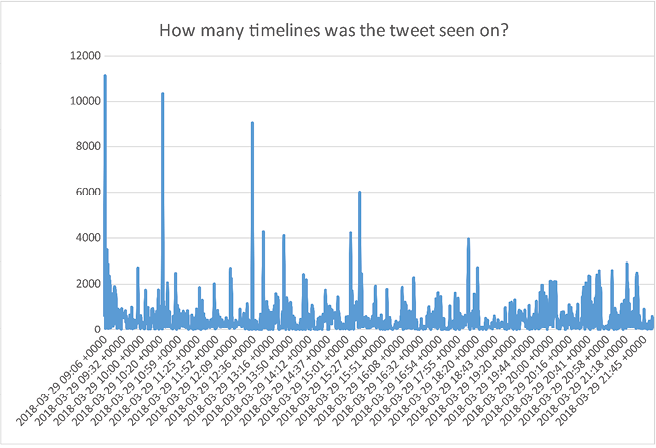
Fig. 17.7 Pat Lockley, Number of times #PressedEd18 tweets were seen (2018), CC BY 4.0
The following table show which tweets received the most impressions and therefore, which users wrote the most read tweets:
Fig. 17.8 Pat Lockley, Number of impressions (2018), CC BY 4.0
Even the lowest number (1053) is far greater than there would be attendees at most physical conferences, and at over 10000, that is significantly larger than a keynote presentation would garner. It is worth noting these are numbers drawn from data obtained in April and May. The data for these tweets will continue to increase. Each conference presentation is a Twitter moment (Twitter, 2018) and the majority of tweets are still available on Twitter.
So how did the tweets fare for retweets, replies and likes?
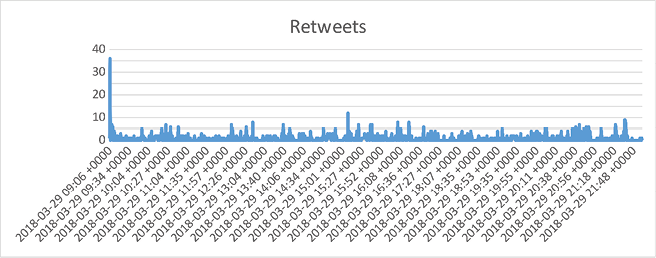
Fig. 17.9 Pat Lockley, Retweets (2018), CC BY 4.0
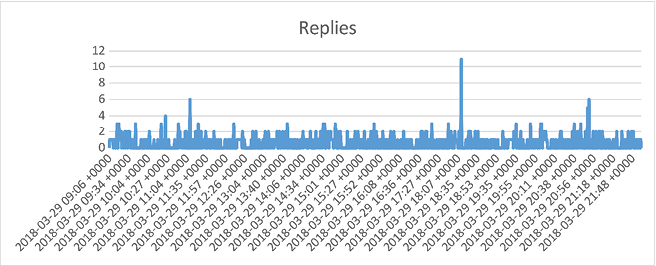
Fig. 17.10 Pat Lockley, Replies (2018), CC BY 4.0
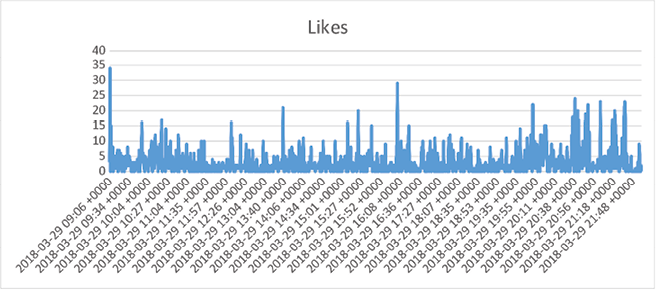
Fig. 17.11 Pat Lockley, Likes (2018), CC BY 4.0
So these varied through the day, and didn’t hugely reflect new participants across the world tuning in when it was daytime in their time zone or keynote presentation slots.
|
impressions |
retweets |
replies |
likes |
url clicks |
follows |
|
442494 |
832 |
402 |
2611 |
1171 |
7 |
Fig. 17.12 Pat Lockley, Overall #PressedConf18 impressions (2018), CC BY 4.0
Overall, the day generated a lot of impressions. One statistic of note here was that #PressedConf18 tweets didn’t generate a lot of direct ‘follows’ (when someone seeing the tweet opts to follow the tweeter). However, we should consider that any follow-up action might have happened after another tweet or not directly through this route. It would have been useful to have checked for followers before and after the conference to see if there was a distinct change as a result of networking.
So what did the conference offer in terms of promotion and networking for presenters?
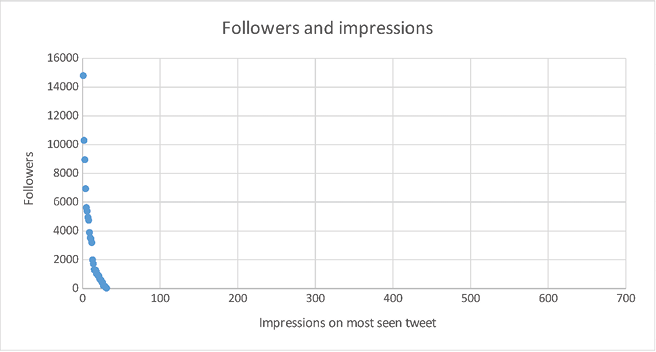
Fig. 17.13 Pat Lockley, Followers and impressions (2018), CC BY 4.0
The chart demonstrates no strong correlation between maximum tweet impression and follower number. This is a correlation coefficient of 0.226343, which shows no relationship between follower numbers and impressions of tweets, which means the conference hashtag helped to amplify the tweets of people with fewer followers to new audiences. In terms of followers to tweet impressions, the average value (for the most seen tweets) was 425%.
Twelve out of thirty-one people (for whom we have data) had more followers than they did tweet impressions — although these numbers are without a control group of how many tweets from that user are usually seen. It would seem, though, that being on the conference hashtag offers greater coverage, which can be tied to the career advancement and networking elements rated highly by attendees of physical conferences. Although this is only holds true if the people who see the tweets are as influential as the people you might interact with at a physical conference.
So we can see the impact in terms of exposure, and differences in how Twitter is used for each conference type. Conference tweeting approaches, such as live tweeting (Nason et al., 2015) when delegates tweet comments while the event is taking place, may well be different when the conference is itself live-tweeted.
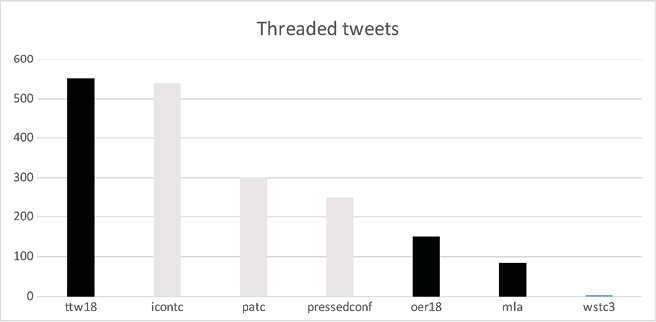
Fig. 17.14 Pat Lockley, Threaded tweets (2018), CC BY 4.0
Twitter conferences (apart from wstc3) appear to be more ‘threaded’ than physical conferences (apart from ttw18). Perhaps threaded live-tweeting is rarer?
One overlooked aspect of the nature of the conference platform is knowledge transfer. Learning technologists are well versed in how lectures are not the ideal form of teaching. Ross et al. (2011) note that a single speaker has negative repercussions in terms of interactivity and audience engagement: if a Twitter conference lacks a backchannel, consequently leading to a focus on one speaker at a time, does this replicate the problems of the lecture theatre? Or does the reply feature of Twitter mitigate a reluctance to ask questions? Can we therefore consider a Twitter conference to be more open, and to afford a greater equity of participation? Each presenter was asked to leave five minutes for presentations, but perhaps a Twitter conference needs a backchannel as well to encourage further dialogue with the topic and the speaker?
So how efficient could a Twitter conference be at knowledge transfer, even if we consider the replication of some of the negative aspects of lecture-theatre pedagogy in Twitter? We could ask how people versed in educational approaches such as networked learning and Connectivism organise their physical conferences. There is little literature available on the effectiveness of conference presentations (Illic et al., 2013), and conference posters (Davis et al., 1999) remain potentially ineffective as a form of ‘knowledge transfer’.
If the conventional conference format does not transfer knowledge effectively, and other forms of conference or event can meet those needs instead, then it seems valid to ask if Twitter conferences are a viable alternative to the physical conference in terms of meeting the needs of physical conference attendees.
References
Davis, D., O’Brien M. A. T., Freemantle, N., Wolf, F. M., Mazmanian, P., and Taylor-Vaisey, A. (1999). ‘Impact of formal continuing medical education do conferences, workshops, rounds, and other traditional continuing education activities change physician behavior or health care outcomes?’. JAMA 282:9, pp. 867–74, https://doi.org/10.1001/jama.282.9.867
Github (2018), https://github.com/pgogy/ScriptScrape-Twitter
Groom, J. (2018). [Twitter] 29 March, https://twitter.com/jimgroom/status/979464464033394688
Ilic, D., and Rowe, N. (2013). ‘What is the evidence that poster presentations are effective in promoting knowledge transfer? A state of the art review’, Health Information & Libraries Journal, 30:1, pp. 4–12, https://doi.org/doi.org/10.1111/hir.12015
Lafferty, N. (2018). [Twitter] 17 April, https://mobile.twitter.com/nlafferty/status/986279025126633475
Nason, G. J., O’Kelly, F., Bouchier-Hayes, D., Quinlan, D. M., and Manecksha, R. P. (2015). ‘Twitter expands the reach and engagement of a national scientific meeting: The Irish Society of Urology’, Irish Journal of Medical Science, 184:3, pp. 685–89.
Ngamsom, B. and Beck, J. (2000). ‘A Pilot Study of Motivations, Inhibitors, and Facilitators of Association Members in Attending International Conferences’, Journal of Convention & Exhibition Management, 2:2–3, pp. 97–111, https://doi.org/doi.org/10.1300/J143v02n02_09
Oppermann, M., and Chon, K. S. (1997). ‘Convention participation decision-making process’, Annals of Tourism Research, 24:1, pp. 178–91.
Price, C. (1993). ‘An empirical study of the value of professional association meetings from the perspective of attendees’. Unpublished doctoral dissertation. Virginia Polytechnic and State University, Blacksburg.
Ross, C., Terras, M., Warwick, C., and Welsh, A. (2011). ‘Enabled backchannel: Conference Twitter use by digital humanists’, Journal of Documentation, 67:2, 214–37.
Shirky, C. (2012). ‘Napster, Udacity and the academy’, Clay Shirky, 12 November, http://www.shirky.com/weblog/2012/11/napster-udacity-and-the-academy/
Sönmez, S. F., and Graefe, A. R. (1998). ‘Determining future travel behavior from past travel experience and perceptions of risk and safety’, Journal of Travel Research, 37:2, pp. 171–77.
Twitter (2018). PressEd Conference Moments, 6 April, https://twitter.com/pressedconf/moments
Vega, R., and Connell, R. (2007). ‘Librarians’ attitudes toward conferences: A study’, College & Research Libraries, 68:6, pp. 503–16, https://doi.org/10.5860/crl.68.6.503
Virtually Connecting (2018), http://virtuallyconnecting.org/ Webopedia (2018), https://www.webopedia.com/TERM/V/virtual.html
Wikipedia (2018). I Can Haz Cheezburger, https://en.wikipedia.org/wiki/I_Can_Has_Cheezburger%3F

