10. Alternative Ways to Finance Major Port Projects
Seaports in Indonesia
© W. W. Galih, and R. Prijadi, CC BY 4.0 https://doi.org/10.11647/OBP.0189.10
10.0 Introduction
Currently, the Government of Indonesia is engaged in a mission to develop the nation’s physical connectivity. As stated in the National Development Planning Agenda 2015–2019, the mission has general objectives such as enhancing the quality and capacity of infrastructure, increasing mobility and national and regional connectivity. The Ministry of Transportation’s decision no. 414/2014 envisions 1,240 port projects with 33 of these projects being major port developments. The strategic plan is part of President Joko Widodo’s vision of a “sea toll road”.
Based on the National Development Planning Agenda 2015–2019, sea transport infrastructure development alone would need an investment of about IDR 900 trillion. The estimated investment will be used to finance the activities to build, improve and extended the twenty-four selected seaports (five main seaports and nineteen feeder seaports, including supporting facilities). This plan would include major developments of Kalibaru (The New Priok) Port, Cilamaya Port, Makassar New Port, Port of Kuala Tanjung, and Port of Bitung (Bappenas 2014). These projects will require considerably more funds than the government can provide. The government is attempting to boost the support for their development through State Owned Enterprises (SOEs), by incentivising the private sector through Public Private Partnership (PPP) schemes, and investment in other state-of-the-art and creative financing schemes. However, the implementation of this type of private financing is not simple. The complex nature of infrastructure projects revolves around two decision-making perspectives: the perspective of the public procurer, and the perspective of the private sponsors. In essence, the public procurer has two general alternatives to finance infrastructure projects: with or without private partnerships.
The aim of this paper is to explore various alternatives of port infrastructure project financing and to explain the underlying motives to utilise those alternatives from the two different perspectives. A case study of the New Priok Container Terminal One (NPCT-1) is provided to illustrate how different scenarios of financing schemes would affect the project risks allocation, and, in the end, the project value itself. The NPCT-1 is part of the first stage of the North Kalibaru Terminal development. The project includes the construction of a 32-hectare facility space, an 850 m container quay with a pool depth of -16 m LWS and a capacity of 1.5 million TEU. The NPCT-1 project construction started in 2013 and its commercial operation commenced in August 2016. The case study identifies and assesses the existing vehicle utilised to finance the NPCT-1 project, and then compares the existing vehicle with the Public Private Partnership framework and project finance alternatives.
This paper is structured as follows. The next section (literature review) discusses the two different perspectives of the public procurer and the private sponsors in an arrangement of infrastructure provision. This is followed by a discussion of risk allocation preferences in Public Private Partnership projects. Section three presents the methodology used to gain different opinions and insights from various Indonesian seaport industry stakeholders through a survey, a focus group discussion (FGD), and several in-depth interviews. Section four explores the insights from the survey and confirms them with a case study which is cash flow simulation scenarios to illustrate how different financing scenarios would affect the seaport project value. The implications for future seaport infrastructure project financing and concluding remarks are discussed in Section five.
10.1 Literature Review
In this section, we discuss two perspectives that usually occur in infrastructure project financing structures. We consider the discussion of infrastructure financing from the perspectives of public procurers, and subsequently, the perspectives of private sponsors.
10.1.1 The Public Procurer Perspective: Public Private Partnerships vs. Traditional Procurement
While value-for-money should be the main objective of the public procurer, Burger and Hawkesworth (2011)value for money is (or at least, should be explore the non-value-for-money factors that may influence the public procurer decision to utilise traditional procurement or PPP to finance infrastructure projects. Their survey-based study revealed that in many countries, traditional procurement is set to be the default option, while PPP is only utilised when “there is someone acting as a champion for setting up the project as a PPP”. The “champion” can be interpreted at the discretion of the project’s government contracting agency (GCA). Therefore, by creating incentives to prefer traditional infrastructure procurement to PPPs the rules in place interfere with the objectives to maximise value for money. These incentives in PPPs often drive enhanced service outcomes which is beyond the scope of traditional infrastructure procurement. The use of incentives is complex and does not always lead to perfect outcomes.
A competitive benchmark study of the outcomes of Indonesian power projects by Atmo et al. (2017) provides empirical evidence that projects with PPPs had better time performance and better operational availability than projects that utilised traditional procurement methods. Nevertheless, there was no significant cost difference between the two procurement approaches. In order to resolve the problems with budgetary constraints and still maximise value for money, Atmo and Duffield (2015) propose implementation strategies based on their study of Indonesian PPP power projects post the 2008 global financial crisis. The study highlights the importance of regional export credit agencies to support Indonesian PPP power projects and the development of local manufacturing capabilities to reduce the projects’ currency exchange risk. These case studies reveal that PPP arrangements need effective strategies to ensure better project deliveries.
The effectiveness of PPP project deliveries relies on several factors. Osei-Kyei and Chan (2015) reviewed academic journals, from 1990 to 2013, on the critical success factors (CSF) for implementing PPPs to compare the findings from these studies. The five most reported CSFs over the past 23 years are: risk allocation and sharing; strong private consortium; political support; community or public support; and transparent procurement. Chan, Lam, Chan, Cheung, and Ke (2010) group critical success factors for Chinese infrastructure PPPs into five underlying factors:
- Stable macroeconomic environment
- Shared responsibility
- Transparent and efficient procurement process
- Stable political and social environment
- Judicious government control.
While the use of PPPs provides certain incentives for the public procurer, such as better project performance and risk allocation, PPP utilisation in seaport-related infrastructure in Indonesia is still limited. Most of the private financing involvement occurs under sub-concession contracts through the Indonesia seaport Corporations (IPCs), the State Owned Enterprises that are seaport operators, and creating joint-venture project companies to operate container terminals. This situation requires more study to explore alternate procurement strategies such as PPP or procurement improvement that can be implemented by the public procurer.
10.1.2 The Private Sponsor Perspective: Corporate Finance vs. Project Finance
Fundamentally, a company may choose to finance its activities through internal and external financing. There are two main external financing sources: equity and debt. Project finance is one aspect of corporate finance. To finance a project, the sponsor may choose to use corporate finance or project finance (Gatti 2008). The difference lies in whether the financing is done on the balance sheet or off the balance sheet. If a company chooses to finance its project with corporate finance, the financing is done with on-balance sheet financing, meaning that the company is liable to the creditors for the debt payments used to finance the project in the event of a failure to repay the debt credits. Companies with on-balance sheet financing must bear corporate debt and project debt with the cash flows and assets of the company itself.
Conversely, if a company chooses to finance its project with project finance, the financing is off-balance sheet financing, so the loan is a no recourse or a limited recourse. Debt payments are solely derived from the cash flows and assets of a special purpose vehicle (SPV) company established for the benefit of the project (Gatti 2008). While project finance is a common practice in PPP arrangements, there are many cases where a corporate-finance approach prevails as a suitable alternative (Yescombe 2007)private-sector financing through public-private partnerships (PPPs. In a corporate-finance structure for infrastructure financing, the project company is usually a wholly-owned subsidiary of the project sponsor or the infrastructure project is recorded as the sponsor’s asset. The latter case means that the sponsor may enter directly into a PPP scheme with the public procurer. Compared with the project finance structure, the cost of finance and ancillary cost may be lower in the case of the corporate finance structure. This lower financing and ancillary cost will result in a lower cost for the public procurer. However, a corporate finance structure is reliant on the financial capacity of the project sponsor and its balance sheet soundness.
The use of project finance supports the idea that financing decisions affect a firm’s value under certain circumstances (Esty 2003). One of the important characteristics of project finance is that there is a decision to finance assets separately, therefore allowing the project company to have highly leveraged capital structures (Esty 2004). The average project company has a debt to total capitalisation ratio of 70% (compared to 35% for public companies), concentrated equity ownership, and concentrated debt ownership (Esty 2003).
The main purpose of the project finance approach itself is the project risk allocation. Project finance is a way to distribute project risk amongst the parties involved in the arrangement to minimise the volatility of cash flows generated by the project (Gatti 2008). There are three basic strategies to mitigate the impact of project risk borne by the project company (Gatti 2008):
- Retain the risk.
- Transfer the risk by allocating it to key partners.
- Transfer the risk to risk management professionals (insurers).
The internationally accepted practice is to use Abraham’s principle of allocating risk to the party that is best able to manage the risk. In reality, the risk allocation gravitates towards those who have a higher risk tolerance. However, the allocation of risk is the subject of constant negotiation as participants often want to assume as little risk as possible. In an example of cost overrun in a turnkey contract situation between the project company and the project construction contractor, the determination of project cost by the contractor includes the normal profit, the assumed risk for project completion, the risk of cost overrun, and the risk premium caused by uncertainty during the project construction phase (Shen-fa and Xiao-ping, 2009).
Project finance allows sponsors to mitigate the risks that originate from the fact that the project company’s managers’ efforts have little impact on market outcomes. A model proposed by An and Cheung (2010) argues that “companies tend to prefer corporate financing of investment when effort has a significant impact on the magnitude and likelihood of favorable outcomes” and vice versa. When projects become very large and require a commensurate large capital budget it is less likely that companies can manage the risk and associated expenditure from normal operations. In such situations project finance or financing structures become a viable approach to manage cash flow requirements. Governments have a preference to be at arms length from such arrangements if at all possible as this creates a structured mechanism to manage their risk and to give confidence of the required budget envelope. Project creditors also benefit from project finance arrangements that provide legal protection against insider stealing and weak creditor protection laws. Subramanian and Tung (2016) explain that separate legal incorporation of the project company, combined with the fact that the project company only operates a single and discrete project, allows transparent cash flow separation.
Investors in PPPs typically require a minimum equity return (Yescombe 2007)private-sector financing through public-private partnerships (PPPs. With the debt management of the project finance approach, the higher the financial leverage for the project, the easier it is to earn a high level of return on equity (ROE). Table 10.1 illustrates a very simplified example of the benefit of leverage in two different scenarios of project’s leverage.
Table 10.1 Impact of project finance structure to the sponsor’s return (Yescombe 2007) private-sector financing through public-private partnerships (PPPs).
Low leverage | High leverage | |
Project cost | 1,000 | 1,000 |
Debt | 500 | 900 |
Equity | 500 | 100 |
Project Revenue (annually) | 75 | 75 |
Interest rate on debt (annually) | 5% | 6% |
Interest payable | 5% x 500 = 25 | 6% x 900 = 54 |
Profit | 75 - 25 = 50 | 75 - 54 = 21 |
Return on equity | 50 ÷ 500 = 10% | 21 ÷ 100 = 21% |
As illustrated in the above table, if the project is financed with 50% debt, the ROE is 10%. Alternatively, if it is financed with a high leverage of 90% debt, the ROE is 21%, despite the fact that there is an increase in the cost of debt that reflects a higher risk for lenders. This simplified example illustrates how project finance arrangements can be a vehicle for risk transfer between project equity sponsors and lenders and may increase the sponsors’ return. Risk allocation in a project finance scheme can also occur among the project sponsors. Project finance allows project sponsors to form a partnership, starting from the project bidding stage to the project commercial operation stage, with each bringing particular capabilities from their specific competencies to manage the project risks (Yescombe 2007)private-sector financing through public-private partnerships (PPPs.
Figure 10.1 summarises three different combinations of financing arrangement from the perspective of the public procurer and the private sponsor.
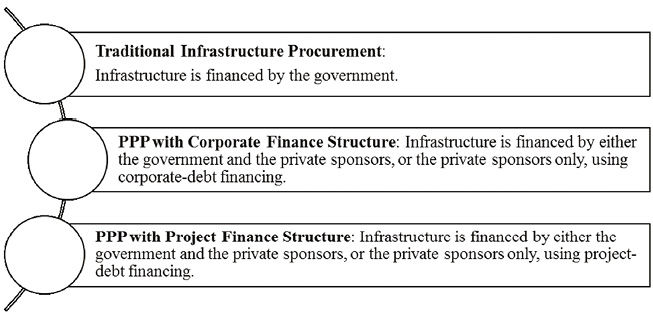
Fig. 10.1 Infrastructure financing options. (Figure by the authors from Hui, Duffield, Wilson, 2018)
While there is a relatively large literature on the effectiveness of each financing option, limited research has been conducted into the industry stakeholders’ insights and opinions on those options. This is especially important for Indonesia, as a developing country that is currently undergoing massive infrastructure development, because the Indonesian government is trying to encourage more private investors to put their money into these massive projects.
The research presented in this chapter explores insights and perspectives from various Indonesian seaport industry stakeholders related to financing of infrastructure projects via an online survey, focus group discussions and in-depth interviews conducted in Indonesia in 2017. It also uses a case study of a seaport infrastructure project financing strategy using a cash flow simulation model based on different financing scenarios to illustrate the effectiveness of the various ways to finance seaport projects. The case study is an empirical investigation conducted within a real-life context, “especially when the boundaries between phenomenon and context are not clearly evident” (Yin 2006). The case study strategy focuses on understanding the development present within single settings, combining “data collection methods such as archives, interviews, questionnaires, and observations” (Eisenhardt 1989).
10.2 Research Methodology
This paper reports on results from a study into Efficient Facilitation of Major Infrastructure Projects with a focus on Ports which utilised a combination of qualitative and quantitative research methodological approaches. The methodology associated with the Efficient Facilitation of Major Infrastructure Projects study is described in full in the Appendix. The qualitative approach included text responses from an online survey questionnaire, focus group discussions, and in-depth interviews. Quantitative data was also collected in the survey. The online survey was conducted to gain insight into the most effective financing vehicle for seaport infrastructure from the perspective of various Indonesian seaport industry stakeholders. In this questionnaire, each of the financing vehicle alternatives considered were given a Likert-scale based value, ranging from (1) “Not at all effective”, (2) “Ineffective”, (3) “Neither effective or ineffective”, (4) “Effective”, and (5) “Highly effective”, to reflect how effective a method of financing is from the perspective of the survey participants. The scale also provided a sixth response option: “Don’t know”, for respondents who were not familiar or did not have experience with the financing vehicle alternatives that were considered. The questionnaire also included open ended questions. The respondents were also asked how the decision-making process for infrastructure projects could be improved, the major barriers to gaining project approval, and about major development that their port had attempted to undertake or had achieved using international providers. The findings from the survey were confirmed with the results from the focus group discussion (FGD) that we conducted in Jakarta in September 2017. Then, several in-depth interview sessions were conducted to follow up and confirm the information collected in the survey and the FGD.
Separate to the FGD, questionnaire, and interview results, the research utilised another quantitative method with a case study of the project of the New Priok Container Terminal 1 (NPCT-1) by investigating financing of seaport infrastructure to demonstrate how financing decisions can affect project performance and, therefore, its value. The case study of NPCT-1 is used in this study due to its prototypical value as a project (Flvvberg 2004). We highlight the more general aspects of the project, so that what we conclude from the NPCT-1 case can be used as a reference point for other cases of port infrastructure development in Indonesia.
This research builds cash flow simulations under the existing scenario, project agreements and assumptions, and compares it with an alternative scenario with different project capital structures, i.e. the ratio of project long-term debt compared to total project initial investment.
The simulations are built under capital budgeting principles. The project value is derived from a net present value (NPV) analysis, where project cash flows are discounted with a risk-adjusted discount rate. This paper does not utilise an advanced approach, such as real option analysis or probability simulation, as our purpose here is only to illustrate how different financing decision — i.e. the capital structure, which is set at the project initiation — might affect the project value to the sponsors.
The research methodology can be illustrated in Figure 10.2.
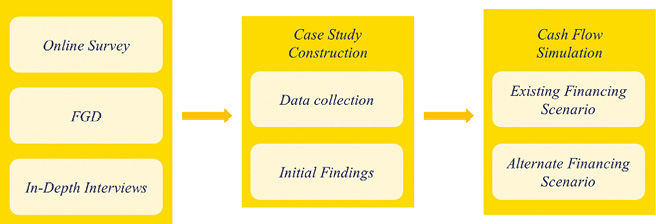
Fig. 10.2 Research flowchart (Figure by the authors from Hui, Duffield and Wilson 2018)
10.3 Results and Case Study
10.3.1 Survey Results
In total, thirty-four relevant finance-related responses were complete and included in the analysis. Half of these respondents were associated with State Owned Enterprises and 24% associated with the government at central agencies level. This is consistent with the fact that the Indonesian seaport industry is highly controlled by the government. The majority of the respondents have had experience in the Indonesian seaport industry (76%). The respondents’ area of specialisation were diverse, such as engineering, seaport management, investment, finance, and legal. Not all respondents were port operators or terminal operators; some of them were from government departments or organisations and logistic service providers. In terms of years of experience, more than half of the respondents (53%) have had more than 10 years of specialisation experience, whilst most of them (79%) have 0–10 years of experience in the port industry (Fig. 10.3). This situation may explain why some of the respondents have extensive experience in their specialisation area (such as banking, consulting, or energy), but not necessarily in the port-specific area.
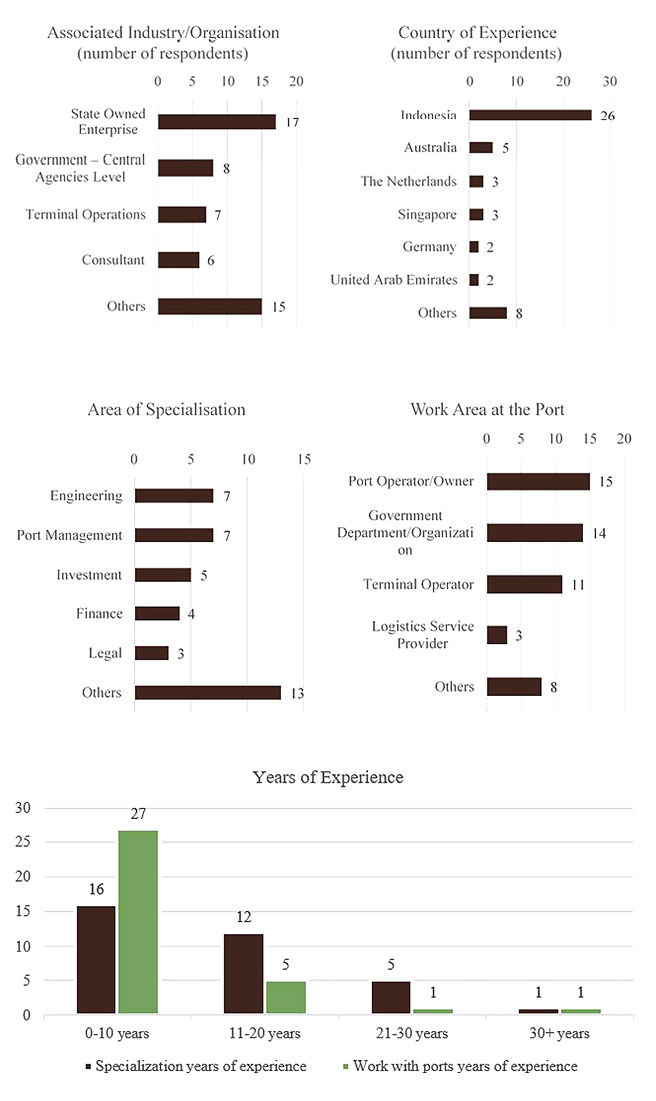
Fig. 10.3 Respondents’ characteristics (n=34) (Figure by the authors)
In the survey, respondents were asked their opinion on the most effective vehicle or method of financing seaport infrastructure development, and to indicate the relative effectiveness of the financing methods that were listed using a five-point Likert scale (1= not at all effective, 5 = highly effective), as shown in Table 10.2. The financing methods are ranked based on their mean scores. The PPP-related methods dominate the top-five financing vehicles or methods of financing. These PPP-related methods are the government-guaranteed PPP, PPPs, Availability Funding, and PPP with construction support. PPP with government guarantee has the highest mean score, whilst the Indonesian bank finance has the highest number of respondents who indicated it is either an effective or highly effective vehicle.
Table 10.2 Financing vehicle/method effectiveness (Top-10 choices).
Rank | Financing Vehicles (FV) | % Agree that FV is Either Effective or Highly Effective | Mean Score | SD of Score | Don’t Know | No Answer |
1 | PPP Government guaranteed | 65% | 4.1 | 0.8 | 3 | 4 |
2 | Indonesian bank finance | 71% | 4.0 | 0.8 | 1 | 2 |
3 | Public private partnerships | 62% | 4.0 | 0.9 | 1 | 4 |
4 | Availability funding | 65% | 3.9 | 0.9 | 1 | 2 |
5 | PPP with ‘in kind’ — construction support | 62% | 3.8 | 0.8 | 2 | 3 |
6 | Arrangement of incentives to attract investment e.g. SEZ | 62% | 3.8 | 0.7 | 3 | 4 |
7 | Direct company facilitation | 59% | 3.8 | 0.9 | 1 | 2 |
8 | World bank | 56% | 3.8 | 0.9 | 2 | 3 |
9 | Private seaport operator finance | 56% | 3.8 | 0.7 | 2 | 3 |
10 | Viability gap funding | 53% | 3.7 | 0.7 | 3 | 4 |
The arrangement of attractive incentives for investment, such as Special Economic Zones (SEZs), is indicated as either effective or highly effective by 62% of respondents (Table 10.2). Some of the Indonesian green-field port projects have included the development of an integrated SEZ or industrial zones as their hinterlands’ economic growth strategy, thereby improving both cargo traffic and inland connectivity, for example the Port of Kuala Tanjung and the Kijing Terminal. The online questionnaire also provided the respondents with an option to choose a financing combination. Thirteen respondents to this question indicated that a combination of financing vehicles is either effective or highly effective. Some of the combinations mentioned by the respondents were “a mix of domestic bank loan and international loan”, and a combination of “the government budget with the international finance organisation”. One of the respondents also explained that while PPP should be a solution to financing issues, it is yet to be effective due to current restrictions on private ownership of port projects; investors are unlikely to invest their money if they are not gaining control over the business.
The next question in the survey asked the respondents their opinion on the major barriers to gaining approval for infrastructure projects in Indonesia. We conducted content analysis by categorizing respondents’ responses into several categories. Figure 10.4 summarises the respondents’ responses.
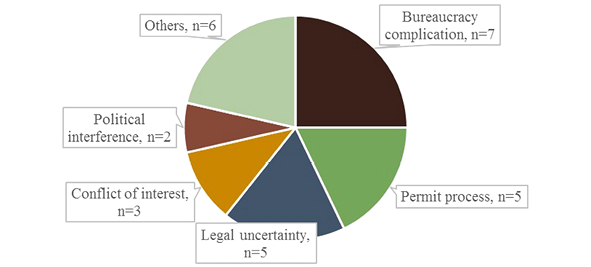
Fig. 10.4 Responses on the major barriers to gaining approval for infrastructure projects in Indonesia (Figure by the authors)
The top-five major barriers are related to the government’s institutional practices, such as bureaucracy complication, permit process, legal uncertainty, conflict of interest, and political interference. Other respondents mentioned other factors such as capital expenditure, investment-inhibiting policies, land acquisition, limited time for project preparation, project financial viability, and the dominance of the state-owned port operators.
The next question asked respondents their opinion on how the decision making process for infrastructure projects could be improved in Indonesia. We conducted a qualitative content analysis on the text responses by categorising the responses into several categories, which is summarized in Figure 10.5.
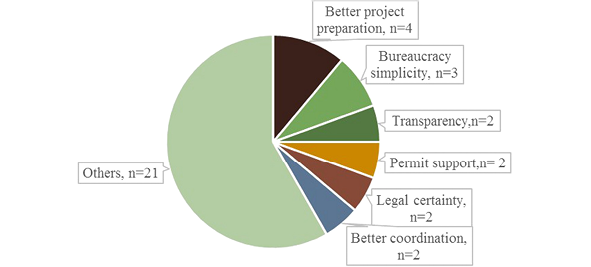
Fig. 10.5 The respondents’ suggestions on ways to improve the decision-making process for infrastructure projects in Indonesia (Figure by the authors)
The responses to this question are quite consistent with those given for the previous question. The top ways to improve the Indonesian decision-making process for infrastructure projects are all institutional: better project preparation; bureaucracy simplicity; transparency; permit support; legal certainty; and better coordination. Other responses suggest Public Private Partnership, deregulation, centralisation, better governance, land acquisition support, etc.
We asked the respondents whether their ports have attempted to undertake major development using international providers. More than half of the responses confirmed that they have made an effort to use international providers for major development of their ports, as shown in Figure 10.6.
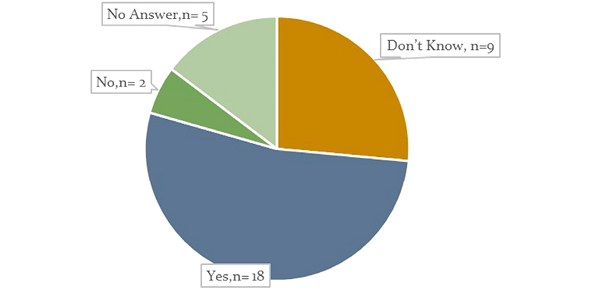
Fig. 10.6 Responses to the question “Has your port either attempted to undertake major development (or achieved major development) using international providers — including finance?” (Figure by the authors)
Following on from the previous question, respondents who answered “yes” were asked what kind of facilities were provided by the international providers. The global bond that was issued by PT Pelabuhan Indonesia II was mentioned by respondents, as was Public Private Partnerships (PPP), international direct investments and cooperation among the State Owned Enterprises (SOEs). It is becoming more common that SOEs form joint ventures, with or without support from international providers, to finance infrastructure projects, including port infrastructure. The range of responses are shown in Figure 10.7.
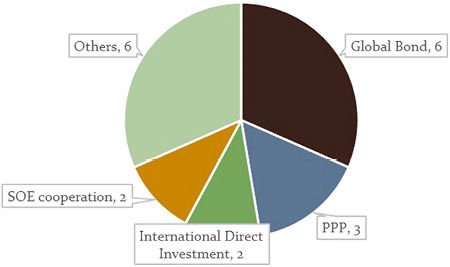
Fig. 10.7 Responses to the question on the different kinds of facilitations by international providers (Figure by the authors)
In the next section, we construct a case study on a container terminal project — the New Priok Container Terminal One (NPCT-1). This case study is conducted to illustrate how the use of project finance (instead of corporate-debt finance) and the use of PPP incentives would affect the project value, viewed from the perspective of PT Pelabuhan Indonesia II (IPC 2), the state-owned port operator acting as both the project sponsor and the government’s contracting agency.
10.3.2 Case Study of NPCT-1
A case study is constructed by having project cash flow simulations under two different scenarios. We use the New Priok Container Terminal One (NPCT-1) project in this case study. The first scenario examines the NPCT-1 project’s current financing structure — the contractual relationships between the project company, its sponsors, lenders and the government. The second scenario is built under a what-if assumption where the project is assumed to be financed under a PPP scheme with an annuity availability payments feature. The aim of this case study is to illustrate how the different financing methods might affect the project value and offer different features to the project sponsor. The analysis is viewed from the perspective of PT Pelabuhan Indonesia II (IPC 2), because IPC 2 stands in a quite unique position. On one hand, IPC 2 is a port operator company that holds ownership in several joint venture companies, including NPCT-1. On the other hand, IPC 2 is owned by the state. Therefore, it is possible to make IPC 2 the contracting agency of the NPCT-1 project, if the project is structured under a PPP-based financing method.
On April 5 2012, President SB Yudhoyono issued a presidential regulation to appoint PT Pelabuhan Indonesia II (Indonesia Port Corporation/IPC) to build, finance, and operate the NPCT-1 project (Kalibaru terminal project at the time). The presidential regulation was issued while a PPP-based tender was held to select the private sponsor for the project. The tender was immediately called off after the issuance of the presidential regulation, even though five consortiums were already selected for the qualification stage of the tender. The Ministry of Transport (MoT), as the government’s contracting agency (CA), released a statement for the tender cancellation, stating:
This (cancellation) is undertaken because the government does not have sufficient funds to build the project that worth IDR 8 trillion, including the infrastructure of bridges, dredging, and access road, which are valued at IDR 3 trillion. In addition to the absence of funds, according to Leon Muhamad, the Director General of Sea Transportation of the Ministry of Transportation, there was a quay owned by PT Pertamina on the right side of the access road to the Kalibaru project, which was not under consideration in the initial design of the container terminal. (Nugroho 2012)
This sudden change in the government’s decision (from the initial decision to finance the project under a PPP-based scheme to then cancel this decision and appoint a State Owned Enterprise instead) caused a disappointment among the five consortium bidders who had already qualified to enter the next stage of the tender. After the cancellation, the President Director of IPC, immediately took the initiative to submit a proposal for the development of Kalibaru, the IPC version (Nugroho 2012). The situation was an example of the main issues related to infrastructure project initiation in Indonesia that we highlighted earlier in the discussion of survey results: the lack of project preparation, and institutional issues.
10.3.2.1 The Existing Financing Arrangement Overview
IPC signed a memorandum of understanding (MoU) with Mitsui Co. Ltd. (Mitsui) on February 25 2014, in Tokyo. Together with NYK Line, a Japanese shipping and logistic company, and PSA International Pte. Ltd. (PSA), a Singaporean seaport operator, Mitsui formed a consortium called the Sea Terminal Management and Service Pte. Ltd. (STMS, a Singaporean-registered company). On April 19 2014, PT IPC Terminal Petikemas (IPC TPK), a subsidiary of IPC, together with STMS, signed a shareholder agreement for the NPCT-1 project company. IPC, through IPC TPK, owns 51% of the NPCT-1 project company, while STMS owns 49%. The authorised capital of NPCT-1 amounted to USD 30 million. However, even though IPC owns 51% of NPCT-1, STMS provided the whole USD 30 million capital.
The way that IPC and STMS distributed the capital is that STMS made a payment of the 51% of the capital to IPC TPK, and this payment was recorded as IPC’s liability with 0% interest (initially, the interest was at 7%, but the facility was renegotiated) (PT Pelabuhan Indonesia II (IPC) 2016). Then, IPC TPK placed the capital as an equity contribution to NPCT-1.
As stipulated in the shareholder agreement, STMS has the sole obligation and responsibility to provide funding for NPCT-1. There is one unique feature of the shareholder agreement: namely the Permitted Equity Return (PER) clause. This clause would inhibit IPC to receive any dividend payment from NPCT-1 before STMS achieves a certain rate of return from the project. In other words, STMS will receive all of the NPCT-1 dividend until the PER is achieved and IPC will receive the dividends only after the PER is achieved. The PER is calculated as an internal rate of return of the project’s cash flow to equity (IRRequity). The terminal operation agreement of NPCT-1 expires within 25 years from the date of commencement of commercial operation of the terminal. If the PER is not achieved, the agreement will be extended until the PER is achieved but with a maximum term extension of 5 years (total maximum agreement term is 30 years).
There are two sources of return from NPCT-1 for IPC that are fixed, regardless of the terminal operating outcome. The first one is the USD 100 million advanced payment NPCT-1 had to pay to IPC after the 850 m quay construction was completed. Second, NPCT-1 has to pay IPC the fixed site quarterly rent, amounting to USD 14 million, or USD 56 million per annum. The overall contractual relationship that revolves around the NPCT-1 project can be summarised in Figure 10.8 below.
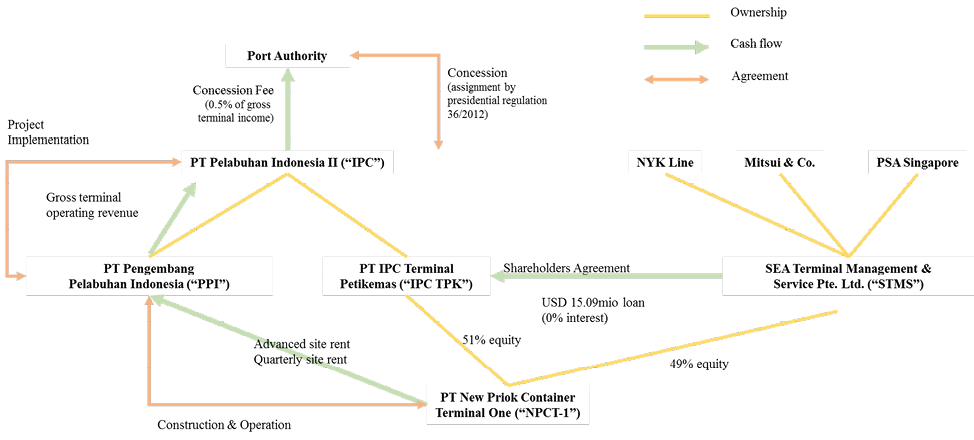
Fig. 10.8 The contractual relationship and project cash flows around the NPCT-1 project (Figure by authors based on data from IPC)
10.3.2.2 Existing Scenario Simulation Under Different PER Rates and Capital Structures
In this section, we construct the cash flow simulation model under the existing financing structure of NPCT-1. First, we create a projection of the terminal’s annual throughput. On March 2018, less than one-and-a-half years since the terminal commenced operation (August 2016), NPCT-1 had already recorded its 1 million TEU throughput (Kurniawan 2018). This is quite remarkable, as Indonesian container terminals would typically fill up half of their capacity in two years. One consideration for the projection is that the throughput cannot be as high as the full 100% terminal capacity, as such a condition would cause operational congestion inside the terminal. Then, the revenue per unit TEU is projected using the average revenue per TEU of PT Pelabuhan Tanjung Priok (PTP), a subsidiary of IPC that also operates terminals in Tanjung Priok Terminal. The average TEU per unit from the 2015 and 2016 data is USD 140 per TEU. We then simulate the project’s income statement using the information that we have discussed earlier (the ownership structure, PER, upfront payment, quarterly site rent, authorized capital, contract term, etc.), added with some assumptions.
These simplifying assumptions may not be entirely accurate. This simulation is not aimed to decide whether the project is feasible financially; rather it is to illustrate how different PER rates and capital structures might affect the project value for IPC. In order to simulate the NPCT-1 project’s net present value (NPV) to IPC, we need to discount the cash flow received from NPCT-1 with a discount rate. In this simulation, we assume that IPC financed the infrastructure investment using debt, in this case the 2015 global bond proceed, as the internal cash of IPC was not sufficient.
However, the construction started in 2013. Therefore, we simulate the cost of debt from previous debt facilities that IPC has had since 2013 (PT Pelabuhan Indonesia II (IPC) 2016). Prior to the global bond issuance, IPC had two different debt facilities. In 2013, the syndicate of Bank Mandiri and BNI gave a short-term loan facility to IPC with a floating rate at average time deposit rate +3.650% spread. The next year, this facility was refinanced using a loan facility from the syndication led by Deutsche Bank AG with a maximum facility which amounted to USD 1 billion that bears a floating interest at LIBOR +2.200%. Finally, in 2015, the loan facility was refinanced with the proceeds from the global bonds that bear 4.250% and 5.375% coupon rate for the ten-years and the thirty-years maturity bonds, respectively. The historical data of the loan facilities received by IPC has shown that domestic bank finance may not be the best option, as it might be much more costly than the other alternatives. The summary of the interest borne by the loan facilities is shown in Table 10.3 below.
Table 10.3 Loan facilities received by IPC from 2013 to 2015
Year | Loan facilities | Interest types | Interest rate (p.a.) | ||
Floating | +Spread | Total | |||
2013 | Bank Mandiri and BNI syndicate | Floating | Time deposit rate: 5.500% | 3.650% | 9.150% |
2014 | Deutsche Bank AG syndicate | Floating | LIBOR: 0.939% | 2.200% | 3.139% |
2015 | Global bond | Fixed Coupon | 4.250% (10-years maturity) and 5.375% (15-years maturity) | ||
Source: IPC annual reports 2013–2016.
As we simulate the debt proceeds and payments schedule, we can obtain a cost of debt (IRRdebt) of 5.669% per annum.
After we build the cash flow simulation under the existing structure, we then simulate the project value under different capital structures. In other words, we simulate the project value if NPCT-1 were to be financed with a project finance structure, instead of using the current structure of corporate-debt. Figure 10.9 illustrates the simulation result.
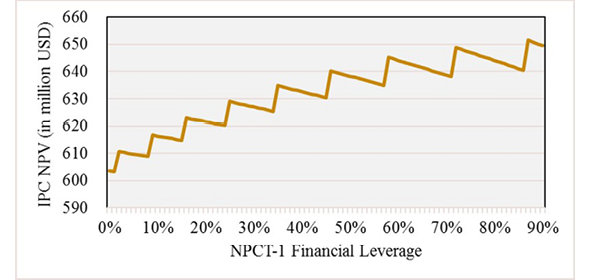
Fig. 10.9 The effect of the different NPCT-1 financial leverage levels on the project value with a certain target of IRRequity/Permitted Equity Return (PER) (Figure by authors)
The more leveraged the project company, the higher value it can offer to IPC. The rationale is that if the project company is leveraged, then STMS would need so much equity that a higher IRRequity could be achieved at an earlier point in time. The earlier the target IRRequity can be achieved, the more dividend payments are made to IPC. Furthermore, the shape of the graph in Figure 10.9 shows a staged increase. This means that the project value will decrease at certain ranges of the project company’s financial leverage levels because the project is required to pay a higher debt repayment. Then the value will increase significantly at some levels of leverage because of the extra dividend payment.
In order to better illustrate how different levels of project company leverage may affect the project value, we simulate the NPCT-1 value under different IRRequity thresholds and compare the results between the unlevered and the levered project company.
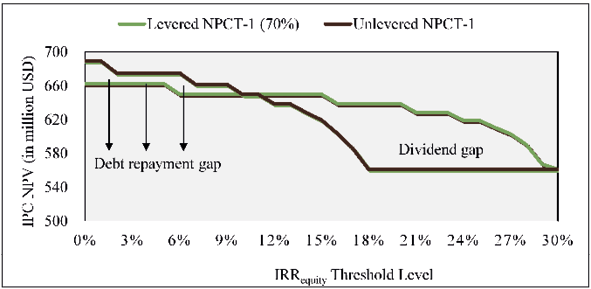
Fig. 10.10 The project value under different IRRequity thresholds (Figure by authors)
Figure 10.10 shows that at a lower IRRequity threshold, the unlevered NPCT-1 may offer a higher project value to IPC. This is because at lower IRRequity thresholds, the unlevered NPCT-1 can receive the same level of dividend payment as the levered NPCT-1, but the latter has to make the debt repayments, hence the debt repayment gap. However, at higher levels of IRRequity threshold, the dividend payments received by the unlevered project company diminishes earlier than the levered project company. The levered project company would achieve a higher IRR at earlier periods, creating a gap that we call the “dividend gap”. Furthermore, as simulated in Figure 10.10 when the IRRequity threshold level is at 10–11%, both the levered and the unlevered project company offer more or less the same level of NPV to IPC.
10.3.2.3 Alternative Scenario Overview
The second alternative scenario is provided here to confirm what the survey respondents suggested: that the PPP may be an effective financing vehicle for port infrastructure projects. In this scenario, we also use several assumptions as an addition to the information provided in the previous sections. The assumptions are as follows.
- The project tender is assumed to be won by IPC.
- However, a two-year delay is also assumed since a PPP structure may require a more complex preparation and coordination between IPC and the government and amongst the government agencies themselves.
- A less favorable operating outcome is also assumed because the equity partner(s) is/are not certain whether the partner(s) has the capabilities to operate the terminal more efficiently (such as Public Service Authority) or offer favourable throughput volumes (such as Mitsui and NYK Line), or to add any other value to the project.
- IPC bears the obligation and the responsibility to build the infrastructure, the superstructure, and to provide funding for the project company.
- The shareholder agreement does not enclose the PER or IRRequity threshold clause.
- An availability-based payment by the government is provided to supplement the user-based charges. The availability-based payment used in this scenario is ‘modified’ in the sense that it is an annuity payment that may be made by the government throughout the project’s operational term to ‘guarantee’ a certain level of the project’s IRRequity.
The contractual relationships amongst parties in alternative scenario is illustrated in Figure 10.11.
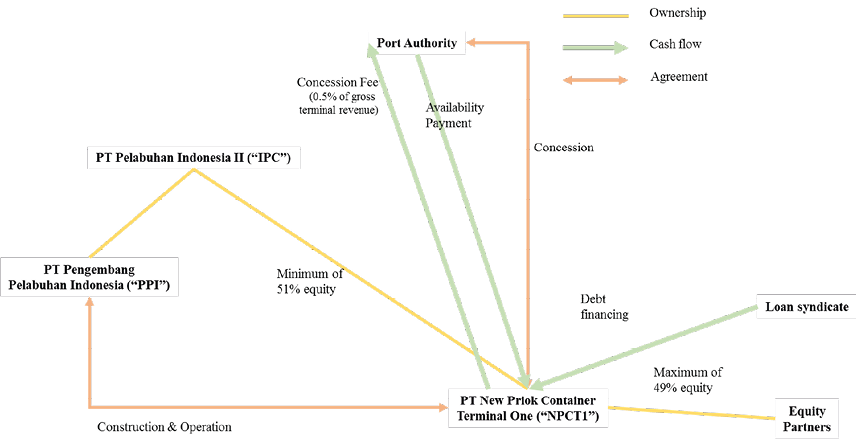
Fig. 10.11 The NPCT-1 project under a PPP-based structure with availability payment (Figure by authors)
10.3.2.4 Alternative scenario simulation under different capital structures
Without the PER clause the effect of the project company financial leverage is completely different in this scenario compared to the previous one. The higher level of the project company financial leverage would only diminish the NPV to IPC. At a lower leverage level, because of the lower IRRequity, the project value will benefit from the availability payment that would keep the IRRequity at a certain level. Figure 10.12 illustrates this simulation outcome.
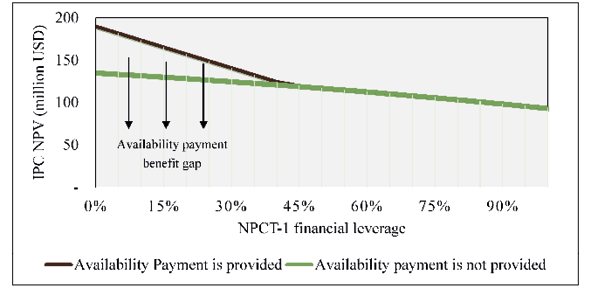
Fig. 10.12 The NPCT-1 project value to IPC under different project company financial leverage level (Figure by the authors)
We can see that in Figure 10.12 the availability payment feature offers some added value for the project only if it were funded with less than 45% financial leverage. At the 45% financial leverage level, or higher, the target IRRequity level may be achieved without the availability payment. Therefore, there is no added benefit from the availability payment. This is a pitfall of using IRRequity as a basis, or a threshold, for a dividend payment clause. IRRequity ignores the scale of the investment and the NPV. A higher IRRequity does not simply mean a higher NPV.
This reasoning is more clearly illustrated in Figure 10.13, where we simulate the project value under different IRRequity levels to be covered by the availability payment (AP) and we then compare the levered and the unlevered NPCT-1. Again, we show that the levered structure of the project company would not create additional value under this scenario. On the other hand, the levered NPCT-1 would benefit from the AP because of its lower IRRequity that would be covered by the AP, thus adding more value to the project.
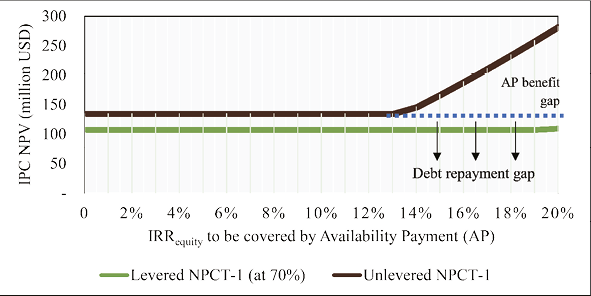
Fig. 10.13 The NPCT-1 project value to IPC under different level of IRRequity to be covered by the availability payment (Figure by the authors)
However, the benefit received by IPC out of the AP might be offset by what the government has to sacrifice. Under this scenario, the government has to make larger payments when the project IRRequity is lower. Therefore, from the public-sector perspective, it is better if the project company has a higher financial leverage level, as a higher level of leverage would increase the project’s IRRequity. At a certain level of the project company financial leverage, there would be no availability payment required, as illustrated by Figure 10.14 below.
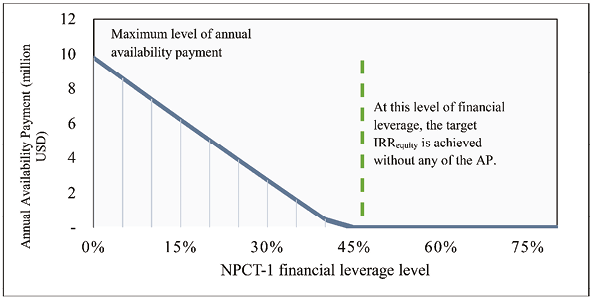
Fig. 10.14 The availability payment requirements that the government must pay at a certain level of target IRRequity under different project company capital structure (Figure by the authors)
10.4 Discussion
The top-five financing schemes that were deemed effective by the respondents to the survey as shown in Table 10.2 are now discussed more closely.
10.4.1 Indonesian Domestic Banking Finance for Port Infrastructure Projects
One of the top-picked financing schemes is unsurprisingly the financing capacity from the domestic banking sector. Based on the data from Nirwan (2017), the financing facilities from the Indonesian banking sector are growing year-on-year, and they are projected to grow more in the future, as shown in Figure 10.14.
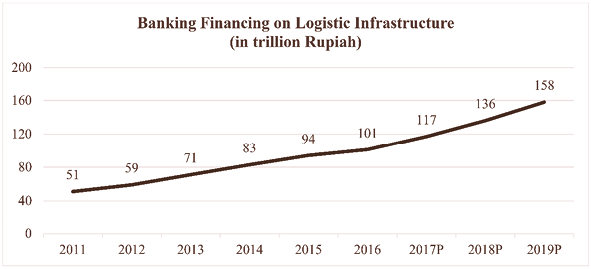
Fig. 10.15 Banking financing allocated to logistic infrastructure (road, railway, port, airport, information and communication technology, warehouse) in trillion Rupiah. Source: Nirwan (2017).
However, the domestic banking sector is faced with obstacles in allocating loans to infrastructure projects (Nirwan 2017). The main obstacle is the problematic source of funds. Generally, banks have two choices to fund their loans: either by emitting deposits, or by selling the loans to investors. In a situation where deposits are uninsured and unregulated, but with asymmetric information regarding asset quality, Greenbaum and Thakor (1987) found that banks would securitise better quality assets and finance the poorer quality assets with deposits. In the case of loan facilities that are provided to infrastructure projects, liquidity becomes an important issue. There are potential liquidity mismatch constraints with already high Loan to Deposit Ratio (LDR) of the domestic banks.
The second obstacle is the domestic bank loan pricing. For developing countries like Indonesia, political risk is a crucial determinant for loan pricing (Girardone and Snaith 2011). As a result, lenders would take into account whether the project’s geographic location is in a country with low political risk, and, if not, whether the project is guaranteed by the government. A senior finance executive stated in his presentation at the focus group discussion in Indonesia that
The lending rate of domestic banks is much higher than of external sources of funds, such as from development banks (ADB, World Bank, JBIC, and others), implying that bank financing is not firstly preferable.
However, Kleimeier and Megginson (2000) found that floating-rate project finance loans have lower credit spreads compared with non-project finance loans. It is interesting, considering the non-recourse nature of project finance loans. Nevertheless, the authors explained that a project finance structure is an effective monitoring tools because it may provide relatively transparent project cash flows that are separated from the sponsor’s cash flows. Careful contract designs in project finance structures may provide a monitoring tool which mitigates potential agency problems, reduces the credit risks and lowers the loan spread (Corielli, Gatti, and Steffanoni 2010).
The third obstacle is the macroeconomic situation of the country where projects take place. Nirwan (2017) also stated that when the government budget deficit is high, as the infrastructure spending increases, the government may decide to issue more government bonds. This is not ideal for the domestic banks, as these government bonds will reduce the banks’ funds.
Indonesian infrastructure projects — especially port projects — are still highly reliant on the support of the state-owned domestic banks, namely Bank Mandiri, Bank BNI and Bank BRI. Recently, the three banks formed a syndicate that provides the Kuala Tanjung Port project company (PT Prima Multi Terminal) an IDR 2.1 trillion loan facility from the total project investment of IDR 4 trillion (Alaydrus 2016). Even though financing support from the domestic banking sector is still very much expected, the sector is not without constraints, as discussed above. The government needs to provide further support for infrastructure projects to promote alternate financing vehicles. As shown in the survey results, the PPP-based financing methods are highly expected by our survey respondents, even though the use of PPP financing is still limited in the port sector. The next section discusses what the government has to offer in order to promote PPP financing schemes.
10.4.2 Government Fiscal Support for Public Private Partnership Projects
There are at least three main fiscal support forms for PPP projects provided by the Indonesian Government: the availability-based payments; the viability gap fund; and the government guarantee.
10.4.2.1 Availability Payment
Availability payments are payments made by the public sector to the project companies for the provision of the asset (Li 2003). According to the UK’s Treasury Task Force (TTF 2001), the main features of these payments are as follows:
- These payments should not be made until the service is available.
- There should be a single unitary charge that excludes separate independent elements relating to availability or performance.
- Payment is based on availability or performance.
- The payment mechanism should include payment reduction for insufficient performance (Li 2003).
The crucial issue of unavailability as an aspect of availability payment features is how to incentivise the project company to not merely operate so as to avoid payment deductions, but to offer improvements in service. Bonus schemes should therefore be considered when better performance is self-funding in some way (Yescombe 2007)private-sector financing through public-private partnerships (PPPs. Availability payments can be the key mechanism for market risk allocation between the project company and the public procurer when the total income generated from service provision and commercial activities is insufficient to generate an acceptable level of equity return to the project sponsors (Gatti 2008). Availability payments convert revenue risk into public procurer default risk that can be considered as either political or regulatory risk or sovereign default risk (Roumboutsos and Pantelias 2015).
In October 2015, the Indonesian Ministry of Finance issued the Ministerial Regulation on Finance Number 190 Year 2015 Regarding Availability Payment on PPP in Infrastructure Provision. This gives the legal basis for availability payment schemes in Indonesian PPPs. Several projects have been proposed for the schemes, including the Urban Railway City of Medan, North Sumatera. The availability payment model is proposed for the initial 10–15 years of operation before full reliance on the end user tariff scheme afterwards (Bappenas, 2017).
10.4.2.2 Viability Gap Fund
Another form of government fiscal support for infrastructure projects is the viability gap fund (VGF) as regulated in the Ministerial Regulation of Finance Number 23 Year 2012. The VGF is the last resort to make economically-viable PPP projects becomes financially-viable. The Indonesian VGF can give support to the construction costs of up to one half of the total construction costs. For example, The Bandar Lampung Water Supply project is projected to receive VGF from the Ministry of Finance, with the estimated project cost of USD 81.48 million (Bappenas, 2017).
10.4.2.3 Government Guarantee
On December 30 2009, the Ministry of Finance of the Republic of Indonesia (MoF) established the Indonesia Infrastructure Guarantee Fund (IIGF), as a State Owned Enterprise, to address the three issues related to the government guarantee above. The guarantee provided by the IIGF is offered to improve projects’ bankability and therefore giving assurance to the private sponsors of infrastructure projects under PPP schemes. By the end of 2016, the IIGF portfolio consisted of sixteen infrastructure projects that are dominated by toll road projects (eight projects) (IIGF 2016).
In general, although the reliance on domestic bank financing is still apparent, the constraints that limit the domestic banking sector have made the use of project finance and the PPP-based financing methods which are very much anticipated by the majority of our respondents.
10.5 Conclusion
Indonesia is one of the countries that is currently witnessing a rise in infrastructure development, especially in its transport infrastructure. The government does not have enough funds available to build all of the necessary projects. This financing gap, common to many countries, makes private funding indispensable for infrastructure projects. On the other hand, the private sponsors would expect a high return for such long-term and irreversible investments. There are alternative financing methods that have been developed to achieve more bankable infrastructure projects. The purpose of this paper has been to understand these alternatives and what they can offer to attract more investments in port infrastructure projects development.
A survey of Indonesian seaport industry stakeholders found that the respondents perceive domestic banking as one of the main financing sources of port infrastructure investments. However, the domestic banking sector is not without constraints: the need to match the banking source of fund liquidity; the loan pricing in countries with high level of political risks; and unaccommodating macroeconomic policies by the government. Taking into account these constraints, alternative ways to finance port infrastructure projects have been considered. The respondents in our survey reported that a Public Private Partnership (PPP)-based financing structure could be effective for port investments. These views might come from the incentives arising from the government fiscal supports related to PPP deals. There are at least three main fiscal support forms: the availability-based payments; the viability gap fund; and the government guarantee.
A case study of the New Priok Container Terminal One (NPCT1) was conducted with IRRequity as the basis of dividend distribution between the shareholders, PT Pelabuhan Indonesia (IPC) and its consortium partner, STMS. We simulated the project value from the perspective of IPC, as the project sponsor, under different scenario and assumptions. The first scenario is the existing financing structure of the project. The other scenario is the PPP-based scenario. In the first scenario, IPC bears the responsibility to fund the terminal’s infrastructure investment only, such as reclamation, access roads, dredging, etc. Meanwhile, in the second scenario, IPC is assumed to be responsible for providing 51% of the total project initial outlay, both the infrastructure and the superstructure investment.
Both scenarios have a “guarantee” scheme for the private sponsor, STMS. In the first scenario, the guarantee is structured as a permitted equity return (PER), while in the second scenario, an availability payment is designed to guarantee a certain level of IRRequity to the sponsors. Under the first scenario, the simulation model illustrates how a project finance structure might add value to the existing financing arrangement. A higher project leverage would lower the total equity contribution. A lower equity contribution means that a higher IRRequity can be achieved at an earlier period of time than if the project company is unlevered. An unlevered project company would add more value than a levered one, under the second scenario.
There are two main limitations of this research. The first limitation, regarding the survey analysis, is the small number of respondents. Second, the simulation model that we developed is built upon some simple assumptions. There are possible future research topics. For example, to test whether the respondents’ background (such as industry, private or public sector, education, experience) would affect their views on the various financing methods. Future research could also benefit from utilising more advanced analyses, such as real-option analysis, to illustrate how project management decisions during the project operation may provide significant benefits for the project sponsors.
References
Alaydrus, H 2016. ‘Prima Multi Terminal Terima Kredit Sindikasi Rp2,1 Triliun’, Bisnis, industri.bisnis.com/read/20160329/98/532433/prima-multi-terminal-terima-kredit-sindikasi-rp21-triliun
An, Y and Cheung, K 2010. ‘Project financing: Deal or no deal’, Review of Financial Economics, 19:2, pp. 72–77, https://doi.org/10.1016/j.rfe.2009.02.002
Atmo, G and Duffield, C 2015. ‘Attaining value from private investment in power generation projects in Indonesia: an empirical study’, Journal of Sustainable Infrastructure Development, 1:4, pp. 65–79.
Atmo, GU, Duffield, C, Zhang, L and Wilson, DI 2017. ‘Comparative performance of PPPs and traditional procurement projects in Indonesia’, International Journal of Public Sector Management, 30:2, pp. 118–36, https://doi.org/10.1108/IJPSM-02-2016-0047
Bappenas 2014. Rencana Pembangunan Jangka Menengah Nasional 2015–19, https://www.bappenas.go.id/id/data-dan-informasi-utama/dokumen-perencanaan-dan-pelaksanaan/dokumen-rencana-pembangunan-nasional/rpjp-2005-2025/rpjmn-2015-2019/
Bappenas 2017. Public Private Partnerships: Infrastructure projects plan in Indonesia.
Burger, P and Hawkesworth, I 2011. ‘How to attain value for money: Comparing PPP and traditional infrastructure public procurement’, OECD Journal on Budgeting, 2011:1, pp. 1–56, www.oecd.org/governance/budgeting/49070709.pdf
Chan, APC, Lam, PTI, Chan, DWM, Cheung, E and Ke, Y 2010. ‘Critical success factors for PPPs in infrastructure developments: Chinese perspective’, Journal of Construction Engineering and Management, 136:5, pp. 484–94, https://doi.org/10.1061/(ASCE)CO.1943-7862.0000152
Corielli, F, Gatti, S and Steffanoni, A 2010. ‘Risk shifting through nonfinancial contracts: Effects on loan spreads and capital structure of project finance deals’, Journal of Money, Credit and Banking, 42:7, pp. 1295–320, https://doi.org/10.1111/j.1538-4616.2010.00342.x
Eisenhardt, KM 1989. ‘Building theories from case study research’, The Academy of Management Review, 14:4, p. 532, https://doi.org/10.2307/258557
Esty, BC 2003. ‘The economic motivations for using project finance’, Harvard Business School, pp. 1–44, www.people.hbs.edu/besty/esty%20foreign%20banks%203-9-03.pdf
Esty, BC 2004. ‘Why study large projects? An introduction to research on project finance’, European Financial Management, 10:2, pp. 213–24, https://doi.org/10.1111/j.1354-7798.2004.00247.x
Flvvbjerg, B 2004. ‘Five misunderstandings about case-study research’, in Qualitative Research Practice, Seale, FC, Gobo, G, Gubrium, JF and Silverman, D (eds.), California, USA: SAGE Publications Ltd, pp. 420–34, https://doi.org/10.1177/1077800405284363
Gatti, S 2008. Project finance in theory and practice, Amsterdam, The Netherlands: Elsevier, https://doi.org/10.1016/B978-0-12-391946-5.00001-3
Girardone, C and Snaith, S 2011. ‘Project finance loan spreads and disaggregated political risk’, Applied Financial Economics, 21:23, pp. 1725–34, https://doi.org/10.1080/09603107.2011.577006
Greenbaum, SI and Thakor. AV, 1987. ‘Bank funding modes: Securitization versus deposits’. Journal of Banking and Finance, 11:3, pp. 379–401, https://doi.org/10.1016/0378-4266(87)90040-9
Hui, KP, Duffield, CF, and Wilson, S (eds.) 2018. Port Competitiveness and Financing Research, Workshop 4 April 2018, ISBN No 978 0 7340 5431 9
IIGF 2016. Indonesia Infrastructure Guarantee Fund (IIGF) Annual Report.
Kleimeier, S and Megginson, W L 2000. ‘Are project finance loans different from other syndicated credits?’, Journal of Applied Corporate Finance, 13:1, pp. 75–87, https://doi.org/10.1111/j.1745-6622.2000.tb00043.x
Kurniawan, D 2018. ‘NPCT1 Berhasil Bongkar Muat 1 Juta TEU’ (NPCT1 successfully unloaded 1 Million TEU), Gatra, www.gatra.com/rubrik/ekonomi/312333-NPCT1-Berhasil-Bongkar-Muat-1-Juta-TEU
Li, B 2003. Risk management of construction Public Private Partnership projects, (May), PhD thesis, Glasgow, Scotland: Glasgow Caledonian University.
Nirwan, E 2017. Financing solution for port sector, Jakarta, Indonesia: PT Bank Mandiri (Persero) Tbk.
Nugroho, R 2012. ‘Tender Kalibaru Batal, Konsorsium Kecewa’, Kompas, ekonomi.kompas.com/read/2012/01/26/1024160/tender.kalibaru.batal.konsorsium.kecewa
Osei-Kyei, R and Chan, APC 2015. ‘Review of studies on the critical success factors for public-private partnership (PPP) projects from 1990 to 2013’, International Journal of Project Management, 33:6, pp. 1335–46, https://doi.org/10.1016/j.ijproman.2015.02.008>
PT Pelabuhan Indonesia II (IPC). 2016, Annual Report IPC.
Roumboutsos, A and Pantelias. A 2015, ‘Allocating revenue risk in transport infrastructure Public Private Partnership Projects: How it matters’, Transport Reviews, vol. 35:2, pp. 183–203, https://doi.org/10.1080/01441647.2014.988306
Shen-fa, W, and Xiao-ping, W 2009. ‘The rule and method of risk allocation in project finance’, Procedia Earth and Planetary Science, 1:1, pp. 1757–63, https://doi.org/10.1016/j.proeps.2009.09.269
Subramanian, K V and Tung, F 2016. ‘Law and project finance’, Journal of Financial Intermediation, 25, pp. 154–77, https://doi.org/10.1016/j.jfi.2014.01.001
Yescombe, ER 2007. Public-Private Partnerships. Public-Private Partnerships, Amsterdam, The Netherlands: Elsevier, https://doi.org/10.1016/B978-0-7506-8054-7.X5022-9
Yin, RK,2006. Case study research — Design and methods. Clinical Research, California, USA: SAGE Publications Inc, pp. 8–13, https://doi.org/10.1016/j.jada.2010.09.005