12. Athletics
© Andrew C. Comrie, CC BY 4.0 https://doi.org/10.11647/OBP.0240.12
12.1 How big is the business of college sports?
Lucrative contracts, high visibility, and college rivalries cause much to be said about how the money works across the variety of sports and types of schools involved in intercollegiate athletics.1 The total athletics budget across all schools in our dataset2 exceeded $18B in FY2018 (Office of Postsecondary Education 2020). That’s about 4.2% of the $435B total non-hospital revenues for all of the nearly 1,200 institutions (IPEDS 2020). More interesting is that 57% of all athletics revenue is accounted for by just 124 of those institutions, the NCAA Football Bowl Subdivision (FBS) schools (see Box 12.1) with the highest-profile teams, celebrity coaches and rich sports media contracts (Office of Postsecondary Education 2020). Thus, it’s unsurprising that these prominent sports programs garner the lion’s share of headlines for game news and sports finances, especially in football and basketball. Some schools go so far as to privatize their athletics departments (Jarvis 2019), and some conferences may be looking to attract private equity investment (Bauer-Wolf 2019).
Let’s digress briefly to address a common question up front: do college sports provide an overall financial win to universities? No, they do not. With the exception of extraordinarily few schools in Division I of the NCAA that can cover virtually all their athletics costs, plus one or two rare rags-to-riches stories, university and college athletics programs are subsidized via student fees and institutional funds as part of a financially unsustainable “arms race” for greater standing (Cheslock and Knight 2015). We’ll delve into further details about athletics revenue sources, including subsidies, in Section 12.2.
Returning to the size of the athletics budget, Figure 12.1 illustrates the difference in revenues by type of institution (expenses essentially equal revenues, as they do elsewhere in the university). Apart from the obvious budget scaling by institution size, perhaps the most remarkable feature of these data is the anomaly of the R1 Private universities that, on average, spend far less on athletics ($47M) than their public counterparts ($89M). The “on average” aspect is important here, a direct consequence of the relatively few R1 Private universities participating in expensive top-tier football and basketball (see Box 12.1). If, instead of using the Carnegie classification, we stratify institutions by athletic subdivision (Figure 12.2), then the expected pattern emerges: FBS public schools have an average athletics budget of $80M while FBS private schools are at $92M. That 16% difference in public-private athletics budget in the FBS is relatively small compared to the more than 40% public-private difference in the rest of NCAA Division I and the Division II football schools. Remarkably, while the dollar amounts for public institutions are lower in NCAA Division III and still lower in the NAIA, private schools in the NAIA Division I spend three times more than their public counterparts, and twice as much in the NAIA Division II. For FBS institutions, the athletics department is roughly equivalent, budgetarily speaking, to a major academic college.
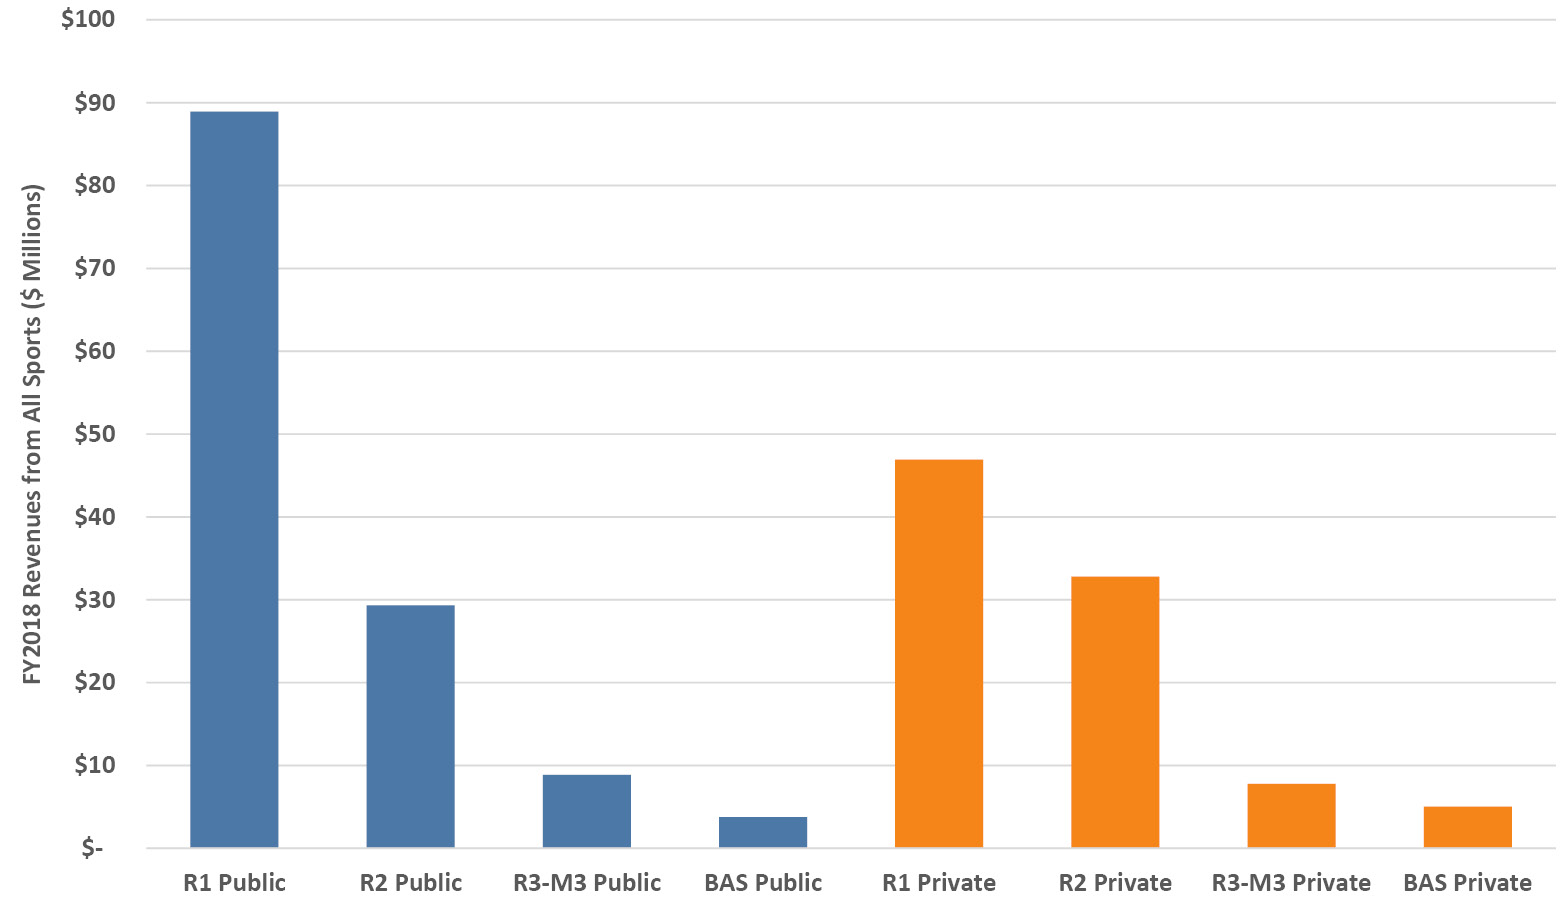
Figure 12.1. FY2018 total athletics revenues from all sports per institution, averaged by Carnegie classification and control. Source: EADA (Office of Postsecondary Education 2020).
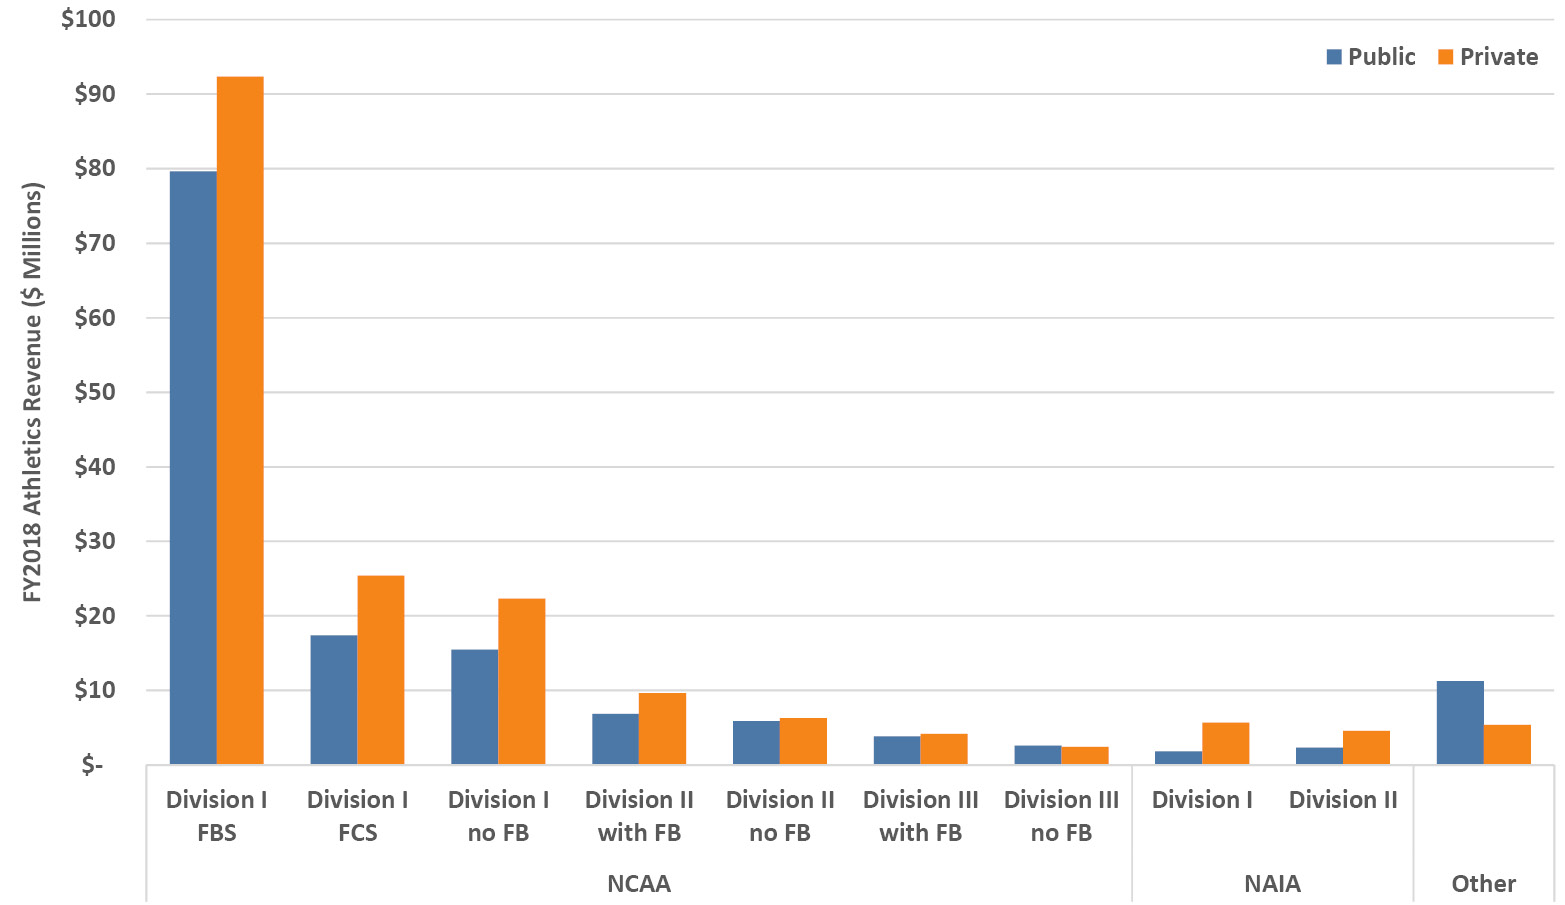
Figure 12.2. FY2018 total athletics revenues per institution averaged by athletic association, division, subdivision and control. Source: EADA (Office of Postsecondary Education 2020).
What kind of investment in athletics are all these schools making relative to their overall institutional budgets? It turns out that it’s about 5% of overall non-hospital revenue for most Carnegie classifications, with a few exceptions: a little over 7% at public baccalaureate colleges and the R3-M3 Private universities, and just 1.5% for R1 Private universities (Office of Postsecondary Education 2020) due to a combination of a low numerator (smaller average budget because of lower FBS participation, mentioned above) and a high denominator (large institutional budgets). When stratified by subdivision there are some stark differences, however, as seen in Figure 12.3. In the FBS, publics and privates aren’t too different in relative share of the institutional budget for athletics, but in the FCS the publics run athletics budgets at twice the share of the privates. That arrangement is flipped for NCAA Division I non-football schools and all schools in NCAA Division II, where the privates run athletics budgets that are two to three times the relative size of those at the publics. It’s even more the case in both divisions of the NAIA with athletics budgets at the private schools being three to five times larger in a relative sense.
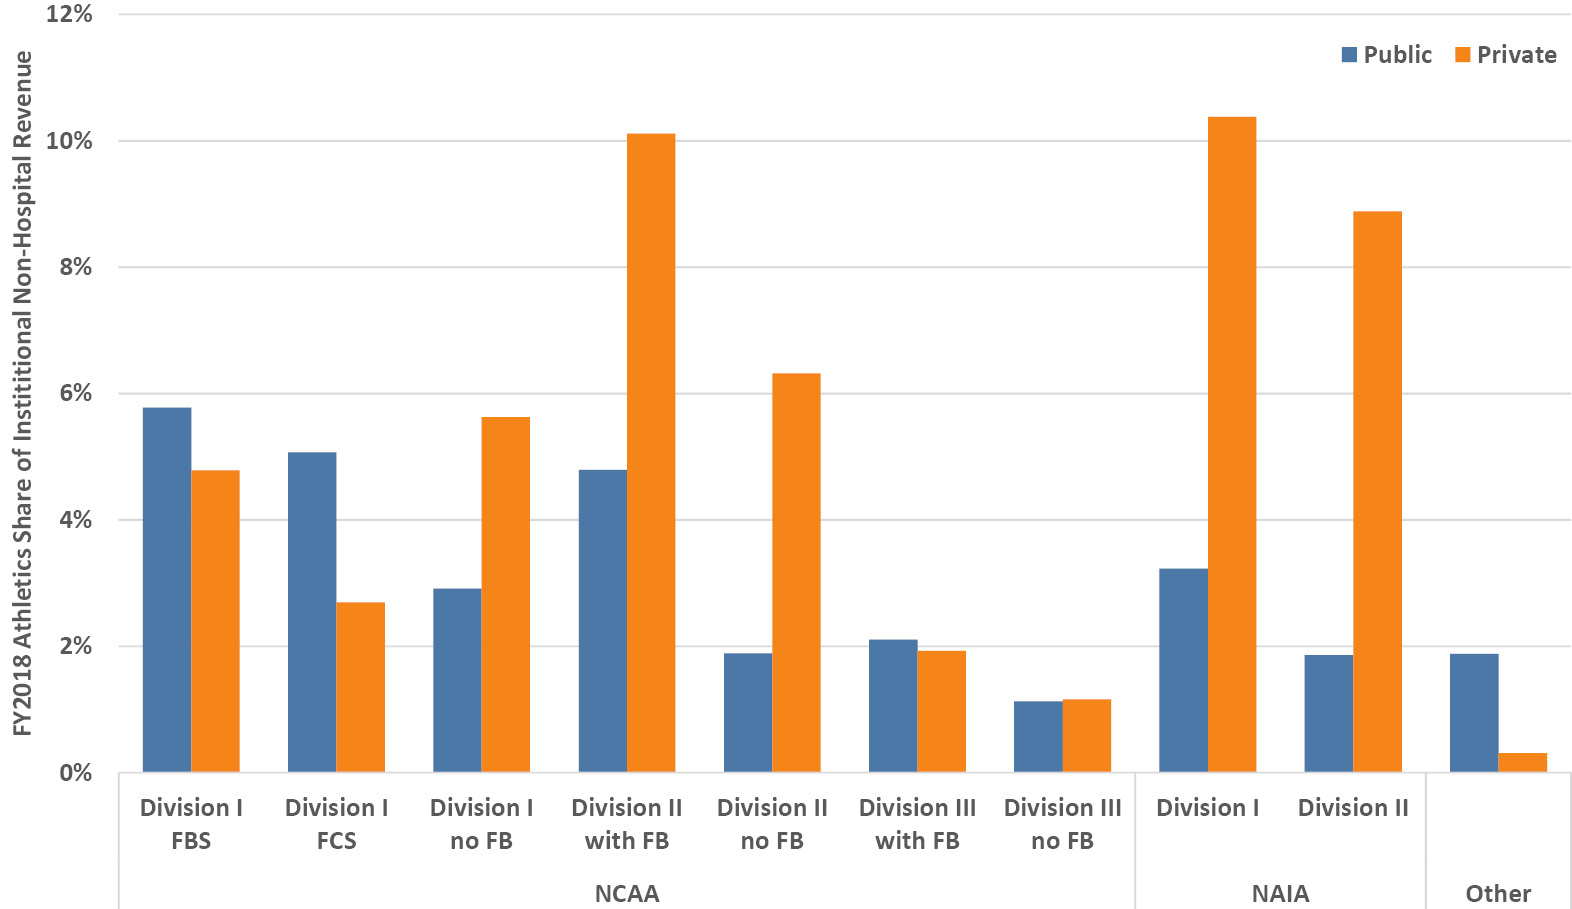
Figure 12.3. FY2018 total athletics revenue share of overall institutional non-hospital revenues by athletic association, division, subdivision and control. Source: EADA (Office of Postsecondary Education 2020).
All the above data focus on revenues flowing to the universities, but there is a bit more money to account for in the overall enterprise of college sports: the funds going to support the associations and conferences themselves. The associations and the individual conferences are separately incorporated nonprofit organizations, which also means that they each file a Form 990 summarizing their annual revenues (Schwencke et al. 2020). For FY2018, the NCAA’s budget was $1B, the budgets for the Power Five conferences ranged from $374M at the Big 12 to $759M at the Big Ten with the ACC, Pac-123 and SEC in between those, while the other conferences in Division I ranged between $28M and $78M. Not included here in the bigger college sports business are the media companies, logo wear manufacturers, etc. who pay the NCAA and its members but who also make a profit of their own.
12.2 How important are subsidies and media revenues in athletics?
With the exception of the Power Five conferences, which the NCAA calls the FBS Autonomy conferences,4 institutional funds and student fees contribute the majority of support for athletics programs in all divisions. Figure 12.4 shows that together they supply 70% of revenue even in the FCS, and about 90% in Divisions II and III. Philanthropic income is generally the other sizable source of revenue, about 5–13% in all but the Power Five. It’s worth noting that this funding mix is not unlike many academic departments. As we expect, the Power Five revenue portfolio is quite different, dominated by NCAA and conference income from media rights and bowl games, followed by gifts and endowment income as well as ticket sales. Institutional support comprises only about 5% of income for this group, about half the amount from royalties, licensing and advertising.
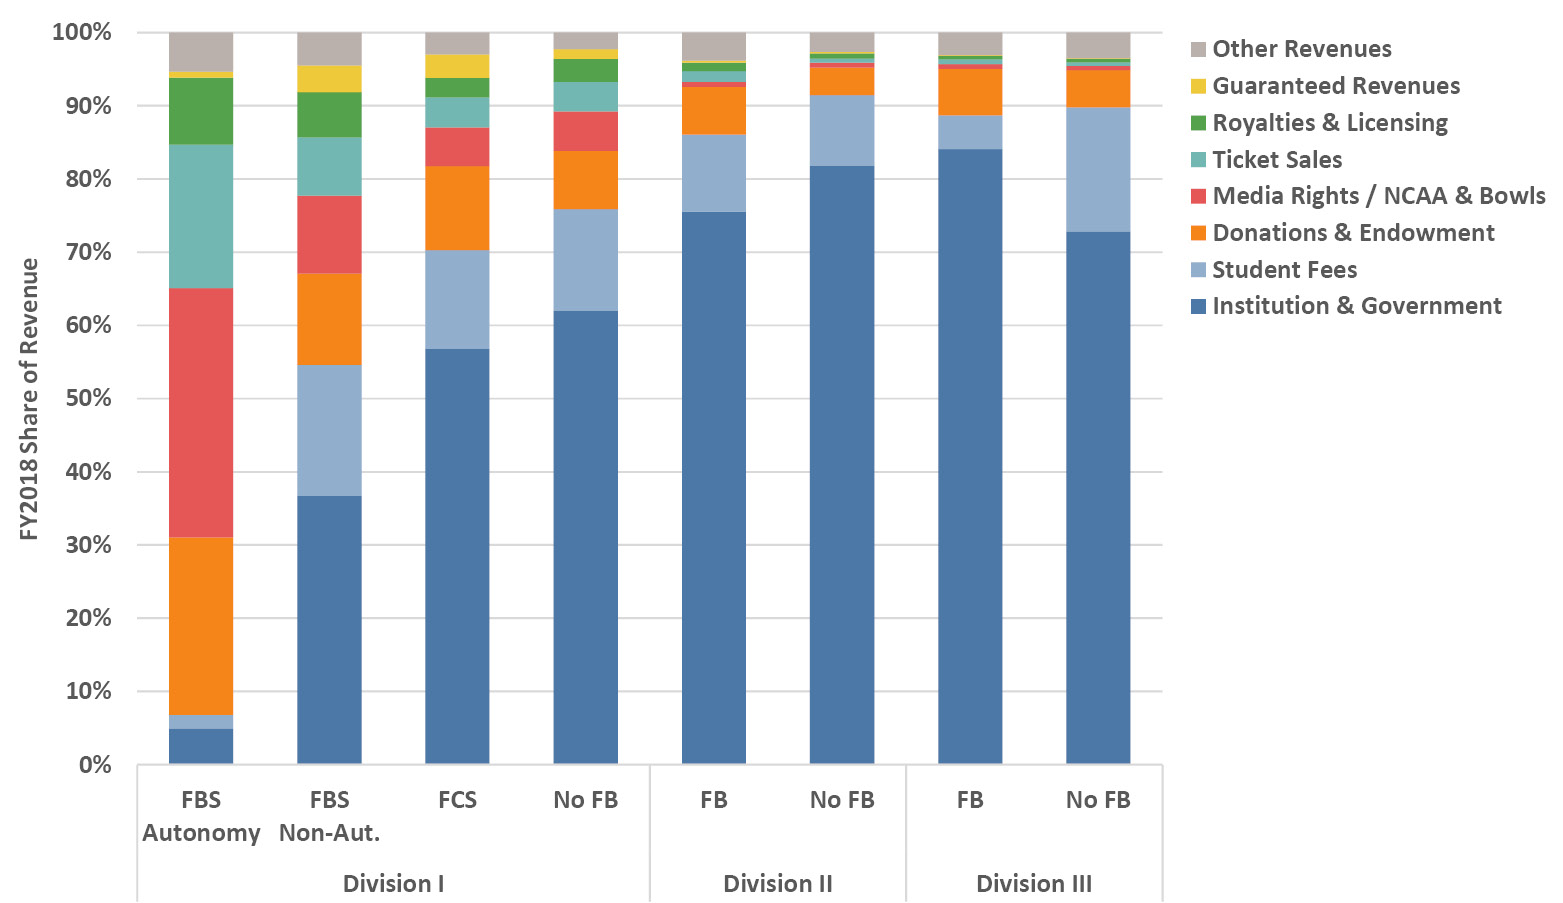
Figure 12.4. FY2018 athletics revenue sources as a share of total athletic revenues by NCAA subdivision. Source NCAA (2019a).
The divergence between the Power Five and the other subdivisions is even more striking when we consider that these percentages apply to the dollar amounts in Figure 12.2. The median FY2018 revenue at a Power Five school was $123M versus $41M at the other FBS schools, and about $22M at FCS and non-football schools across the rest of Division I (NCAA 2019a). For a sense of comparison, the median FY2018 income from media rights/NCAA alone at Power Five schools was about $42M, the same as the entire revenue of the other FBS schools and double the entire revenue of an FCS school (NCAA 2019a).
Thus, institutional subsidies are the most important source of support for athletics programs at most universities. In the FBS, especially the Power Five, the business model is entirely different and can only be sustained because of the income streams associated with the high profile of its football and basketball programs. Ironically, the institutional investments required to compete at a middling level place a higher relative financial burden on the university than they do for the richest and highest-performing FBS programs. The pressures to participate in the cycle of increasing investments to improve performance are significant, whether from athletics boosters, wealthy donors, board members, politicians, or local sports media, and they lead to widespread aspirational athletics budgeting across US higher education.
As we’ve seen, the size of the subsidy at most schools is sufficiently large that, if it was cut from athletics, it could indeed be diverted to help support academics, as has happened occasionally (Keller 2010; Sokol 2020). However, at top-tier programs, this logic applies only to the relatively small subsidy and not to the generated income. I have heard resolute colleagues on my campus (a Power Five school) suggest that the entire athletics budget be diverted to academics—that’s largely folly, of course, because most of the generated and gift revenue would evaporate without the high-profile teams.5
12.3 Is the number of student athletes increasing?
Before we move on to athletics spending, which is to say investments made ostensibly in the interests of student athletes (at least in part), it’s worth knowing how many athletes there are by type of school and any underlying trends. The average number of student athletes (who are all undergraduates by definition) at R1 and R2 institutions is about 500 to 700, and about 400 at smaller institutions (Office of Postsecondary Education 2020). From those numbers alone, we can infer that the percentage of students who are athletes is significantly higher at smaller schools. While absolute numbers of student athletes have increased steadily at all types of institution in recent decades (the numerator), overall student enrollments (the denominator) have generally increased too with the exception of baccalaureate institutions (as we saw in Section 2.2).
These and other dynamics have led to interesting patterns in student athletes as a share of all undergraduates, illustrated in Figure 12.5 and Figure 12.6. Public universities have lower percentages of student athletes than private universities, and bigger universities have lower shares of student athletes than do medium and small institutions. Thus, at R1 Public universities, student athletes average just a few percent of the student body, while at private baccalaureate colleges, nearly 30% of the student body are athletes (Figure 12.5). The trends diverge by size: larger universities (R1 and R2, public and private) have decreased their shares of student athletes on campus largely due to overall enrollments growing faster than athletics team slots. Many of these schools have fielded a large set of sports for men and women for some time, so they are closer to an upper bound. In contrast, medium to small institutions have all increased their shares of student athletes on campus (since at least the early 2000s when data began). This latter trend is especially noticeable when viewed by association and division (Figure 12.6). The NCAA Division I schools have not seen an increase in the percentage of student athletes on campus, while NCAA Divisions II and III as well as both divisions of the NAIA have seen higher percentages of student athletes. The growth is particularly pronounced in the NAIA where that share has virtually doubled in several categories. A recent study of athletics at small colleges that compete predominantly in lower division sports found that certain sports (e.g., women’s golf, women’s and men’s lacrosse) have grown rapidly, and that while women’s sports have grown faster than men’s, the number of men’s sports and participants have each increased too (Hearn et al. 2018). The authors make the case that expanding into desirable sports and growing the percentage of student athletes can expand appeal to prospective students, creating a potentially astute enrollment strategy for certain small colleges.
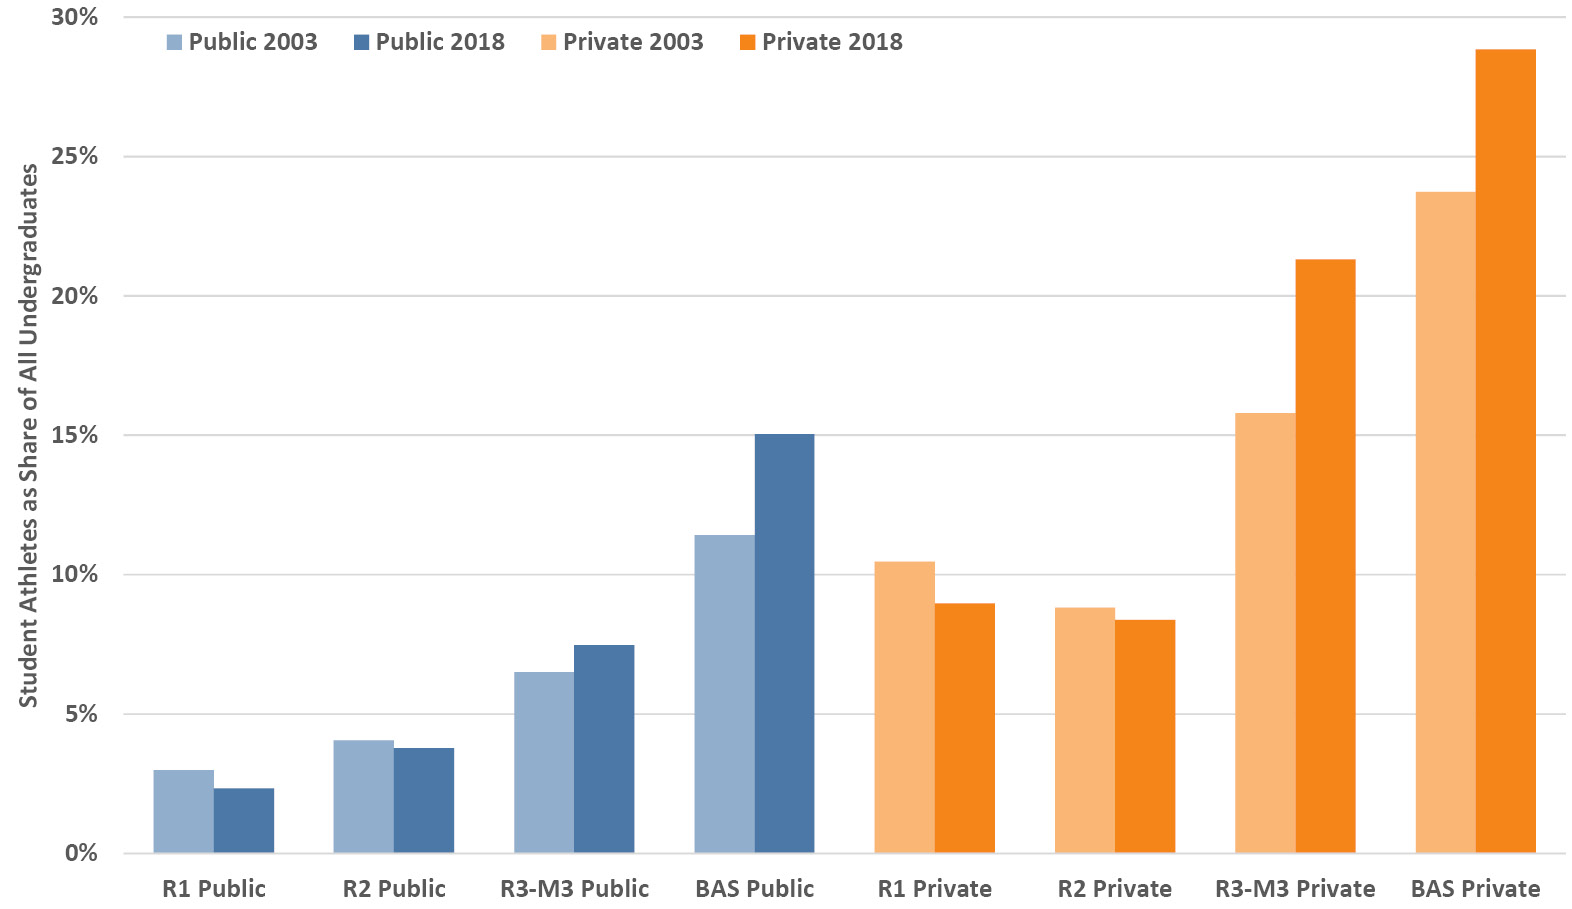
Figure 12.5. FY2003 and FY2018 student athletes as a share of all undergraduates by Carnegie classification and control. Source: EADA (Office of Postsecondary Education 2020).
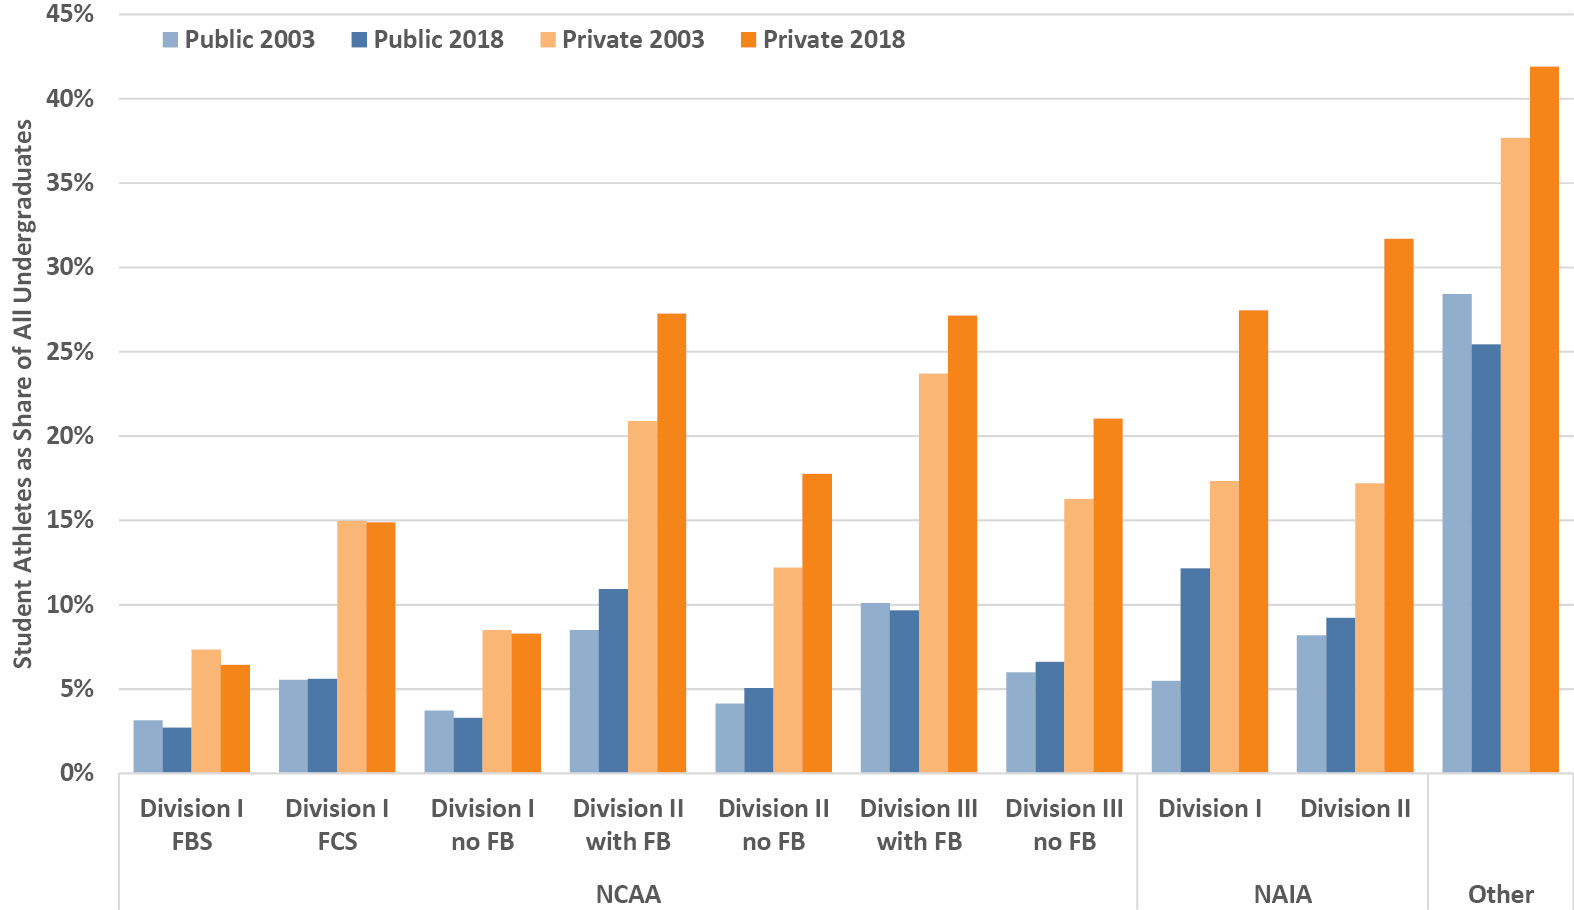
Figure 12.6. FY2003 and FY2018 student athletes as a share of all undergraduates by athletic association, division, subdivision and control. Source: EADA (Office of Postsecondary Education 2020).
12.4 What are the trends in athletics spending
and where does the money go?
Athletics expenditures at most types of schools are virtually the same as the revenues shown in Section 12.1, except that FBS schools average several million dollars (a few percent) less in annual expenditures. That margin may be used for reinvestment, carried forward to the next year, or (rarely) returned to the university. Whether it is truly a profit (in everyday terms; recall from Section 3.9 that technically it’s a margin in the nonprofit setting) depends on all costs being fully accounted—student financial aid is sometimes overlooked as a cost to the institution, as are regular facilities maintenance expenses. In general, though, total athletics expenditures look much like total revenues.
Because universities field different numbers of sports and various sized teams, athletics expenditures can be usefully scaled and compared as expenditures per athlete, much like university spending per student. Athletics expenditure levels are illustrated in Figure 12.7, including inflation-adjusted changes from FY2003 to FY2018 (the trends between those years are approximately linear in most cases). The amounts per subdivision generally scale as expected, with FY2018 expenditures per student well over six figures at FBS institutions6 and over $40,000 in the rest of NCAA Division I. Curiously, among the latter, the FCS programs spend slightly less than the non-football subdivision programs, perhaps because the large size of football squads increases the denominator relative to other sports. All lower divisions spend under $20,000 per athlete.
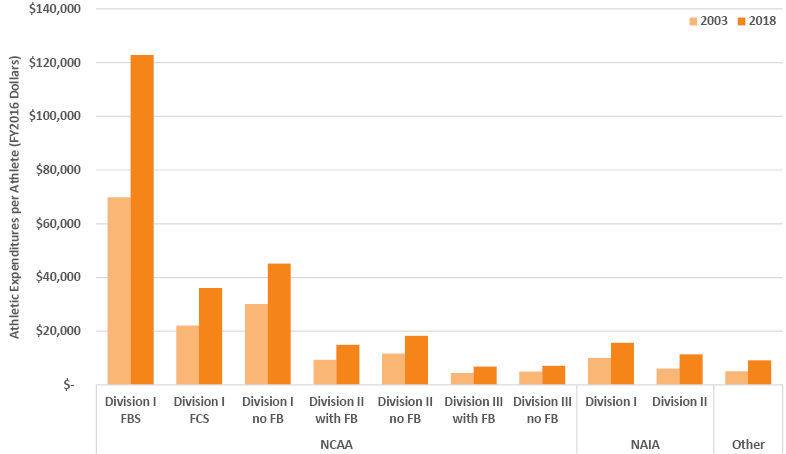
Figure 12.7. FY2003 and FY2018 total institutional athletics expenditures per student athlete averaged by athletic association, division, and subdivision. Source: EADA (Office of Postsecondary Education 2020).
The real story in Figure 12.7 is the growth. Almost all divisions have grown per-athlete expenditures by half over those sixteen years, with the FBS and NAIA Division II closer to double. In annualized growth terms, all divisions have expanded at least 2% above the rate of inflation with several above 3% and the same couple closer to 4%. These patterns highlight the expansion of athletics on a financial and a per capita basis at two to four times the analogous rate for university-wide expenditures (see Section 3.4). When FY2020 data become available, they are likely to show the dramatic effects of COVID-19 on athletics finances, nowhere more so than in the FBS: virtually no ticket revenue, canceled games and seasons, layoffs and furloughs, program cuts, and even elimination of smaller sports at some institutions (Uhler 2020).
While the size of athletics expenditures varies across subdivisions, in a relative sense the money goes to a consistent set of expenses more-or-less across the board. Figure 12.8 shows athletics expense categories as a share of total expenditures for the NCAA. Athletic scholarship aid is the only category with substantial differences across the subdivisions: in Division I it ranges from 13% of the total at FBS autonomy (Power Five) schools to a bit under 30% for the FCS and non-football subdivisions; in Division II, aid is about one third of the budget; and, in Division III there is virtually no aid by stipulation. If we omit financial aid then all NCAA subdivisions spend their funds in a remarkably similar pattern (much as we see in Division III), over one quarter on coaches (see Section 12.6 below), about 20% each on facilities costs and on administrative compensation and severance packages, about 15% on game and travel expenses, and the remainder on all other costs. Clearly, other than the student aid component, it takes much the same mix of activities and resources to run an athletics department no matter if its teams are regularly on national television or competing in the lower divisions.
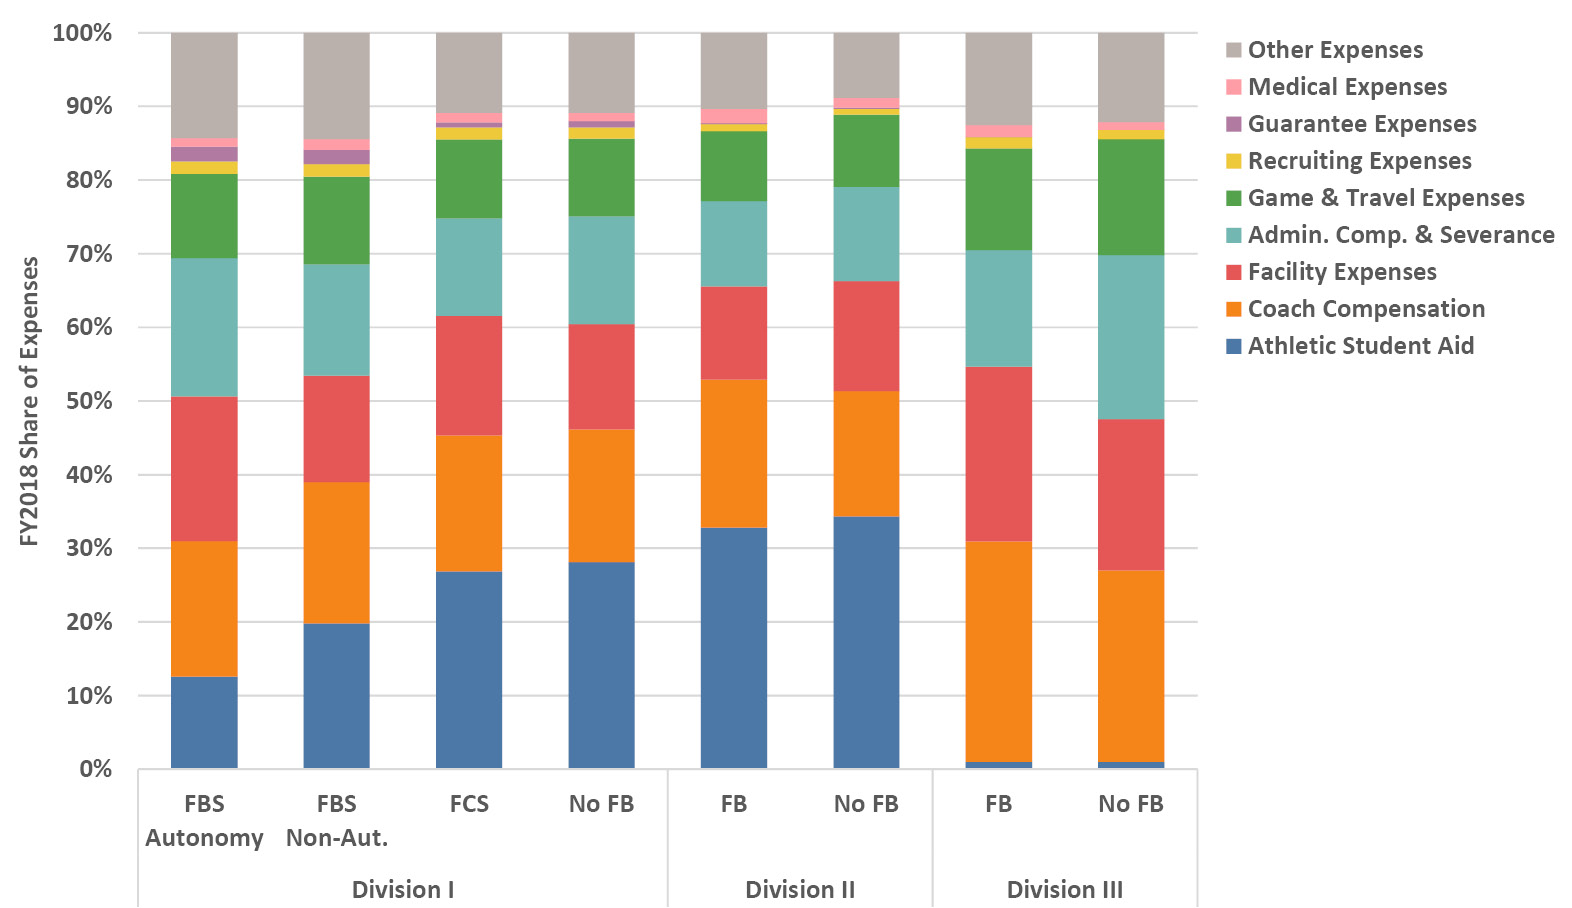
Figure 12.8. FY2018 athletics expense categories as a share of total athletic expenses by NCAA subdivision. Source NCAA (2019a).
12.5 Which sports make or lose money?
The so-called “revenue sports” are football and men’s basketball in the NCAA Division I FBS. Only these two sports in that subdivision (and largely only those in the Power Five conferences) are able to attract enough television viewers and ticket-buying fans to create clear net revenue margins when averaged across the division. And when we look closely at net revenues, as we’ll do below, we’ll see that it’s really about football—perhaps surprisingly, basketball comes in a distant second on average. Those margins cross-subsidize all the other intercollegiate sports at the institution that are typically also competing heavily in Division I. Note that these two sports are not necessarily net revenue positive at all schools in the division, and likewise some other sports that are non-revenue positive on average across the division can be revenue sports at certain schools (e.g., ice hockey).
It bears repeating that, as we saw in Section 12.2, institutional subsidies and student fees account for half to 90% of the athletics budget from the FCS on down through the lower divisions. Therefore, those athletics programs all “lose” money in an overall sense. Of course, within their own (subsidized) budgets they generally balance total revenue with expenses as any other unit would. We’ll focus on the FBS in this section because it is where the generated net revenues are.
It is instructive to see the revenue and expenditure amounts for each sport, illustrated in Figure 12.9. We see that FBS football budgets are two to three times larger than basketball budgets, and basketball budgets are about ten times the size of any other sport. The effects of media revenues and ticket sales on football and basketball finances are thus dramatic. Furthermore, football is a men’s-only sport and over 80% of FBS basketball revenues are earned by the men’s team rather than the women’s team—about two thirds of the expenses are incurred by the men’s team (Office of Postsecondary Education 2020). As much as Title IX has led to greater gender parity in college sports, popular sports culture and fan preferences lag far behind, leading to the financial dominance of these two sports within FBS athletics programs. The net revenues make this plain: about $14M from football, $1M from basketball, and net losses of $0.5M or more in each of the other sports. Football clearly supplies the lion’s share of net revenues and it is remarkable that basketball net revenues are so low, especially given the sport’s high visibility and the comparative size of basketball budgets.
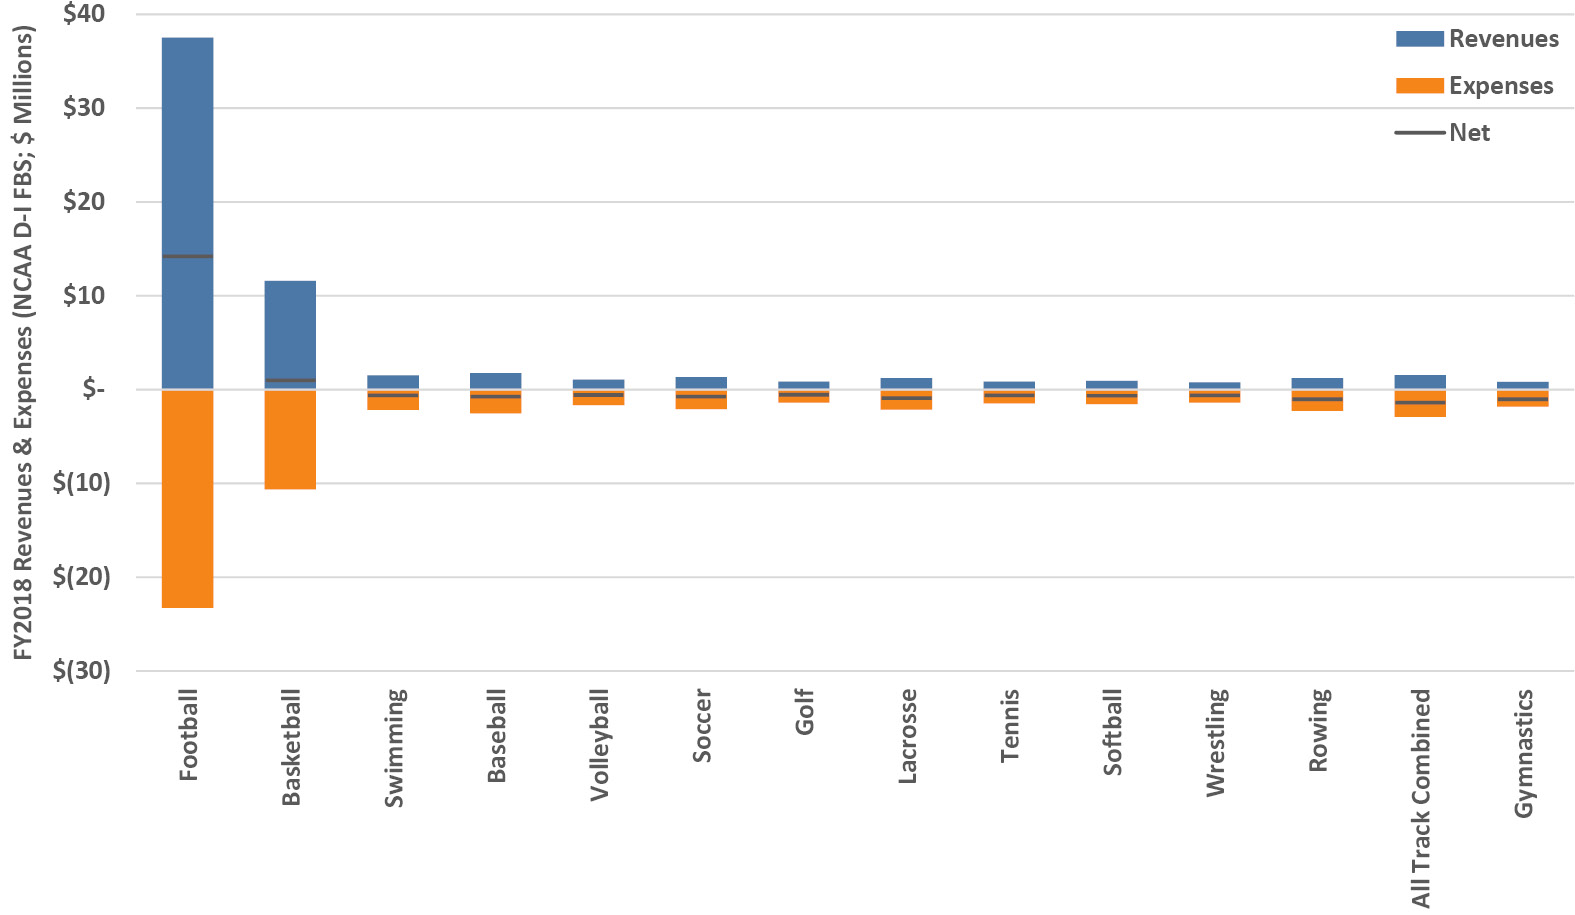
Figure 12.9. FY2018 revenues, expenses and net revenue/loss by sport for all sports with over 1,000 participants in the NCAA Division I FBS. Source: EADA (Office of Postsecondary Education 2020).
While the absolute dollar amounts provide a clear sense of scale across the various sports, it is also enlightening to examine them in relative terms. Figure 12.10 shows net revenue (revenue minus expenditure) for each sport expressed as a share of the spending in that sport, thus providing a relative index of net gain or loss by sport. FBS football produces a margin that is 60% more than its expenses, while basketball margins are less than 10% beyond expenses. Looking at Figure 12.10 we can see the relative gain/loss profile of sports across FBS schools quite plainly: many have net losses that require as much as half of their expenditures to be cross-subsidized, and as we’ve just seen, almost all of that comes from football.
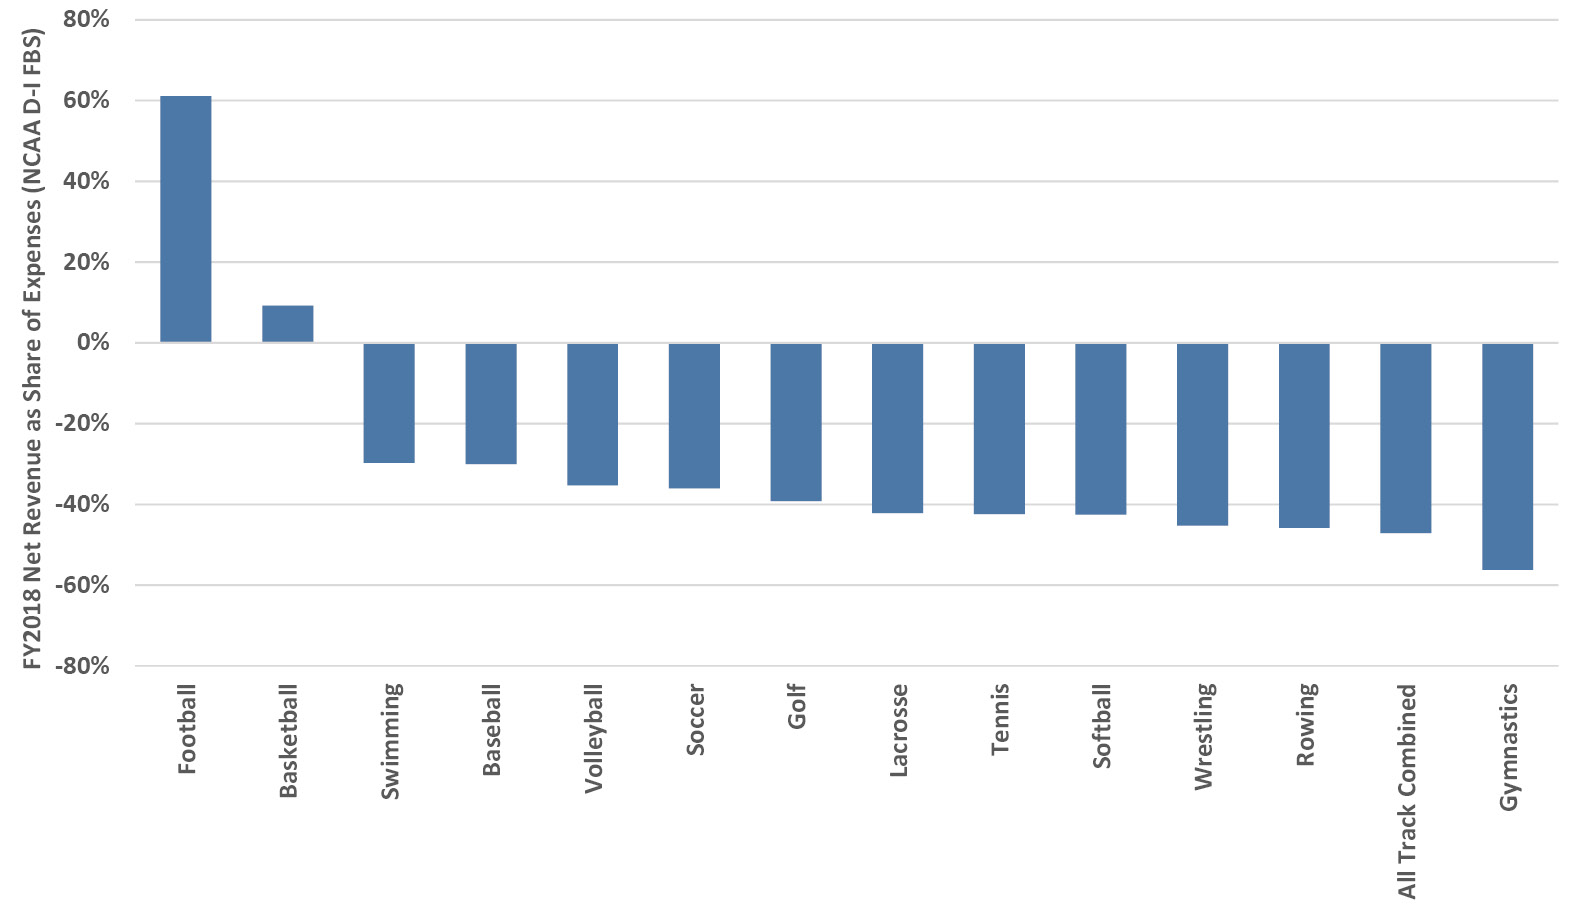
Figure 12.10. FY2018 net revenue/loss as a share of expenses by sport for all sports with over 1,000 participants in the NCAA Division I FBS. Source: EADA (Office of Postsecondary Education 2020).
12.6 Do all head coaches earn millions?
Outside of the NCAA Division I, which is to say at the majority of institutions, head coach salaries across all sports are unexceptional, averaging $45,000 (NAIA Division II) to $69,000 (NCAA Division II with football) in FY2018 (Office of Postsecondary Education 2020). Headline-grabbing seven-figure head coach salaries are largely a feature of NCAA Division I FBS football and basketball, especially in the Power Five conferences. Figure 12.11 illustrates overall head coach compensation for the revenue sports in the Power Five. At these eye-watering levels, football head coaches average $5M annually in the SEC and “only” $3M in the PAC-12. Those earnings are 25–65% higher than the men’s basketball head coaches that average just over $2M in the PAC-12 and near $3M in the other conferences. Base institutional salaries generally account for over 90% of the total pay, with 3–9% in bonuses and up to 6% from non-university athletically-related compensation (e.g., endorsements, consulting with apparel and equipment manufacturers, guest speaking, sports camps). These coaches are usually the highest compensated individuals at their institutions, earning more than the president and the rock-star surgeons. For some observers these numbers are obscene and for others they are the reality of the market, but all can agree that they are quite extraordinary.7
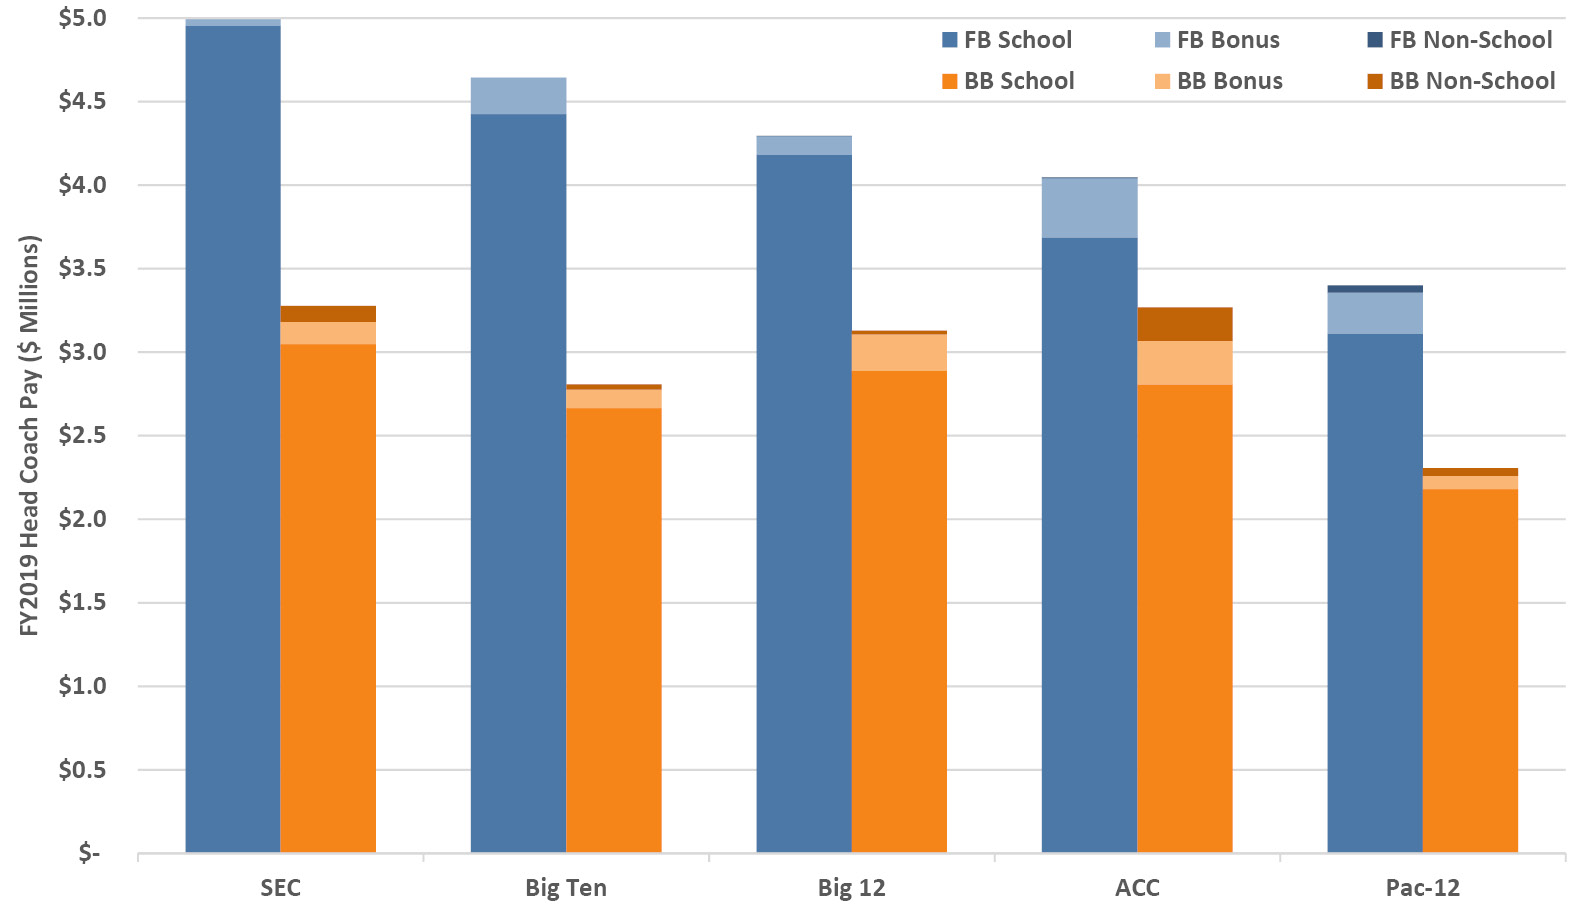
Figure 12.11. FY2019 football and men’s basketball head coach pay for the NCAA Division I FBS Power Five conferences, including base institutional salary, bonuses paid and athletically related compensation from non-university sources. Source: USA Today (2020a; 2020b).
What about trends in head coach salaries? Figure 12.12 shows inflation-adjusted head coach salaries averaged for all sports by division since FY2003. FBS head coach salaries have risen dramatically, more than doubling over this period at an annualized rate of 5% above the rate of inflation. No doubt the football and basketball coaches’ compensation affect the average—major football coach salaries rose 9% from FY2018 to FY2019 (Lederman 2019)—but non-revenue coaches at Power Five schools have seen steep raises too (Berkowitz et al. 2019). FCS head coaches earn about the same in real terms now as they did in 2003, while head coaches in the non-football subdivision of NCAA Division I have grown at an annualized rate of 1.6% above inflation since then. Outside of NCAA Division I, head coach salaries have remained flat for over a decade—those coaches, who comprise the majority of head coaches nationally, are making relatively less today in real terms than they did in the early 2000s. As in other aspects of college athletics finances, in head coach compensation amounts and trends the contrasts between the top-tier and the rest are as conspicuous as ever.
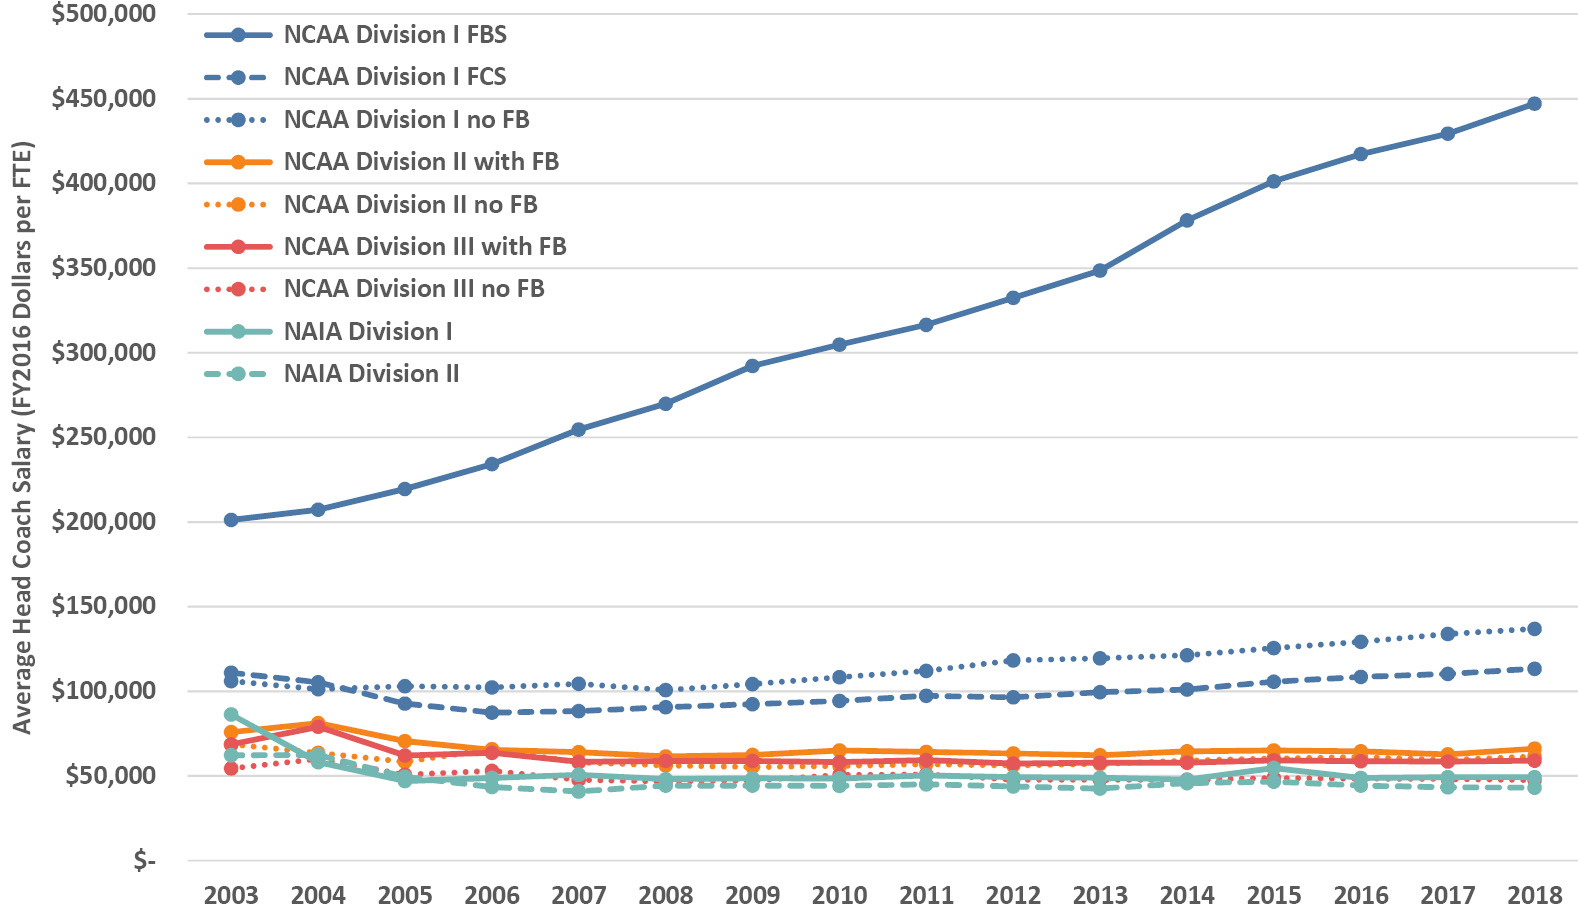
Figure 12.12. Trends in inflation-adjusted average institutional head coach salary across all sports by athletic association, division, and subdivision. Source: EADA (Office of Postsecondary Education 2020).
12.7 Does athletic success benefit the university’s bottom line?
It happened on a windy and rainy Miami afternoon in 1984, the Friday after Thanksgiving, at the end of a nationally-televised football game between Boston College and defending national champions, the University of Miami. An improbable Hail Mary pass in the final second of the game by Doug Flutie,8 the Boston College quarterback, led to a classic victory and ensured that this now-legendary moment became enshrined in the annals of college sports. For two years following the win, Boston College experienced a rise in applications that many attributed to the school’s high-exposure success on the field. The post-game increase was alliteratively dubbed the Flutie Factor, or Flutie Effect. Ever since then, because most football seasons and virtually every basketball tournament produce compelling underdog stories,9 anecdotes surface regularly about the Flutie Factor working for other schools (Nowicki 2014; Wikipedia 2020).
The claimed benefits of this supposed phenomenon have broadened over the years to include not only the quantity of applications but also their quality, reputational rankings, merchandise sales, publicity value, philanthropic gifts, attendance growth, licensing royalties, and state appropriations as well as less tangible benefits including name recognition and institutional prominence. While increased game attendance, team merchandise sales and licensing royalties are unsurprising following high-profile athletic success, they benefit primarily the athletic department.
What about the more fundamental assertion embodied in the Flutie Factor, that athletics success benefits the wider university? It turns out that unequivocal answers to that question were elusive for many years, with studies of varying scope and sophistication producing mixed and even contradictory results. The two most comprehensive and econometrically advanced studies are both recent: a paper by Anderson (2017) and an article by Baumer and Zimbalist (2019). The latter authors provide an expert review of the literature covering 25 studies; those findings, the results of their own analyses, and two further recent papers (Eggers et al. 2019; D.R. Smith 2019), for a total of 28 altogether, are the basis for the relationships depicted in Figure 12.13. Nearly all of the studies focus on NCAA Division I, some more narrowly on the FBS, and the majority cover football although some incorporate men’s basketball; 16 of the studies focus on applicant quantity and quality, 11 on philanthropic giving, and 4 on state appropriations.
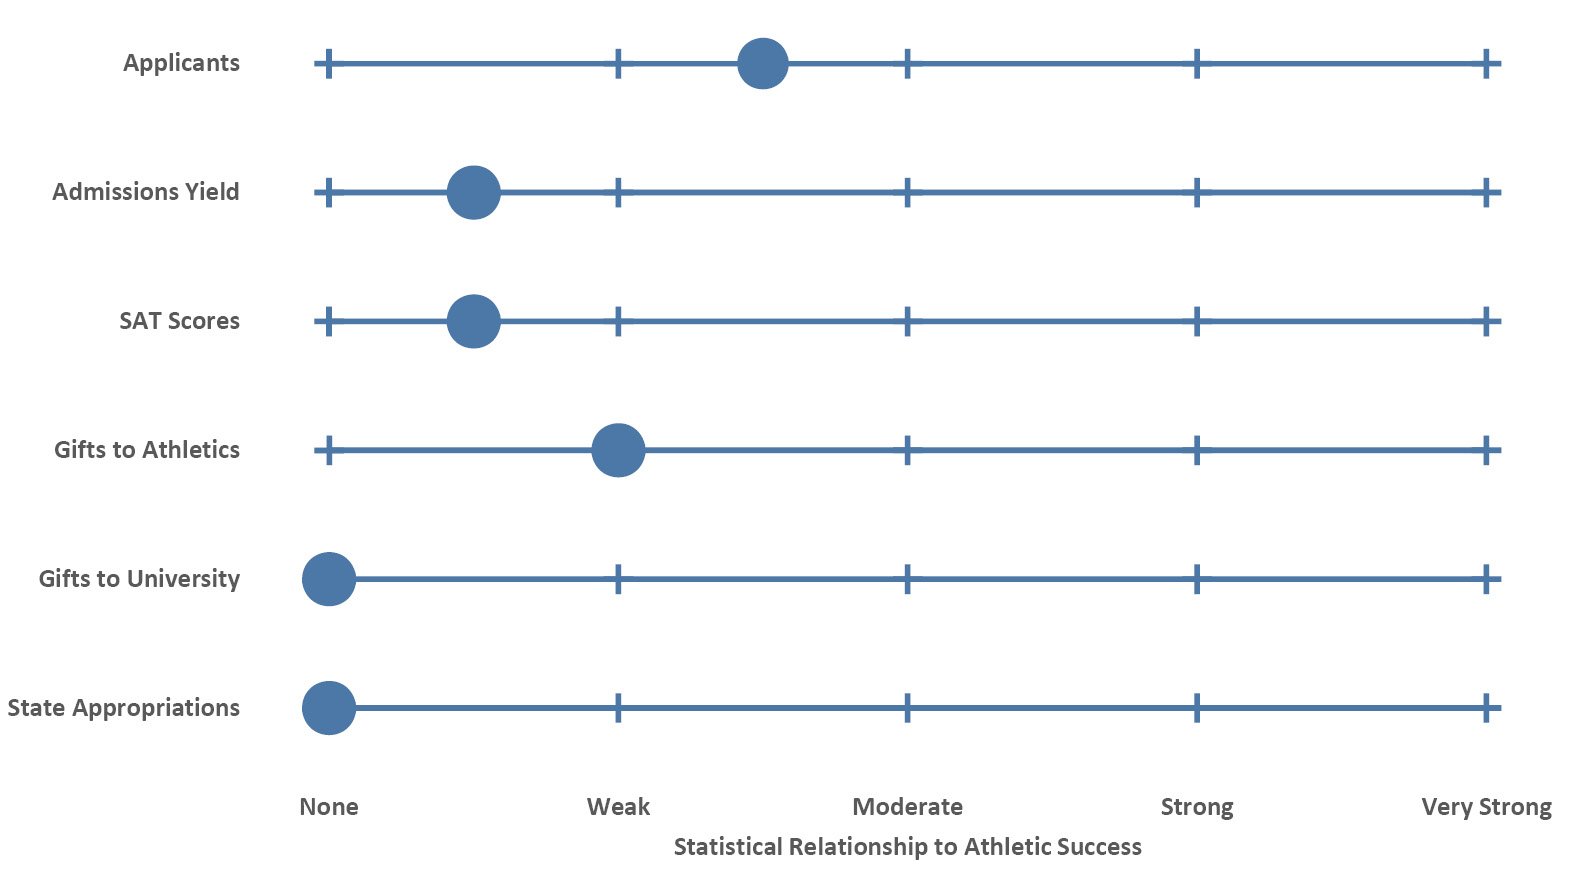
Figure 12.13. Summary of the strength of statistical relationships between athletic success and hypothesized benefits, based on review of 28 scholarly articles. See text for details.
None of the relationships are strong, and those with any effect favor football over basketball. The statistical link between athletic success and number of subsequent applicants is weak to moderate at best, with the size of the increase being just 0.5–1% in the most comprehensive studies and lasting one to three years; when studied, the additional applicants tended to be less academically prepared and originated in-state. That likely explains why the observed effect on admissions yield is extremely weak statistically and any effect is small (about 0.5%). The relationship between athletic success and a school’s SAT scores is likewise exceedingly weak, with an essentially meaningless impact of 0 to 8 points (a fraction of a percent). None of these applicant quantity or quality metrics has a direct financial benefit, and many schools have fixed incoming classes, but it could be argued that improvements in yield might make the institution slightly more selective and thus able to charge higher tuition.
Figure 12.13 also illustrates several metrics that are explicitly financial: gifts to the athletics program, gifts to the university excluding athletics, and state appropriations. Analyses of giving are plagued by incomplete data, but there may be a weak statistical link to athletic giving, with an impact of several hundred thousand dollars (perhaps 5–10%). There is no robust link between athletic success and broader university giving, nor is there a relationship to legislative appropriations to public institutions.
Overall, under expert scrutiny, it appears that the Flutie Factor is often exaggerated, and the limited effects found in the most thorough studies are small when they exist at all. Interestingly, the attribution of the enrollment bump at Boston College to the Flutie Factor was later discounted and was instead explained by a set of campus investments and enrollment growth in the years before and after Flutie’s eponymous pass (McDonald 2003). Despite the lackluster evidence, it’s a testament to the power of a great story that advocates and commentators continue to mention the Flutie Factor when discussions turn to the benefits of college athletics for the rest of campus.
1 The first intercollegiate sporting event was held in 1852, a four-mile rowing race known as the Harvard-Yale Regatta that marked the first of many US college sports rivalries and continues today.
2 IPEDS holds very little financial data on athletics programs, and several other data sets deal only with public institutions. Fortunately, the US Department of Education provides data from the Equity in Athletics Disclosure Act (EADA) that includes detailed information on the public and private institutions in our data set (Office of Postsecondary Education 2020).
3 The Pac-12 has two entities, the Pac-12 conference and the Pac-12 Networks, that had respective FY2018 revenues of $370M and $127M for a consolidated total of $497M.
4 The Power Five conferences are the ACC, Big Ten, Big 12, Pac-12 and SEC. The NCAA grants them autonomy to create their own rules to benefit athletes, which includes allocating more resources. The remaining (non-autonomous) FBS conferences are sometimes called the Group of Five.
5 Athletics subsidies contribute to the historic tension between academic and athletic priorities. For the record, despite an admission advantage (Malekoff 2005) and lower GPAs (Rampell 2010), graduation rates for athletes are higher than for the broader student body (NCAA 2019b).
6 In FY2018, FBS schools per-athlete spending averaged almost $300,000 in basketball and almost $200,000 in football. The other FBS sports averaged about $50,000 per athlete and ranged between $10,000 (Sailing) and $120,000 (Ice Hockey) per athlete (Office of Postsecondary Education 2020).
7 The contrast between the sky-high coaches’ salaries, athletics revenues, and the prohibition against student-athlete compensation has for years created rising pressure on the NCAA to permit athletes to profit from their name, image and likeness, a decision that it recently approved (Anderson 2020a). The highest-rated football recruits in the FBS generate $650,000 for their programs annually (Anderson 2020b). A recent study estimated that in the Power Five conferences, assuming wage structures from professional sports and a 50% share of revenue, that a starting quarterback should earn $2.4M annually, a wide receiver $1.3M, with the lowest-paid backups still earning over $100,000 annually (Garthwaite et al. 2020).
8 After winning the Heisman Trophy and becoming the first to break the 10,000 yards passing barrier in a college career, Flutie went on to play professional football. He retired from the game in 2006 and became a sports broadcaster. Of the many articles on what became known as the Hail Flutie game, one of the most evocative was written for its 30th anniversary by Mark Brown (2014); it includes the obligatory video clip and many others in a lively summary of the game.
9 One of the most notable Cinderella stories is the rise of Gonzaga, a previously obscure small college in Spokane, Washington, that was in serious enrollment and financial decline during the 1990s. After bursting to prominence in the Elite Eight round of the 1999 NCAA Men’s basketball tournament, a series of major athletics gifts and continued strong performance vaulted the school’s national exposure and led to documented increases in enrollments and academic quality of applicants (O’Neil 2017).
