3. Institutional Expenditures
© Andrew C. Comrie, CC BY 4.0 https://doi.org/10.11647/OBP.0240.03
3.1 Where does all the money go?
Higher education is a labor-intensive industry, so it’s no surprise that people, in the budgetary form of salaries, wages and benefits, are the single biggest category of expense for universities and colleges. More prosaically, meeting payroll is the biggest institutional bill each month.
Figure 3.1 shows the average mix of expenditures by nature of expense, one of two views of expenditures that we’ll examine. In this view, the proportions are remarkably similar across all types and sizes of our example institutions. It is easy to see that salaries and benefits combined make up over half of all expenditures. The remaining major natural expense categories are all under 10% of the total. Operation and maintenance of the physical plant (permanent built infrastructure), also known as O&M, is easy to cut in lean years but it inevitably accumulates into much larger costs over time, which become even tougher to afford. Major equipment is accounted for through depreciation, spreading its cost over the expected useful lifespan rather than incurring it all in a single year. To use two everyday analogies, O&M is like maintenance on your house, while depreciation is like the annually decreasing value of your car. And, to complete the house analogy, interest in this case is what the institution pays on its debt (often in the form of bond financing to build buildings, see Section 10.3), which is like the mortgage payment on your house.
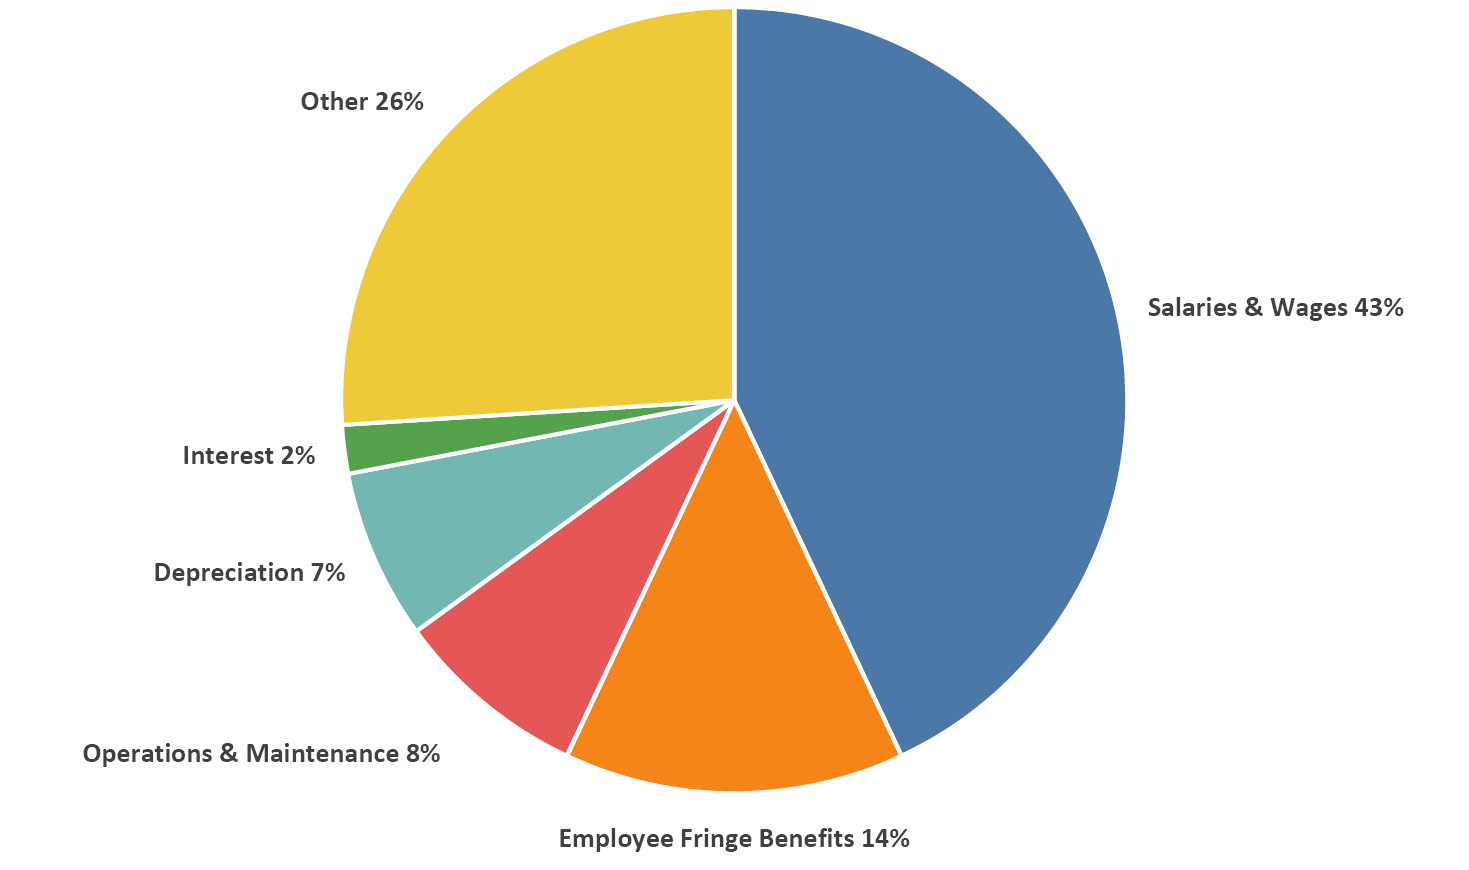
Figure 3.1. Percentages of FY2017 non-hospital expenditures averaged across institution types, by nature of expense. Source: IPEDS (2020).
The other view of expenditures is by function of the expense, as illustrated in Figure 3.2, where the same dollars are instead tagged to the core mission and supporting activities of the university. On average across our example institutions, instruction is the single largest functional expenditure and it includes faculty salaries and benefits, office supplies, and the administration of academic departments. Research here includes the cost of research centers and institutes as well as restricted funds (see Section 2.11) for sponsored research projects. Accounting of public service includes separately budgeted activities such as cooperative extension services, public broadcasting, and public information offices. Following the three core mission areas are four vital categories that support and supplement the core missions, and which together play a sizable role in the expenditure budget. Academic support covers activities that support all three mission areas such as libraries, computing, museums, and deans’ offices. Student services incorporates recruitment, admissions, the registrar’s office, career center, financial aid administration, and student clubs. Institutional support consists of general administration, executive leadership, the legal office, financial services, public relations, and facility operations. Auxiliary enterprises include residence halls, bookstores, and dining services (we’ve omitted hospitals to enable equivalent comparisons, as explained earlier). The remaining small categories comprise scholarship and grant aid expenses, independent operations, and other expenses.
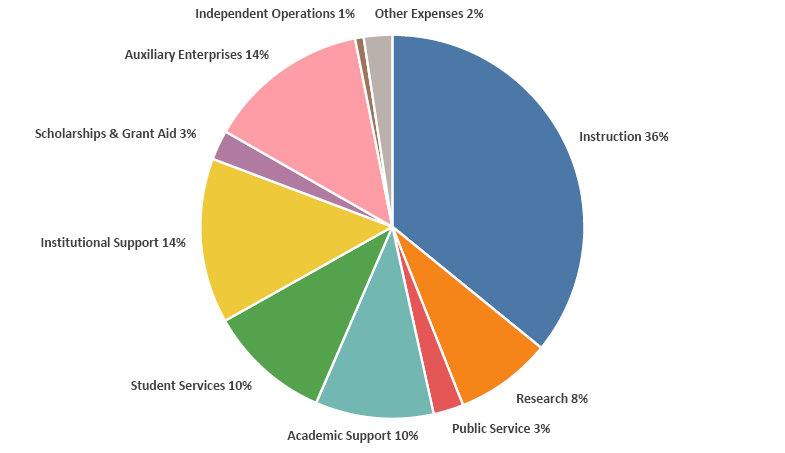
Figure 3.2. Percentages of FY2017 non-hospital expenditures averaged across institution types, by function of expense. Source: IPEDS (2020).
These functional expenditure data highlight a point I made in Chapter 1, which is that universities are complicated institutions. Investing in the multiple interlocking and interdependent activities listed above is necessary for a thriving institution that carries out its mission well, and that’s why managing a university is a form of matrix management (cross-functional management, to be more precise, but that’s a story for another book). The university’s expenditure budget reflects this reality because in effect it is a matrix of the natural and functional views above (e.g., salaries, O&M, etc. within instruction, research and so on), only with hundreds of fine-scaled categories.
3.2 How does investment in major functions differ
by type of institution?
There are some interesting patterns in the proportion of budget that types of institutions spend on major functional areas, the most notable being instruction and research. In Figure 3.3, perhaps the most remarkable pattern is the consistency in the proportion of budget invested in instruction—just over one third across all types of institutions. We can see that research expenditures shrink relative to instruction and other areas as one moves from the R1 schools to smaller institutions that do less research, just as one would expect. Expenditures on public service are, again as expected, a much larger portion of the budget at public institutions, especially the R1 & R2 publics (the groups that includes most of the land-grant institutions).
Academic support is a similar proportion across all types of school, but the portions of budget invested in student services show a relative increase at smaller schools with slightly greater portions at the privates. Private institutions expend relatively more on administration (institutional support) than do their public counterparts, with relatively higher portions at smaller public and private schools. Scholarships and grant aid are primarily a feature of public universities (as we’ve seen, private schools tend to discount relatively more instead). The portion of expenditures on auxiliaries is similar across all institutions. There are some notable differences in independent operations, with R1 private institutions far outweighing all others.
In Section 2.3 we saw that overall expenditures (and revenues) have trended upwards for years. Seeing the public-private differences in expenditures above and knowing that not only financial resources, but also enrollments differ across these schools, the logical comparison across institutions is to look at expenditures per student, which we cover in the next section.
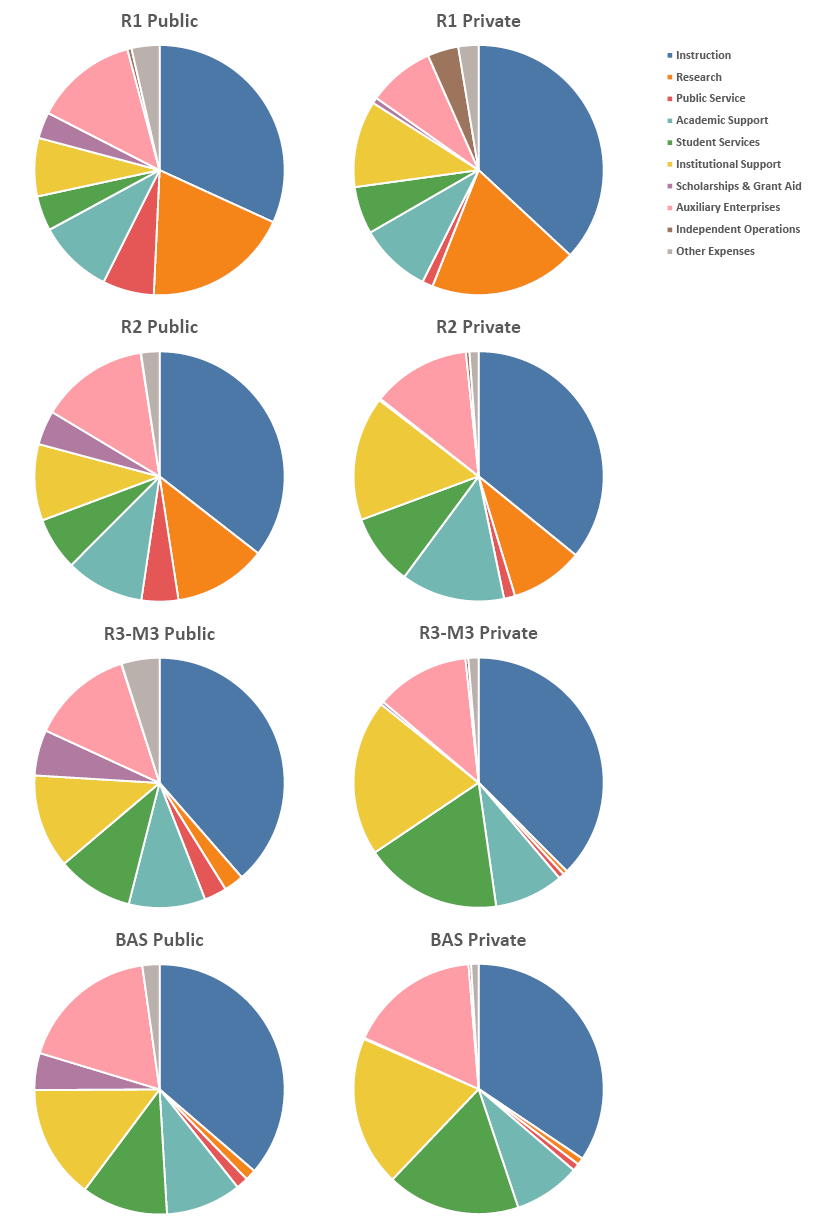
Figure 3.3. Percentages of FY2017 non-hospital functional expenditures averaged by Carnegie classification and control. Source: IPEDS (2020).
3.3 What do institutions spend per student?
There are several ways to answer this question, and none of them is perfect because it is virtually impossible to untangle strictly student-related expenditures from other kinds, and because purposes often overlap. The simplest and least satisfactory approach is to take the entire budget of the institution and divide by the number of students, but at large research universities that would overestimate what was allocated to supporting students versus other activities. We could omit auxiliaries, independent operations, etc. and keep only the first six categories in Figure 3.2 and Figure 3.3, which is a version of the so-called Educational and General (E&G, or sometimes G&E) budget, but that still includes research and public service that could skew the comparisons. So, to focus in on educational and related spending only, we compute a version of the Education and Related (E&R) budget,1 which includes only expenditures on instruction, academic support, student services and institutional support.
As Figure 3.4 illustrates, the differences in E&R spending per FTE student across types of institutions appear to be dramatic, but (some) appearances can be deceiving. Starting with the publics, R1 universities appear to spend about one third to one half more per student than the medium and smaller publics. Recall from Section 3.1, however, that all faculty costs are accounted for under instruction expenditures, and yet at research universities faculty time is split between teaching, research and service (often 40:40:20 or similar at an R1) with a higher research expectation than elsewhere. There is no precise way to adjust for this in national data, but as a (very) rough estimate we can simply deduct 40% from the instruction column for the R1 universities to get a sense of more comparable numbers (given that this is a crude estimate, I have not shown a prorated adjustment for R2 or R3 schools, keeping with the simplest approach for now; we’ll return to this issue when we deal with research in Chapter 8). With the adjustment, instructional spending per student across the publics is around $10,000, with a little more spending per capita on support services at the bigger schools. After the R1 adjustment, all publics in our examples average in the $15,000 to $20,000 annual dollars per student range. Moving on to the privates, even after the adjustment the R1 private universities spend almost three times more per student than their public counterparts (over $60,000 per year). The R2 privates and baccalaureate colleges spend about double their public counterparts (about $37,000 per student per year). Interestingly, the R3-M3 privates spend about the same as their public counterparts (about $20,000)—this may be because this category includes some of the most financially-stressed and tuition-dependent institutions.
Overall, the main take-home point from this section is that many private institutions spend about twice as much or more per student than public institutions do (parallel with their tuition which is also roughly double, see Section 2.8). We’ve known for several decades (Getz and Siegfried 1991) that the two principal reasons why spending per student differs across institutions are, first, differences in student to faculty ratios and, second, differences in part-time faculty and other instructional resources (see Chapters 5 and 6).
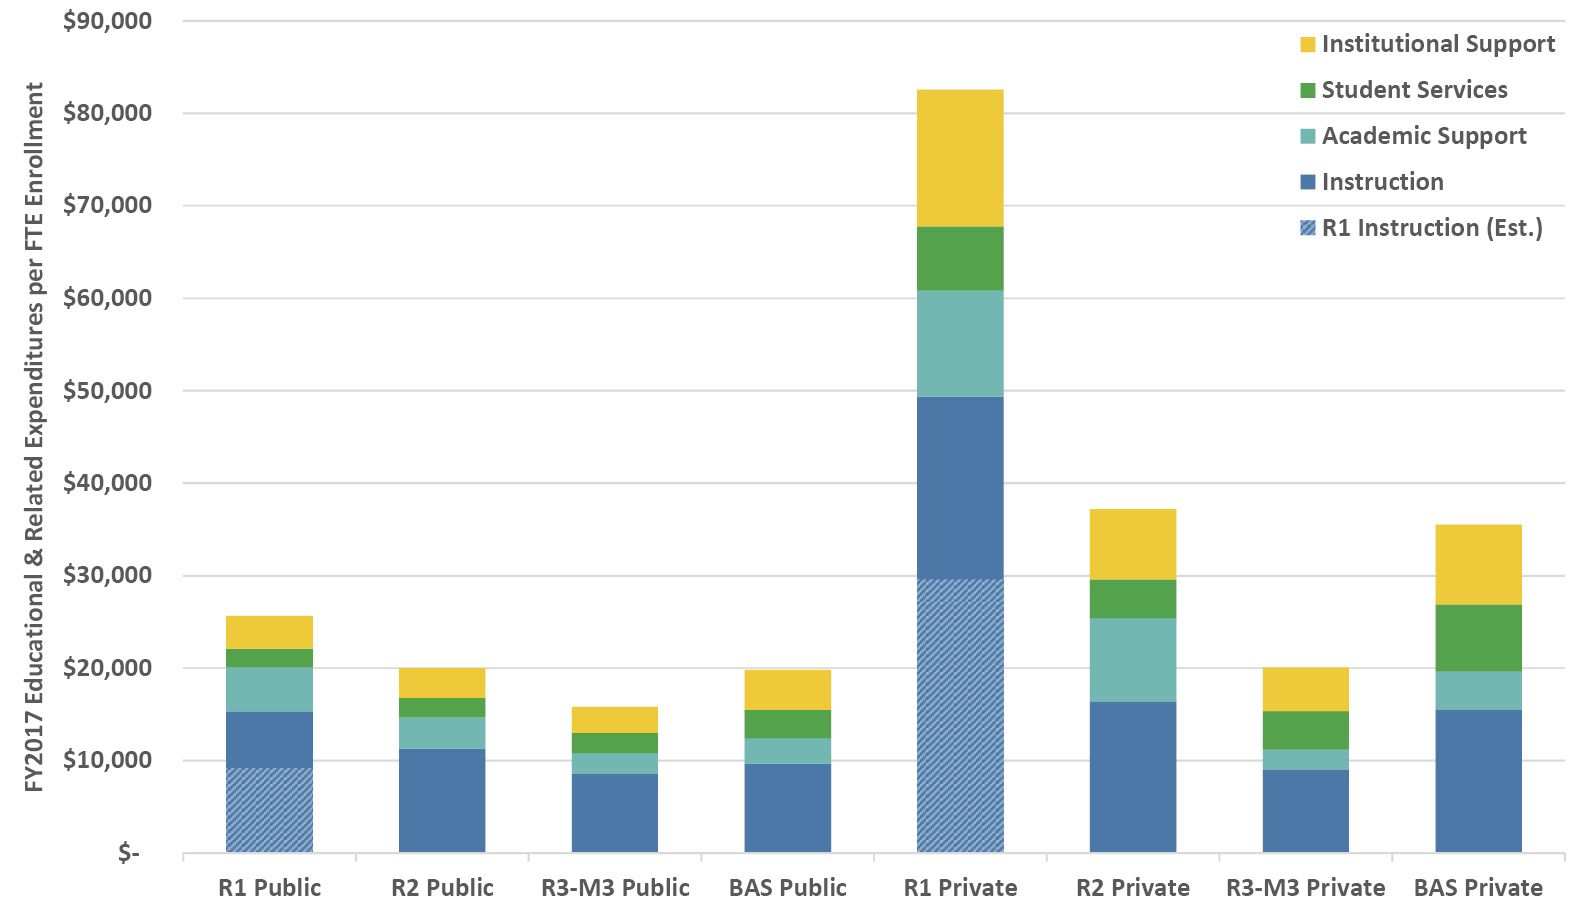
Figure 3.4. FY2017 Educational and Related (E&R) expenditures per full-time equivalent student averaged by control and Carnegie classification. See text for estimate of R1 instructional spending without faculty research time. Source: IPEDS (2020).
3.4 What are the trends in per-student spending?
The trends in E&R and non-E&R expenditures as well as total expenditures are illustrated in Figure 3.5. I’ve only shown the overall averages across publics and privates because the patterns are broadly consistent by size of institution within those groups. At the publics the immediate adjustment to the recession and subsequent recovery involved a $3,000 (30%) drop in non-E&R spending per FTE, $2,000 of which was shifted to E&R spending with the remainder being cut, while at the privates the shifts were relatively subtle. At all institutions, since the recession, essentially all new expenditures have been invested into the educational mission (E&R). Over the dozen years following FY2004, inflation-adjusted E&R spending per student at public institutions shifted from 59% to 72% of the total, with most of that jump in FY2010 right after the start of the recession; the shift at the privates was relatively flat from 76% to 79%.
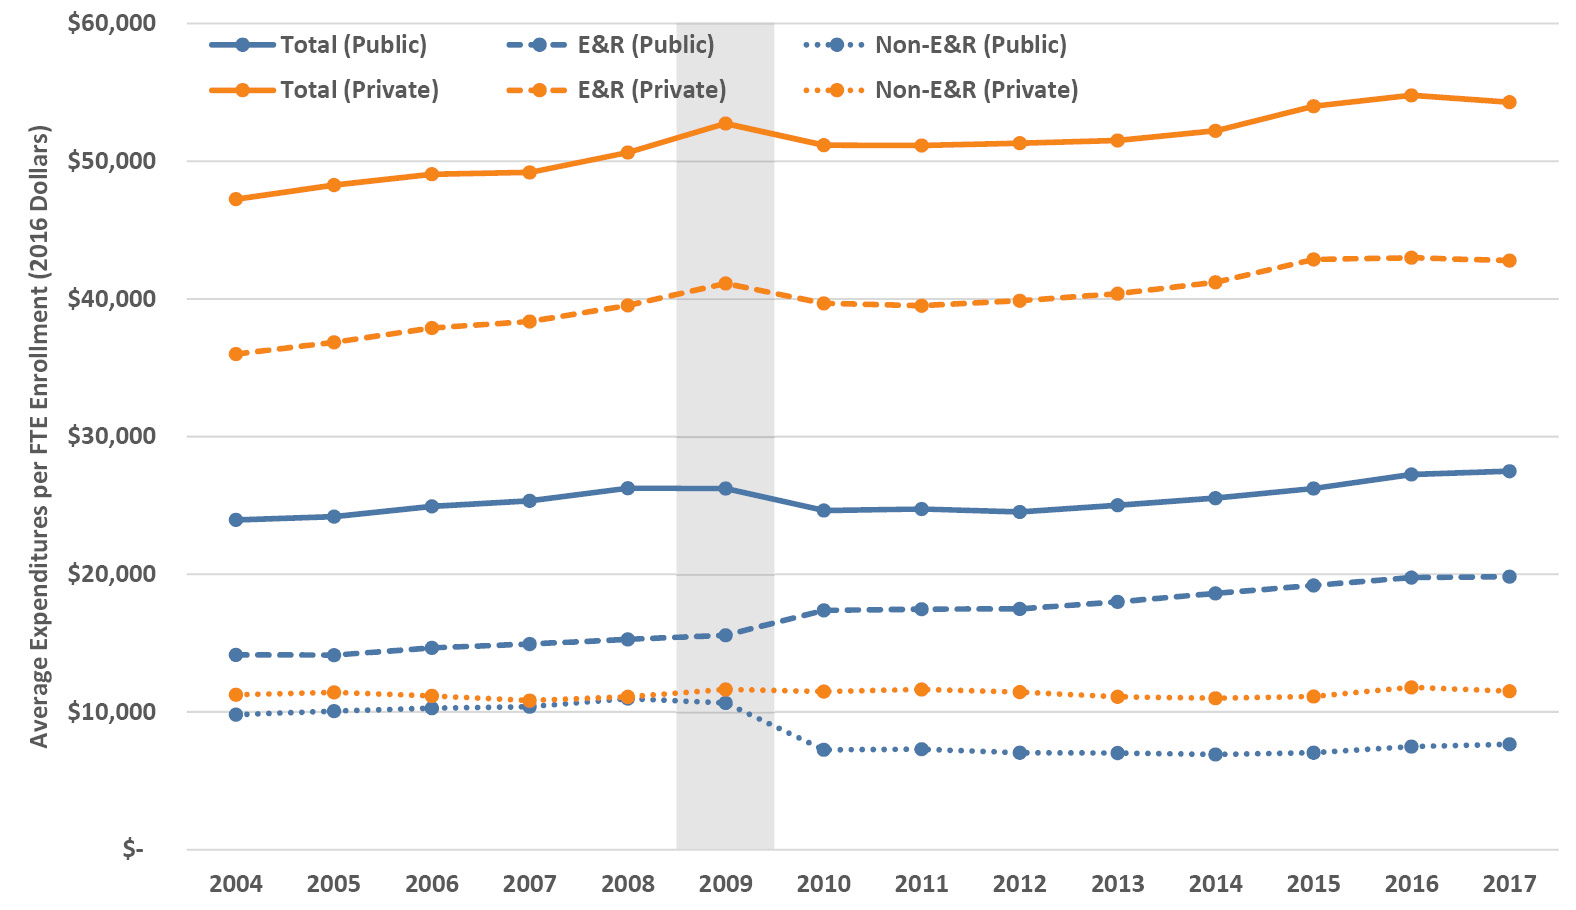
Figure 3.5. Trends in Educational and Related (E&R), non-E&R and total expenditures per FTE of student enrollment (2016 dollars) averaged across public and private institutions. The vertical bar indicates the onset of the Great Recession. Source: IPEDS (2020).
Following the recession onset, both publics and privates took six years to again equal or exceed 2009 amounts in their overall spending per FTE (Figure 3.5). Given the rhetoric of runaway expenses in higher education, and as I similarly noted for revenues, this is an immensely significant point to emphasize: when examined on a per-student basis and adjusted for inflation, from FY2004–2017 the average rate of increase in total institutional spending was 0.7% annually at the publics and 1% annually at the privates (see Section 3.7 for details on underlying cost increases).
3.5 What share of costs are covered by tuition versus subsidy?
How much of what universities invest in E&R spending is paid for by tuition revenue? Or, phrased the other way around, what portion of educational costs are subsidized by the institution? As we saw in Section 2.5, net tuition is the biggest slice of the revenue pie at all types of institutions. We can compare that revenue to expenditure on E&R costs to see what share it covers. Whatever is not covered by tuition is considered the institutional subsidy, which largely comes from state appropriations at the publics and from investment and other revenues at the privates.
Figure 3.6 illustrates the tuition/institutional subsidy split. Given what we know about tuition revenues, it isn’t surprising that the publics generally cover a smaller portion of E&R costs with tuition than do the privates, which rely more on tuition. There are noteworthy distinctions in the details that relate closely to their tuition revenue dependency (roughly following the tuition portion of revenue in Section 2.5). The R1 publics receive a higher tuition portion than do the R1 privates, but the other smaller publics have a lower tuition portion and thus greater subsidy than their private counterparts. The tuition dependency (and therefore enrollment dependency) of the R3-M3 privates is stark, with over 87% of E&R costs being covered by tuition. These data reveal how types of institutions have varying capacities to subsidize the cost of education on a percentage basis, but it is worth keeping in mind that the per-student amounts in dollars are still substantially larger at private institutions (see Section 3.3).
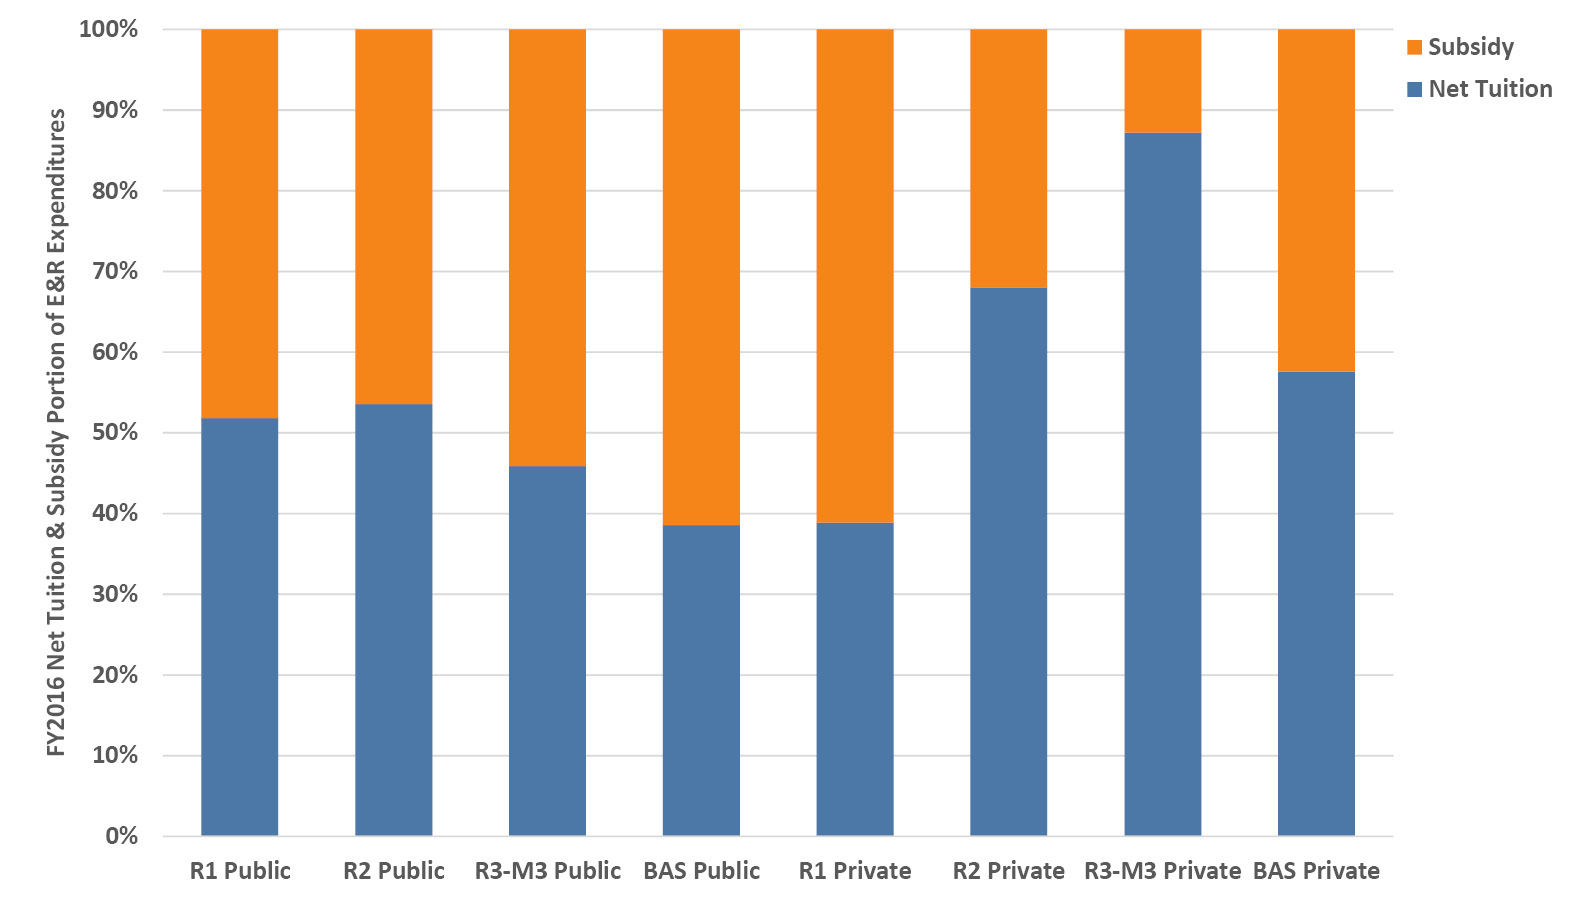
Figure 3.6. FY2016 Net tuition and fee revenue and remaining subsidy portions of Educational and Related (E&R) expenditures averaged by control and Carnegie classification. Source: IPEDS (2020).
The trends in the portion of E&R costs covered by tuition were significantly upward for the publics pre-recession and have been more-or-less flat since then, while the trend for the privates has been relatively flat with a slight increase post-recession (Figure 3.7). At the publics, over the five years from FY2002–2006 the tuition portion of the split went from just over one third to almost half. There is a range by type of public institution: R1 publics have seen a steady increase continuing beyond the recession through FY2016, while public baccalaureate colleges experienced a decrease back to about 40%. The wavy shape of the overall curve for the publics results from the interplay between tuition and state revenues as economic conditions shift. Tuition can rise in good economic times (market forces) and bad (replacing losses in state funding) and state funding can rise in good times and fall in bad (tracking state tax revenue and often lagging by a year or more due to the budget cycle). While these forces induce year-to-year variability, the macro effect is unmistakable—a massive shift to less state funding and more reliance on tuition to cover the cost of public higher education. We delve further into public funding for higher education in Chapter 4.
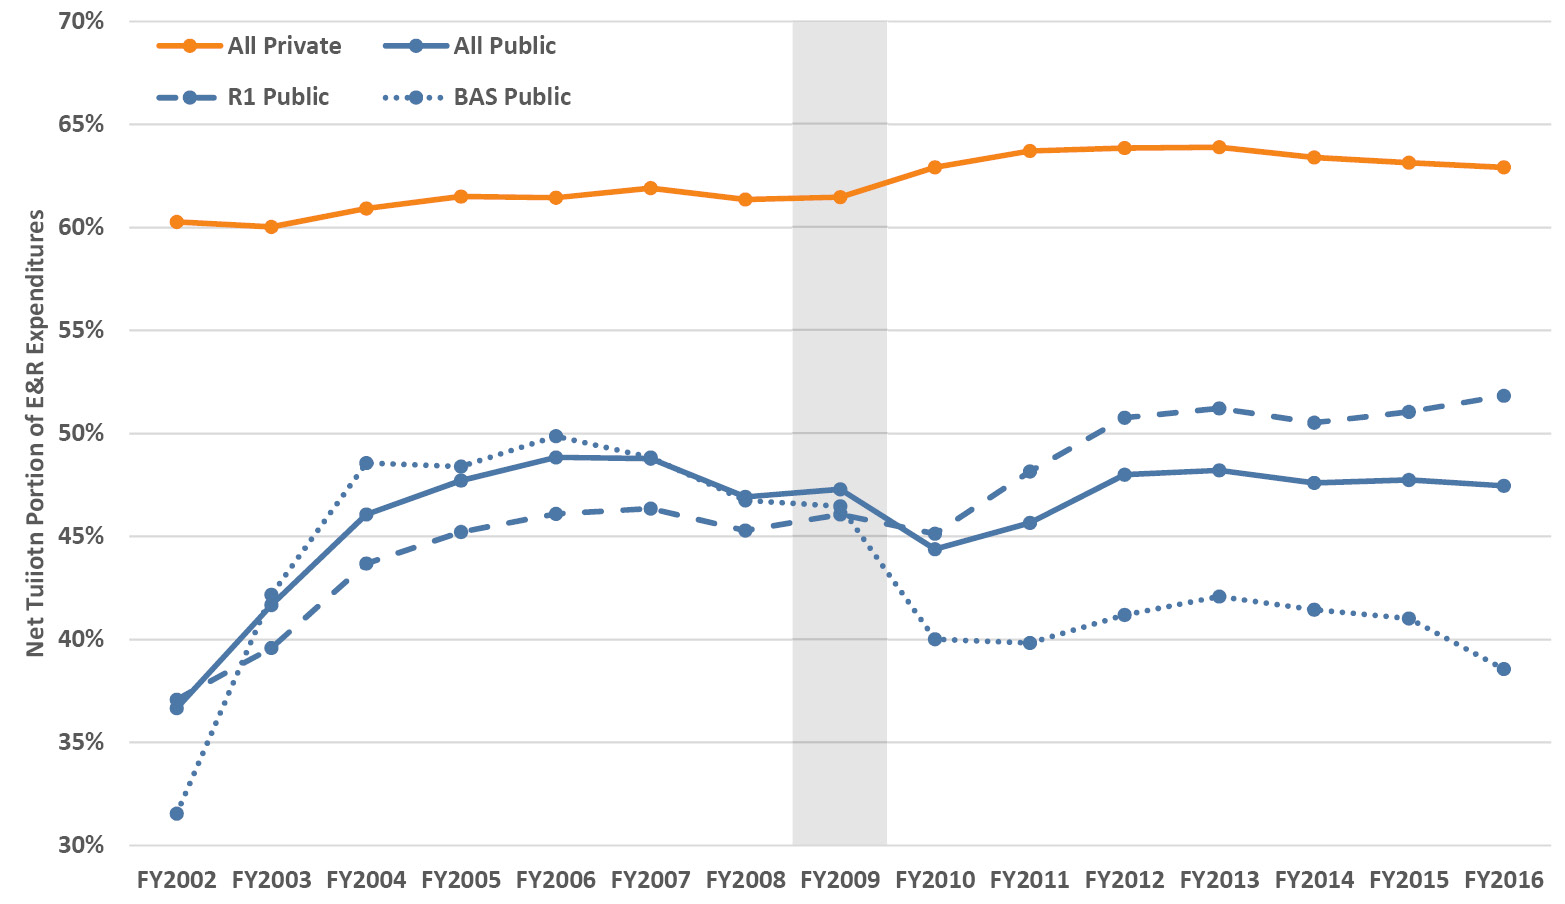
Figure 3.7. Trends in the net tuition and fee revenue portion of Educational and Related (E&R) expenditures averaged for public and private institutions (including the R1 and baccalaureate publics). The vertical bar indicates the onset of the Great Recession. Source: IPEDS (2020).
3.6 Do out-of-state students subsidize in-state students?
Yes and no. We can combine some of our earlier analyses to explain why. First, as we saw in Section 2.13, out-of-state students can contribute as much as twice the per capita share of overall net tuition revenue compared to in-state students. So, in a narrow sense, yes, they contribute a higher proportion of net tuition revenue and that revenue is essential. Nonetheless, in the broader sense, the apparent subsidy is significantly diminished, because net tuition revenue covers only about half the full cost of providing a student’s education (see Section 3.5) at public universities. This is clear in Figure 3.8 where the tuition and subsidy portions of E&R costs are broken out. We can see that out-of-state students don’t “pay for” in-state students but their greater revenue contributions are an important partial offset that nonetheless still doesn’t cover the entire cost of education. Government aid, institutional aid and additional institutional subsidies cover a sizable portion of the costs for all students, both in-state and out-of-state.
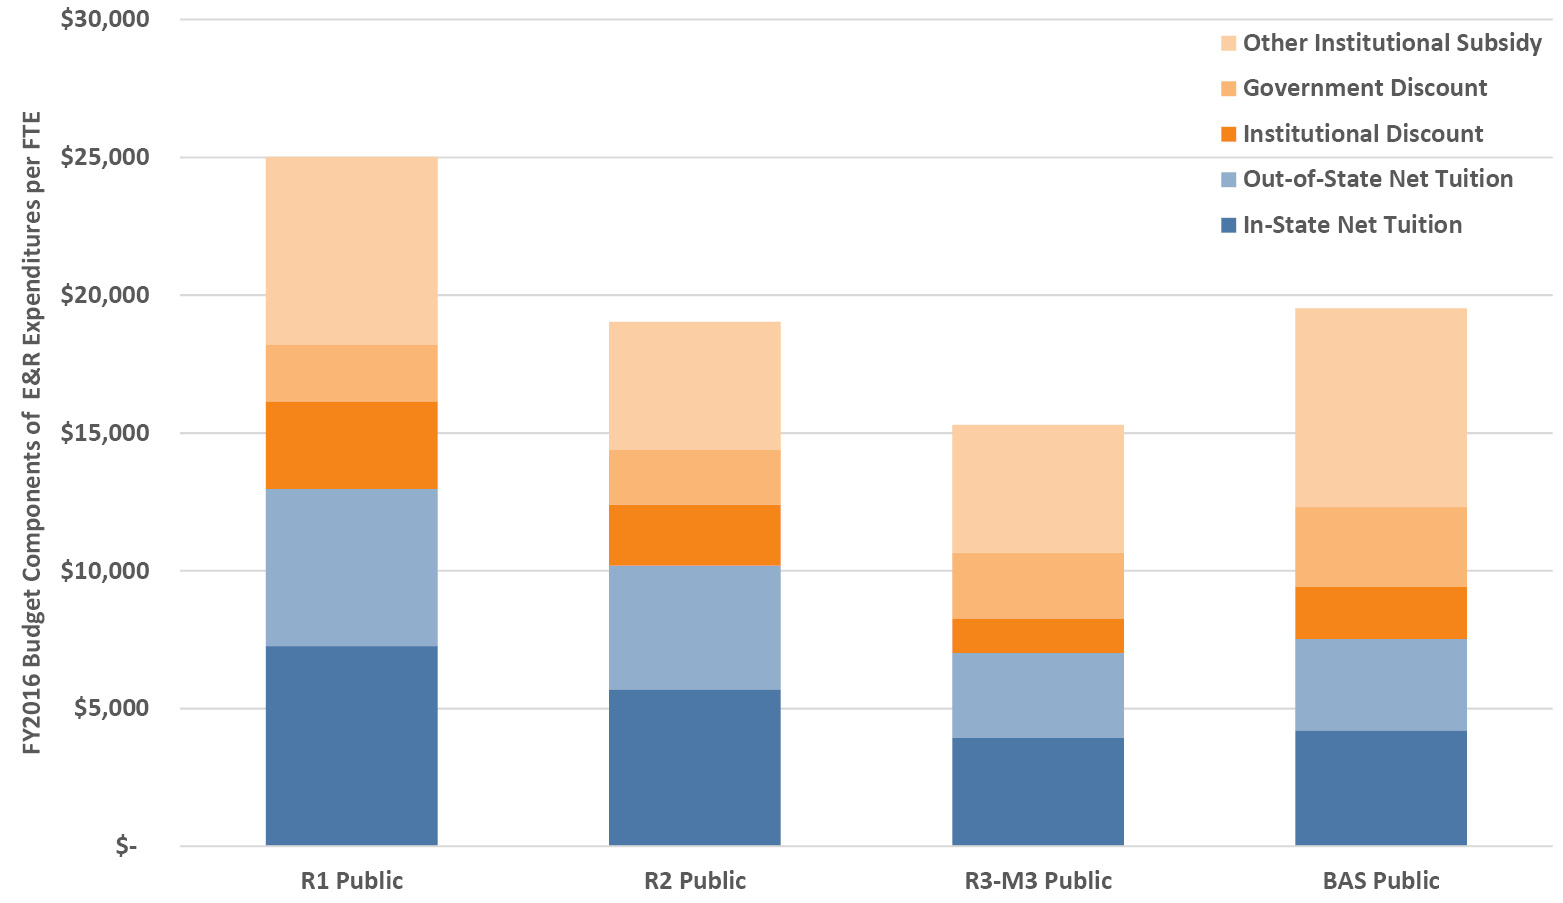
Figure 3.8. FY2016 breakout of net tuition and fee revenue (in-state and out-of-state) and subsidy portions (institutional and government aid plus other institutional subsidy) of Educational and Related (E&R) expenditures per FTE enrollment for public institutions averaged by Carnegie classification. Source: IPEDS (2020).
Instead of using the institutional budget picture we can also look at this from an individual student’s budgetary point of view. Figure 3.9 uses the assumptions of our simple out-of-state model (Table 2.1 in Section 2.13) to illustrate how the average tuition paid, even by out-of-state students, still does not cover the full cost of education. For our example, the average out-of-state student with 30% discount off sticker price through all forms of aid still only pays between 63% and 85% of the actual cost of education depending on the type of school. Likewise, in our model the average in-state student only pays 30% to 36% of the actual cost of education—this is by far the highest value for money in US university education. At about $8,000 per year to attend an R1 public (ranked among the best universities in the world) and just over $5,000 per year for a small public (that also provides an excellent education), over four years this investment is about the same as the cost of a new car and yet it will pay out many times that amount over the career of the graduate (see Section 14.1). Needless to say, in years and decades past, when state support for higher education was relatively higher and tuition lower in real terms, the value was even greater (see Chapter 4).
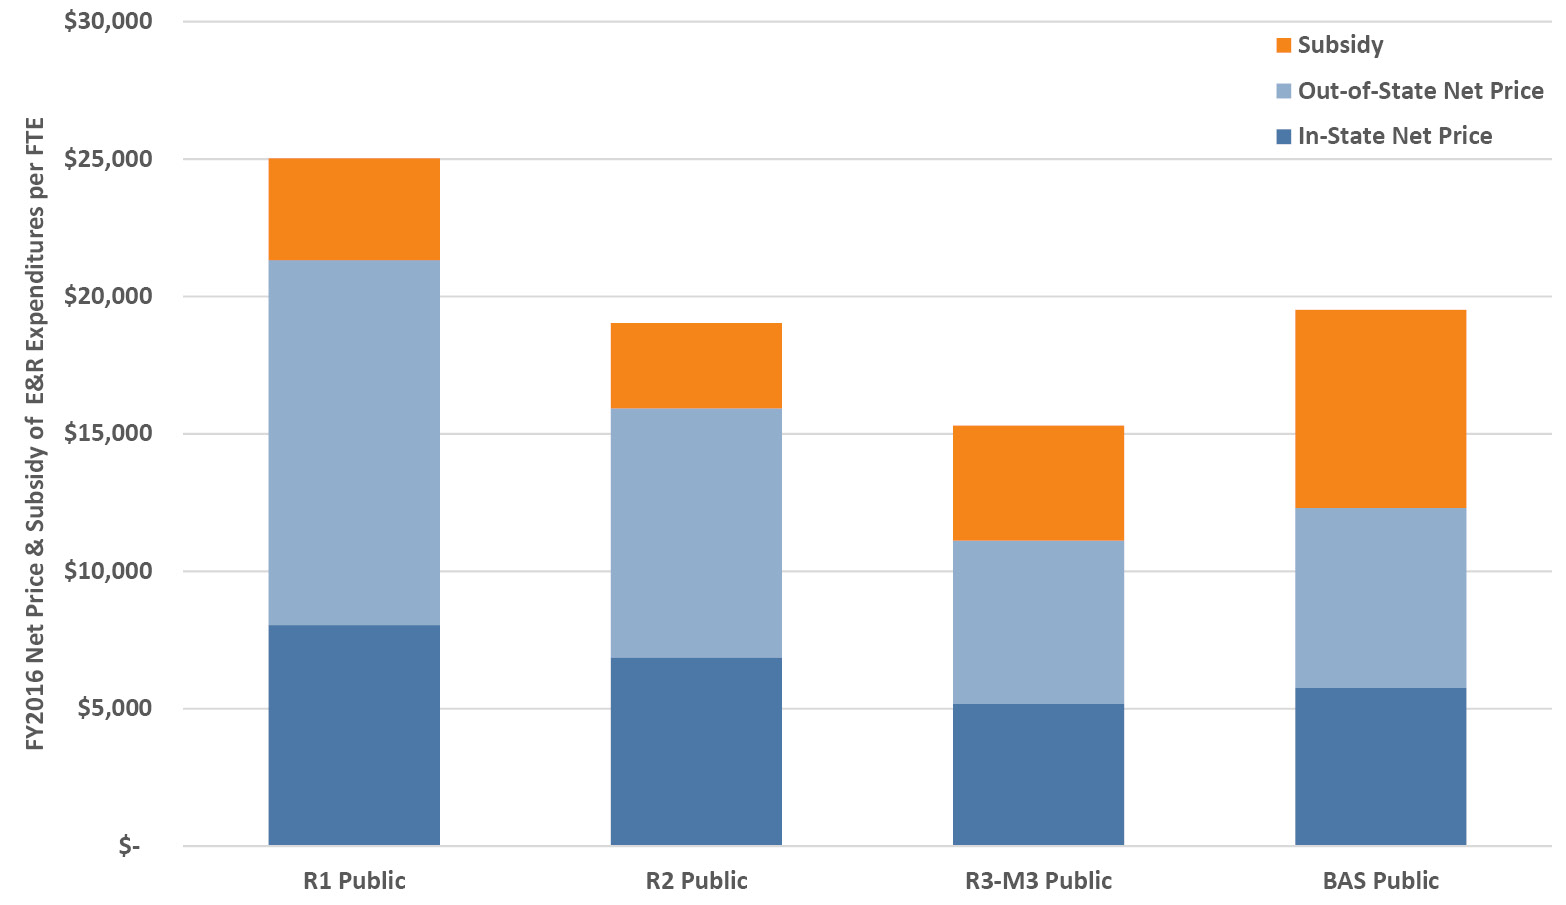
Figure 3.9. Student-oriented net price view of contribution to FY2016 total Educational and Related (E&R) costs per FTE enrollment for public institutions averaged by Carnegie classification. Net price is calculated using the assumptions of the model described in the text, including the same aid rate for in and out of state students. Source: IPEDS (2020).
From the two figures referenced above one could infer, correctly, that institutions lose money on in-state students. It’s reasonable for states to want “their” in-state students to benefit from the state support relative to out-of-state students. However, in most states the per-FTE state appropriation falls well short of the cost of a degree (Chapter 4). So, between stipulated low in-state tuition rates and low state appropriations, there is indeed a marginal cost to a typical public institution taking on additional in-state students. As we’ve seen above, there is also a compensating marginal benefit to taking on additional out-of-state students.
Therefore, it is shortsighted for states to automatically assume that out-of-state students somehow “exclude” in-state students from attending—on the contrary, the extra margin from additional out-of-state students helps offset the greater unrecovered costs of in-state students. So long as the total number of in-state students served is greater than it would be without increasing out-of-state students, and so long as state allocations and in-state tuition underfund the cost of educating in-state students, for financial (and academic) reasons it is therefore good policy to expand the number of out-of-state students at a public institution if states want to serve more in-state students. Certainly, it is incumbent on the institution to maintain academic standards while doing so—doing this simply for budgetary reasons at the expense of institutional quality is financial (and academic) folly in the long run.
In deciding on the right mix of out-of-state to in-state students, institutional leaders must balance a commitment to educate in-state students with the reality that out-of-state students help to lower costs for in-state students. Even if absolute numbers of in-state students increase, a declining share of in-state students can be politically difficult. In practice, we see larger increases in out-of-state students in states with small populations, while states with larger college-bound populations are more easily able to achieve a balance between the two (Mitchell 2018).
3.7 Why do higher education costs rise so much?
We saw in Section 3.4 that higher education spending trends, when adjusted for inflation and considered on a per-student basis, have averaged under 1% annually for over a decade (while revenues remained flat or decreased). Yet, there are countless media articles about the soaring costs of college, and they’re not wrong either. The difference is in the definitions of price versus cost: to students and families, the “sticker price” as well as the net price paid after aid have indeed been increasing, while to institutions the underlying costs of doing business also rise relentlessly. We covered published tuition trends (price) in Section 2.7. We’ll focus on the underlying institutional costs in this section, and we’ll examine price and total cost of attendance from the student perspective in Chapter 7.
There are two overarching economic theories of cost in higher education: Baumol’s “cost disease” and Bowen’s “revenue theory” (Martin and Hill 2014).2 Baumol’s cost disease3 recognizes that labor-intensive personal services industries don’t increase their productivity with scale (Baumol and Bowen 1966; Baumol 2012; Helland and Tabarrok 2019). In performing arts, you need more string quartets doing more concerts to reach a bigger live audience, in healthcare, you need more nurses and doctors to serve more patients, and in higher education, you need more instructors to teach increasing numbers of students. These fixed proportions constrain productivity to remain constant and, with regular pressures to increase wages to cover growth and inflation in the broader economy, the result is a bias towards ever-increasing production costs. Contrast this to other industries such as manufacturing and agriculture, where the effects of automation, scale and going digital have increased productivity and kept costs down.4 At the beginning of this chapter we saw that labor and related expenses account for the largest portion of institutional expenditures, so Baumol’s cost disease is an important driver of overall costs in higher education.
Bowen’s Law extends to all nonprofits, and it explains how marginal revenues are invested in excellence in a never-ending cycle. His revenue theory of cost is summarized as follows (Bowen 1980):
- The dominant goals of institutions are educational excellence, prestige, and influence;
- In quest of excellence, prestige, and influence, there is virtually no limit to the amount of money an institution could spend for seemingly fruitful educational ends;
- Each institution raises all the money it can;
- Each institution spends all it raises.
Taken together, these four rules lead toward ever increasing expenditures as universities compete for students and pursue prestige, such that higher prices lead to greater value that can lead again to higher prices in a circular process (Massy 2003). Also, a consequence familiar to many on campus is that when budget cuts or academic cost efficiency initiatives come along, they are almost invariably opposed because they are “cutting quality”—the precise product of Bowen’s Law.
Both theories operate simultaneously to drive higher education costs upwards. Empirical studies to test which one has the greater effect have come to differing conclusions. Although earlier analyses showed that cost disease dominates (Archibald and Feldman 2008), more recent work shows that Bowen effects are relatively larger than Baumol effects, and combined they explain 74% of cost changes at public institutions and 63% at private institutions (Martin and Hill 2014). I imagine that in practice the balance changes over time, but either way it’s clear that both forces lead to relatively higher costs for nonprofits that have constant productivity, such as colleges and universities.
The Baumol and Bowen theories have some corollary effects. One has been the evolution of increased production costs owing to a half-century shift in expectations by students and parents along with changing demographics and social policy (Thelin 2018). Decades ago, a smaller proportion of high-school graduates went on to college, and those that did were largely from middle- and upper-income families. Efforts to increase gender and ethnic diversity were in their infancy. While tuition was low compared to today, other costs such as books, board and lodging hindered access. There was little in the way of financial aid and banks would not issue loans to students without collateral. Later, the availability of Pell grants and federal loans greatly broadened access. Their portability also provided students with choice, leading to greater competition among colleges (Thelin 2018). Antiquated approaches to academic success were wasteful in human and financial terms: the infamous student orientation warning—look to your left, look to your right, only one of you will be here in four years—was not apocryphal. Institutions began to invest in retention and student success through academic advising, co-curricular activities, recreation centers, mental-health care and career services. Support services such as these, along with necessary but unfunded compliance mandates, form the bulk of what is pejoratively called administrative bloat (see Section 5.9 for more on that topic). The expansion of academic and student services has led to relatively larger increases in the number of employees and associated costs in this part of the higher education workforce (see Section 7.1), an unintended but nonetheless classic Baumol effect.
A further noteworthy effect is called the principal-agent problem, which results from asymmetric information and differential interests in the outcome between two contracted parties. For example, when you need to take your car for repairs you (a) don’t have proper information on successful outcomes (repair success rates) so you rely on reputation, and (b) the mechanic has an incentive to charge you for things you don’t need rather than acting in your best interests. We see examples of this problem every day, including between voters and politicians, shareholders and company management, and clients and lawyers (Wikipedia 2018). In higher education the principal-agent problem is related to Bowen’s Law in that, without explicit data and meaningful metrics of output quality, spending on quality is effectively spending on reputation that thereby contributes to the cost spiral (Martin 2009).
So, how big is the net effect of these factors on higher education costs? The Higher Education Price Index (HEPI) tracks inflation in key higher education costs going back to 1961, and it includes salaries and benefits for faculty, administrators, clerical and service staff, as well as utilities, supplies and materials, and miscellaneous services (Commonfund Institute 2017a). Not surprisingly, it mirrors university budgets and is dominated by labor costs. One can think of HEPI as the inflation rate for the goods and services that higher education institutions purchase, much as the CPI is the general inflation rate for those that consumers purchase. Both are shown in Figure 3.10, in their index form with a common base year for comparative purposes and in terms of their annual inflation rates. Over a bit more than a half-century, the two rates are highly correlated (r = 0.99) with the underlying costs of higher education clearly rising faster than general inflation. Looking at the annual inflation in each index, there have been alternating periods in which one exceeds the other, and over the entire period the HEPI inflation rate averages 0.65% above the CPI inflation rate. For the last decade this difference has been about 0.5%, which, as one might hypothesize, approaches the overall higher education spending per FTE growth rate mentioned at the beginning of this section. Finally, remember that we’ve been talking about costs. Price is covered in the sections on tuition (2.7) and discounting (7.5).
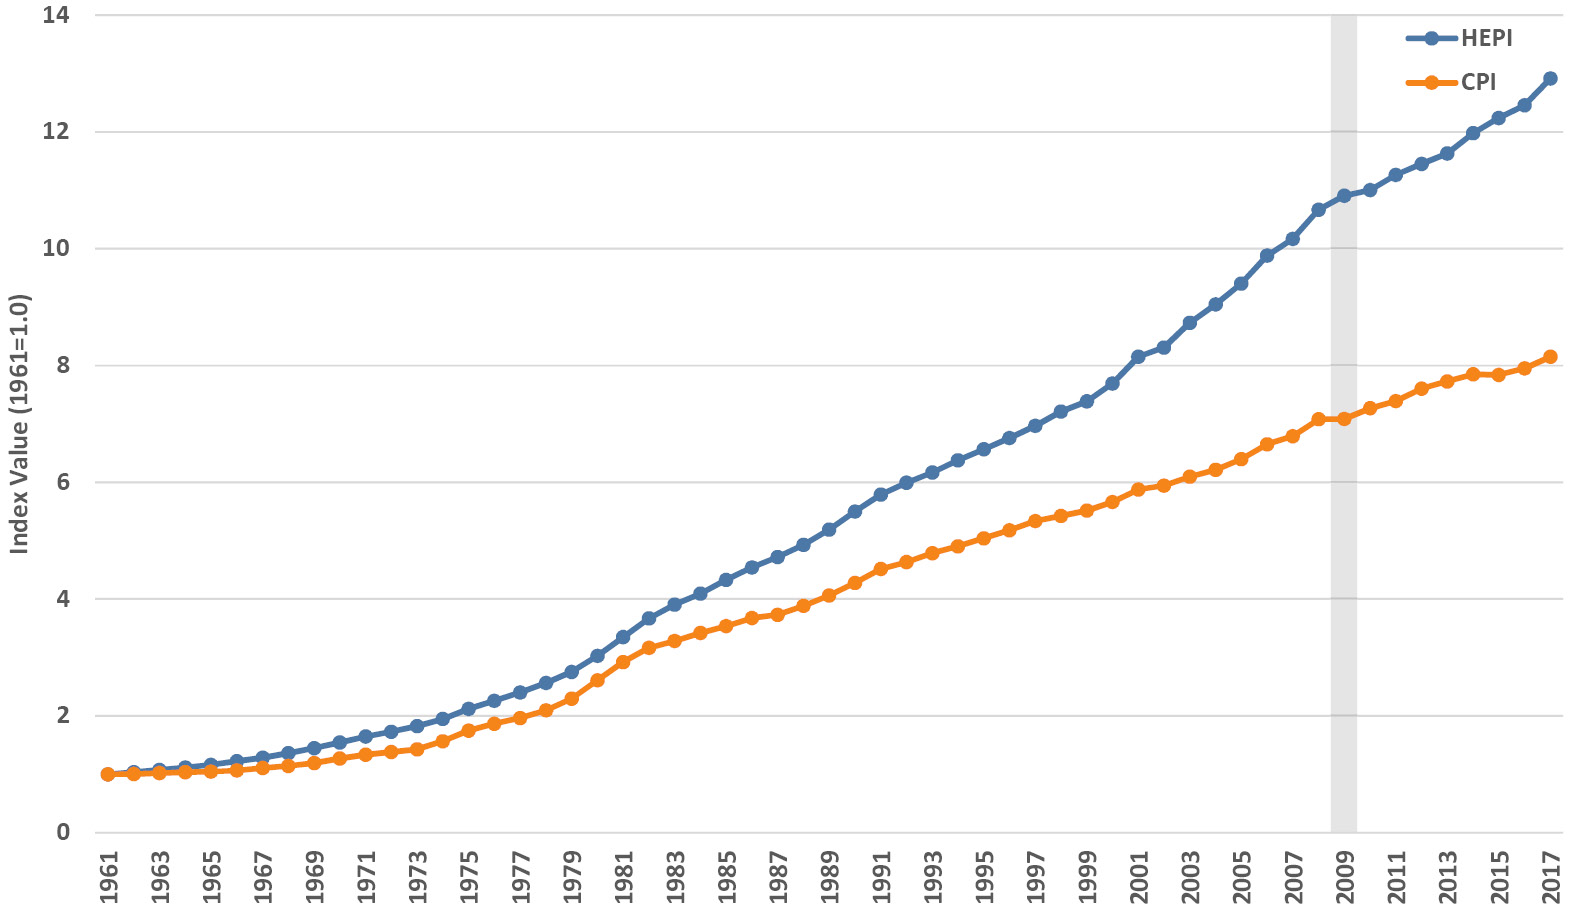
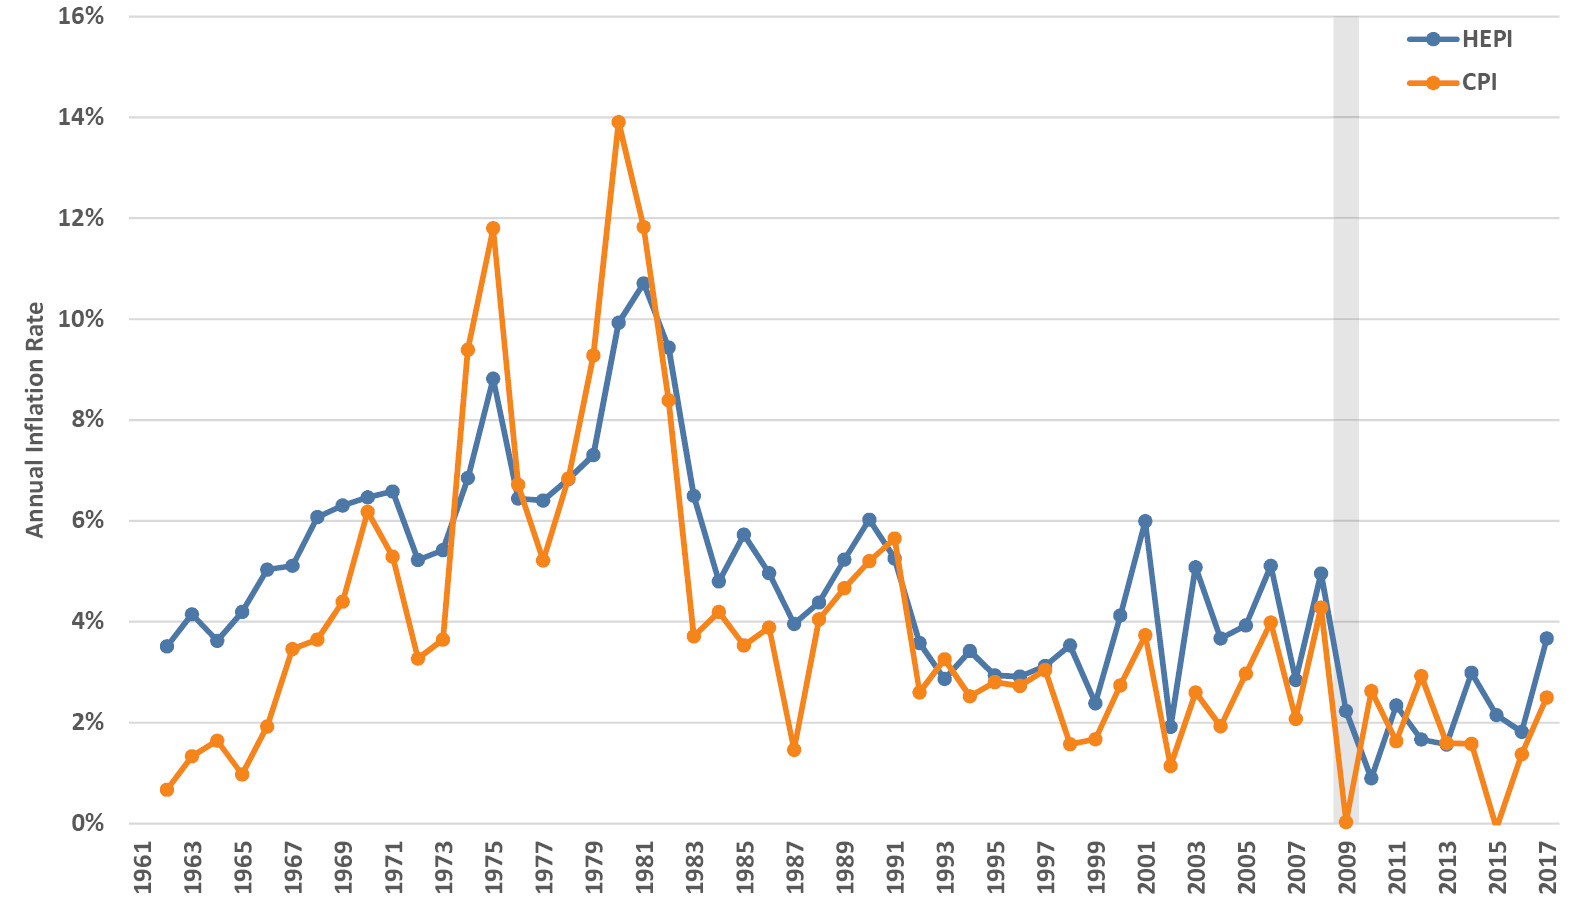
Figure 3.10. Trends in the Higher Education Price Index (HEPI) and Consumer Price Index (CPI) set equal to 1.0 in 1961 (upper panel) and trends in the annual inflation rate for each index (lower panel). Sources: Commonfund Institute (2017a) and BLS (US Bureau of Labor Statistics 2018b).
3.8 What can be done to control costs in higher education?
Many remedies have been suggested to counter the seemingly inexorable cost spiral in higher education. The ones most likely to be effective in the long run are those that address the root causes outlined in Section 3.7 rather than the symptoms (i.e., price), so policies to deal with the escalating costs of college should avoid price controls and focus on cost controls instead (National Commission on the Cost of Higher Education 1998).
Some examples of cost-reduction approaches are shown in Figure 3.11. Suggestions for operational efficiency that target Baumol’s cost disease range from prosaic cost-cutting to provocative change, such as outsourcing food services or rethinking athletics participation (Adams and Shannon 2006). Ideas for competing on outcomes aimed at minimizing the effects of Bowen’s Law focus on minimizing emphasis on reputation and prestige and instead providing meaningful data on instructional outcomes and incentivizing measured teaching quality and productivity (Martin and Gillen 2009).
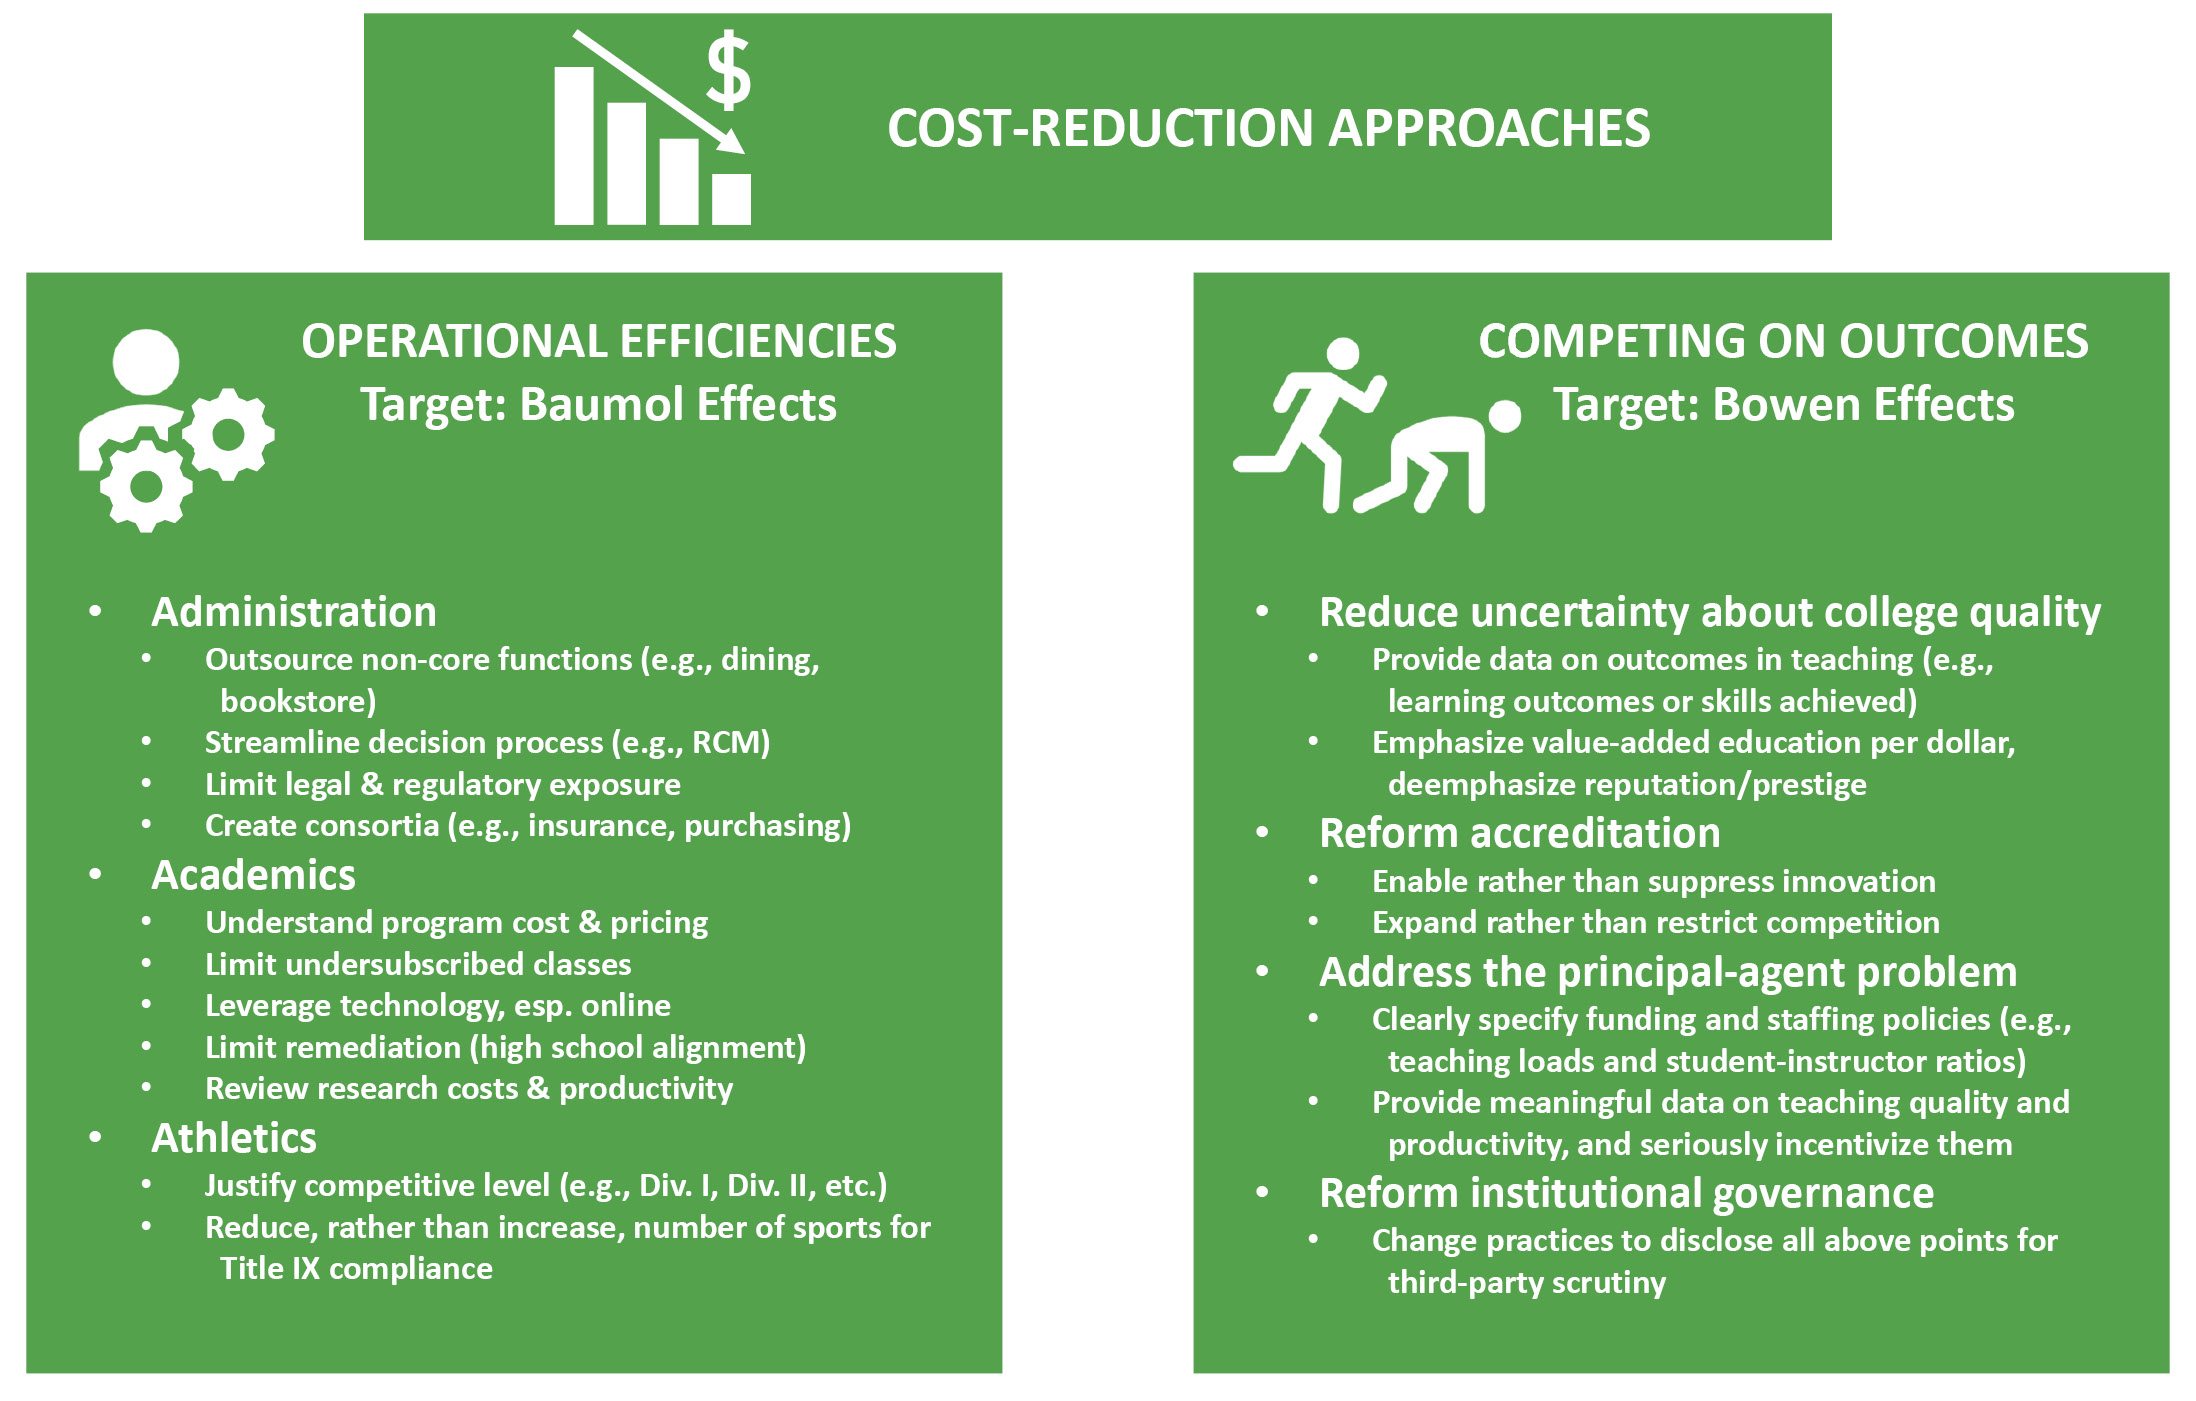
Figure 3.11. Examples of cost-reduction approaches for higher education targeted at Baumol effects (Adams and Shannon 2006) and Bowen effects (Martin and Gillen 2009).
Most institutions strive to be more productive and efficient in providing a quality education at a low price. There are few if any campuses that haven’t implemented operational efficiencies in recent decades, especially since the Great Recession, and one of the most widely-established trends has been the greater use of faculty not on the tenure-track to deliver instruction at lower cost (see Chapter 5). Many campuses have achieved some success in improving retention and graduation rates because of a focus on data, but progress in managing and marketing by outcomes metrics is generally far less advanced than for operational efficiencies. Overall, the most thoughtful suggestions for reducing costs, and those most likely to be adopted in practice, are those that improve quality and enhance competitiveness by creating higher value.
3.9 Does the university make a profit?
No. As nonprofit entities, it would seem self-evident that universities and colleges don’t make a profit (remember, I’ve specifically excluded for-profit institutions from our scope in this book and they are obviously set up to make a profit as their primary goal). And yet, with the myriad activities across a campus, there are inevitably unit-level or institutional surplus funds (or deficits) from year to year, often on purpose, although there are pitfalls if the surplus is too large (Bauman 2019). Informally, in a verbal shorthand, some might refer to such a surplus as a profit, but fortunately we have a precise and more appropriate term for use in the nonprofit sector: margin.
Why is a margin not a profit? They both have the connotation of “extra money left over” after subtracting costs from revenues, but if it isn’t saved for the next year then profit goes to shareholders as cash or to employees as a bonus. A nonprofit has no shareholders and its employees don’t get bonuses in a good year. Instead, nonprofits like universities have a social mission to benefit the public. Whether saved for later use or spent right away, at a nonprofit the margin is invested in the mission.
“No margin, no mission” is an adage that encapsulates the imperative for sound financial management of a nonprofit along with the necessity to grow funds for investing in improving and expanding the social mission. A university that is stagnant or under financial stress cannot do a decent job of serving its students or community. To do those things well, it must generate sufficient resources to deliver quality programs in addition to investing in adaptions and innovations to ensure its future success. In a nutshell, you can do more social good if you have a well-run institution with a margin that can help it continue to achieve and expand its mission (but beware of Bowen’s Law, see Section 3.7).
1 This is a simplified version of the Education and Related (E&R) budget suitable for calculation directly from IPEDS data. It is close, but not identical, to a detailed per-institution E&R calculation that accounts more precisely for small portions of some support costs.
2 Interestingly, Baumol and a different Bowen introduced both ideas together in a 1965 essay (Baumol and Bowen 1965). William Baumol was a leading economist who taught at NYU and Princeton. His co-author was one of his doctoral students, William Bowen, who went on to become president of Princeton and later of the Mellon Foundation. The Bowen in Bowen’s Law is Howard Bowen, also an economist, and he too served as a president, at Grinnell College, the University of Iowa, and Claremont Graduate University.
3 Baumol outlined the theory but credits his economist colleague Alice Vandermeulen from UCLA with coining the term “Baumol’s cost disease” (Baumol 2012).
4 One of the most accessible explanations of the Baumol effect, with data, is a recent report by Helland and Tabarrok (2019).
