9. Public Service, Cooperative Extension, and Community Engagement
© Andrew C. Comrie, CC BY 4.0 https://doi.org/10.11647/OBP.0240.09
9.1 Where’s the land grant money, and how does it fund cooperative extension?
Public service is the third of the three core university mission areas and, relative to teaching and research, it is the least funded. Public service goes by a variety of names, including outreach, community service, community engagement, extension services, and even social impact. The core idea is that a university should be connecting with its community through knowledge in ways that go beyond for-credit instruction and academic scholarship. While the Cooperative Extension Service is the quintessential example of public service in higher education, there are many other forms including performing arts, museums, public lectures, K-12 outreach programs, open libraries, and university presses. All of these have in common that they are principally supported by funds other than those from tuition or research. A few in this set have interesting business dimensions and we’ll examine them in subsequent sections; first, let’s look at the one that started them all, cooperative extension.
The Cooperative Extension Service is a national outreach program that was formalized by the Smith-Lever Act of 1914, mounted in partnership with the land-grant universities that were established with the proceeds from selling designated federal lands (See Box 9.1). Contemporary funding for cooperative extension is complicated: in addition to iterations of land grant acts over a century ago, some with funding and some without, there is associated legislation from 1967, 1972, 1994 and 2008 that added, amended and reorganized which institutions are included and the basis for how much funding they each receive. Some funds are equally allocated to the states, others are based on farm population or total population, and yet others are for specific kinds of land grant activity.
It’s called “cooperative” because the funding was originally split three ways in a cooperation among federal, state and local (county) governments, some requiring a match to the federal funds. These same three revenue sources are still important today, along with grants, contracts, fees and gifts. As a result, every university cooperative extension service has a different amount and mix of revenue (and incidentally there is no national database containing those data). Figure 9.1 illustrates an example university extension budget at a state land grant university. These are R1 or R2 institutions, and all of them are public with just a few exceptions. For this example, we assume a mid-range federal amount of $8M and we assume it is a quarter of the total budget of $32M, also a mid-range estimate. The state appropriation is typically the largest component, and for our example we’ve assumed a 40% share ($12.8M). County shares can be zero or substantial depending on the state, and we’ve assumed a 10% share ($3.2M). Rounding out the remaining 25% of revenue are other types of sources including one-time grants and gifts as well as any fee revenue. These latter sources and a portion of the appropriated federal, state and county funds are restricted funds for targeted projects, so perhaps one half to two thirds of the total budget can be used for unrestricted payroll and operations expenses. For a sense of scale, this unit might have a payroll of several hundred employees spread across the main campus and county extension offices; smaller states might have an extension budget of half or less this size and the biggest states have extension budgets more than double this size.
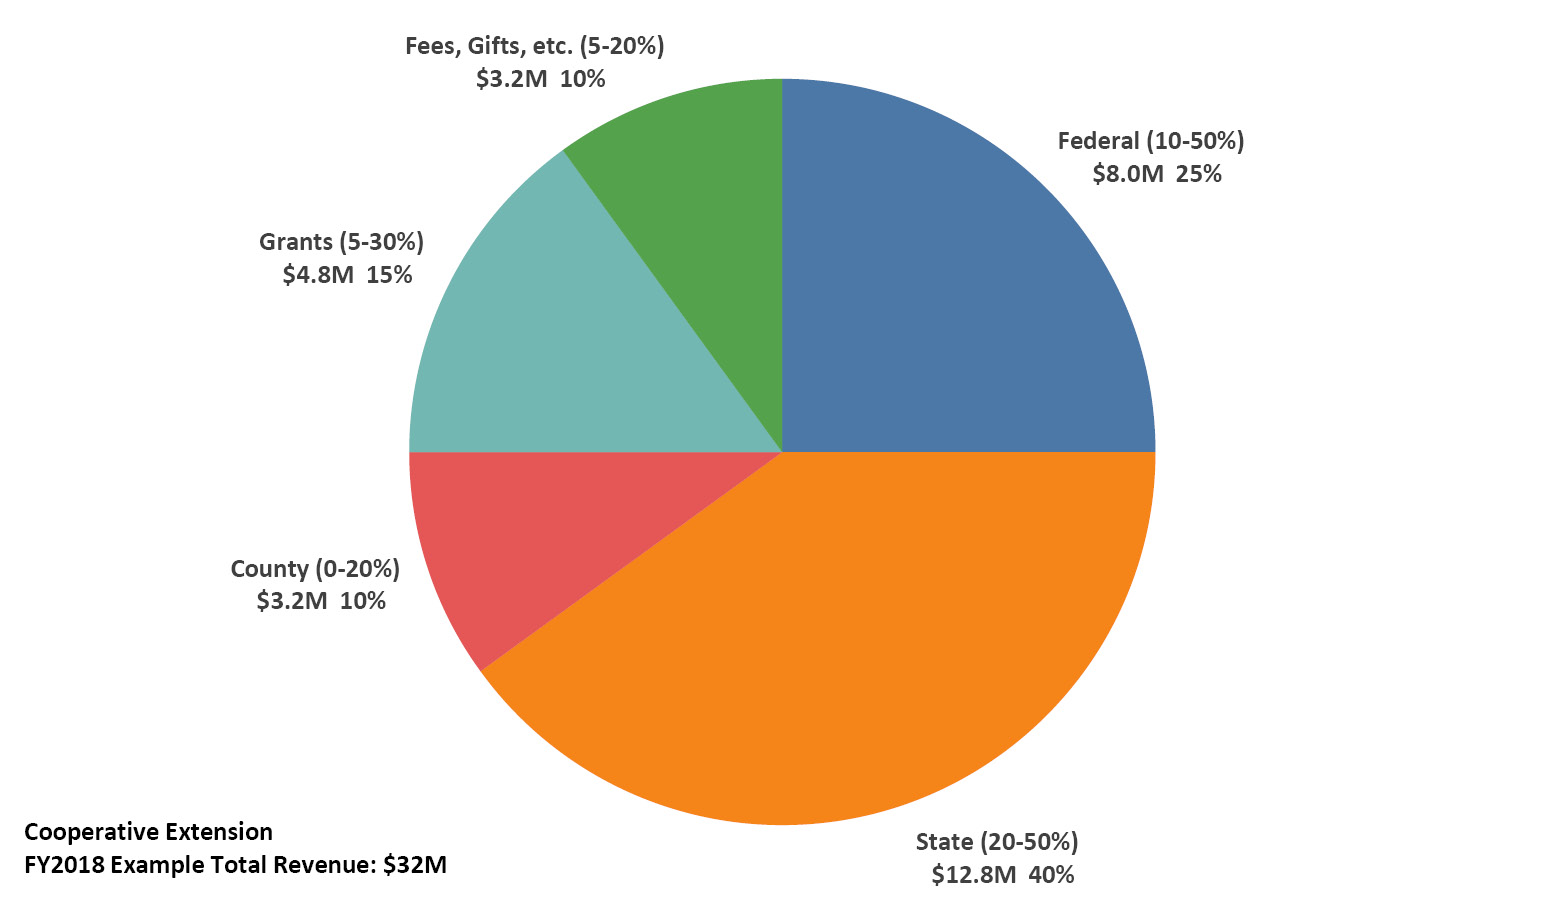
Figure 9.1. Example revenue sources budget for a typical cooperative extension service at a land grant university. Percentage ranges in parentheses are from APLU (Association of Public & Land-Grant Universities 2019).
Recent trends in federal and state funding for cooperative extension are illustrated in Figure 9.2. The US Department of Agriculture (USDA) administers the relevant federal funds to the universities through the National Institute for Food and Agriculture (NIFA) via what were previously known as formula funds (now capacity grants), earmark funds (now special needs), and competitive funds that also include substantial research funding. Federal extension funds total about $550M annually, about two thirds from formula/capacity mechanisms and one third from other mechanisms. While federal support has been roughly flat overall but highly variable (plus/minus 20% or more in several years), both in extension-only funding and in extension plus research (that has a longer record). In contrast, state support for extension underwent a major decline of about one third post-recession. The state to federal extension funding ratio has recently been about 67:33, but historically it was as low as 40:60 in the mid-1930s, about 60:40 in the postwar years through about 1980, and then it ascended to a high of 80:20 in the early 2000s (Wang 2014).
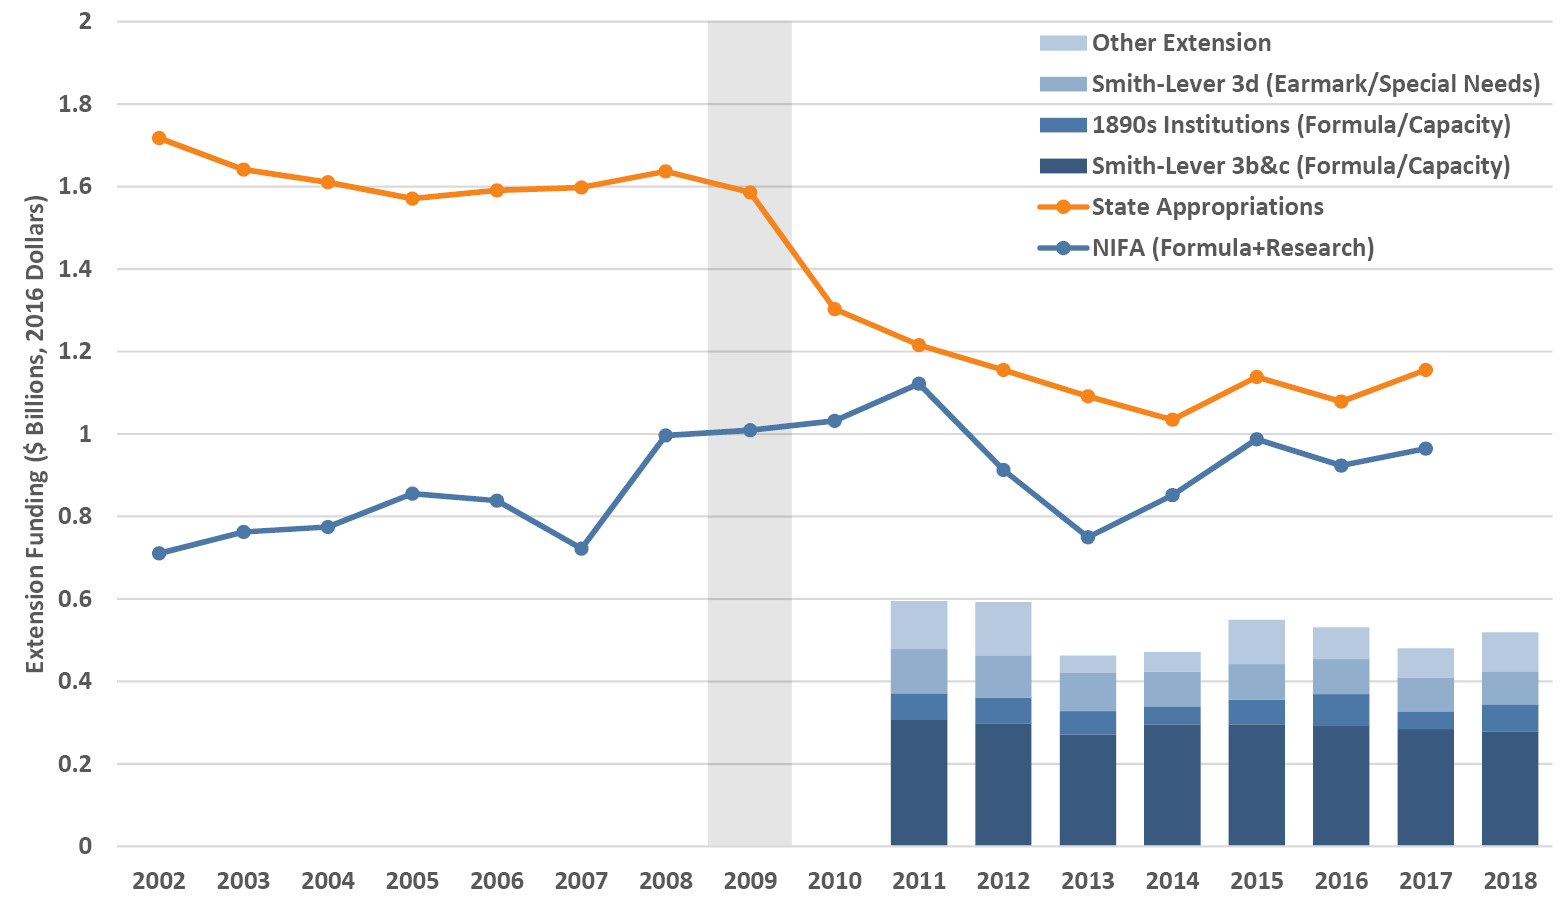
Figure 9.2. Recent trends in federal and state funding for cooperative extension, including funding mechanism (stacked columns) and total expenditures (extension plus research) at the National Institute of Food and Agriculture (NIFA), by fiscal year. Sources: NIFA (National Institute of Food and Agriculture 2019a; 2019b).
9.2 What is the business model for performing arts centers?
Most universities host a performing arts center that, apart from major athletics events, can otherwise be the most visible and visited element of the institution for community members. Campus performing arts venues are often major landmarks of their local cultural landscape, metaphorically and physically. Even in large cities, campus performing arts centers can be part of a vibrant, top-tier arts scene, while in smaller cities and towns they are frequently the leading arts presenter in the community. Bringing the creative and performing arts to the public is as important a public service role as bringing science to the community, especially because performing arts events engage many people who otherwise would be unconnected with the campus. However, public funding for the arts is low and campus performing arts centers must rely on other kinds of funding to carry out their public service mission.
Now, like many other parts of the public service and outreach mission, the performing arts are deeply connected to the teaching and research missions (research being creative activity in this case). If the university has academic programs in music, theatre or dance, those departments may have their own performance spaces, or they may work in a joint arrangement to use the main venue or the combined set of large and smaller venues. The distinction to be made is that, while student concerts, shows and recitals may (and should) be integrated into the programming of a campus performing arts center, to mount a regular season of professional artists the center needs to operate as a separately managed unit with goals and finances and a business model that are distinct from regular academic programs. Furthermore, the business of running an entertainment facility is unfamiliar to many in academic administration, with unique personnel issues, atypical procurement and bidding processes, special contracts, licensing, and large sums of money having to change hands fast (Henley 2016).
It turns out that, of all the business models on a campus, the performing arts center arguably has the most gut-wrenching: every new season is an “if we build it, they will come” exercise in managed risk that puts a large portion of its budget on the line each year, often several years in advance. As a director or lead programmer for a performing arts center, here is your challenge: take half (or more) of your budget; spend it on contracts with a set of artists to create a season portfolio that balances cultural value, cost and anticipated audience; invest in marketing and fundraising; sell tickets; mount the shows successfully, and hope you break even. Rinse and repeat each year, hoping that you make a margin in more years than you incur a loss.
There’s a lot that goes into balancing cultural value, the cost of the act, and likely audience attendance. The acts that make money aren’t necessarily the ones that your (segmented) regular audience wants to see. Broadway blockbusters may fill the house and bring in new patrons, but they are expensive with large casts, sets and crew. There’s more donor support for classical music, ballet and opera but those audiences are often smaller. Exciting new artists emerge from contemporary genres, but it can be hard to sell tickets for lesser-known or avant-garde acts. A popular comedian will attract an audience and needs only a microphone and a spotlight. Aging rock-and-roll groups can bring yet another crowd. Yet, as the presenter, if you slide too far into commercial presenting to pay the bills you risk drifting from your core arts and culture focus and connection to the university, losing your audience and the financial backing of donors and organizations (and possibly the institution). In addition to curating and presenting a season yourself, you can also rent out your facility to third-party promoters of touring Broadway shows, comedy acts or pop groups. Less common, but in keeping with the university connection, you can also produce shows and/or commission new work.
A good executive director and her team will artfully blend all the above with the goal of creating deeper connections with different sectors of the community and the university, building value to drive participation and support (Webb 2016). The unit will do so with a limited financial support from the institution and be expected to generate most of its own revenue; it may report to a dean, vice president, provost or president, or it might be a separately incorporated entity; and, it may be required to provide campus units with facility usage below cost as well as block out times for graduations and other university events (Henley 2016; Brown 2017).
While there is a wide variety of organizational structures and programming arrangements across university performing arts centers, they have core business elements in common that are best illustrated with an example. I’ve provided a model of a typical performing arts center budget in Table 9.1 and in Figure 9.3 to make both detail and relative proportions easier to appreciate. Naturally, the overall budget will scale by the size of the center in each case, and the relative share of each item will shift with programming scope. The proportions presented in the example are based on results from an industry survey (Hager and Pollak 2002), and I’ve assumed dollar amounts that reflect a medium to large contemporary university performing arts center. Also, this is an annual operating budget and it doesn’t include major capital and facilities activities, such as fundraising for a new performance hall or paying for major renovations.
Table 9.1. Example operating budget for a moderate to large university performing arts center. Note that major capital and facilities costs are excluded.
|
Line |
Item |
Amount ($) |
||
|
1. |
Revenues |
|||
|
2. |
Ticket Sales |
2,000,000 |
||
|
3. |
Hall Rentals |
1,000,000 |
||
|
4. |
Gifts |
1,000,000 |
||
|
5. |
Institutional Support |
1,000,000 |
||
|
6. |
Grants |
500,000 |
||
|
7. |
Investment |
300,000 |
||
|
8. |
TOTAL Revenues |
5,800,000 |
||
|
9. |
Expenditures |
|||
|
10. |
Artist salaries, fees, travel |
2,400,000 |
||
|
11. |
Management & General |
1,500,000 |
||
|
12. |
Stage & Production |
700,000 |
||
|
13. |
Marketing |
700,000 |
||
|
14. |
Fundraising |
350,000 |
||
|
15. |
TOTAL Expenditures |
5,650,000 |
||
|
16. |
NET Operating Margin |
150,000 |
||
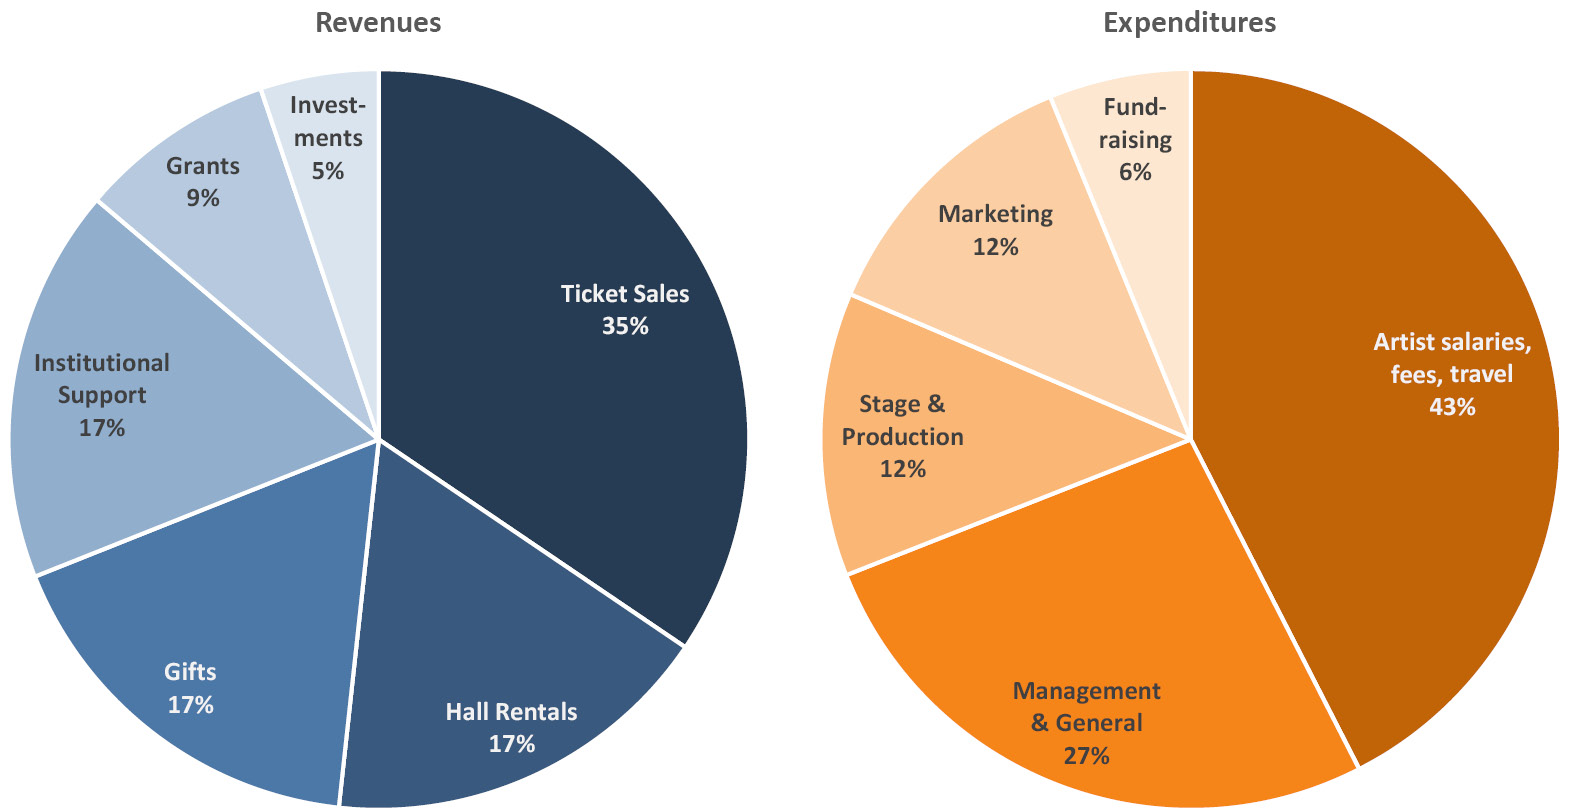
Figure 9.3. Shares of example revenue and expenditure budgets for a moderate to large university performing arts center. Note that major capital and facilities costs are excluded.
We start with revenue sources (line 1), where ticket sales are the single largest item (line 2). They may be rivaled or exceeded by rental revenues from, say, a Broadway promoter (line 3) or rentals may be a minor item, depending on the core business model. Gifts (line 4) are an essential part of the revenue stream, such as for show sponsorships and special programs for patrons or schools. Support from the university (line 5) can also vary substantially by institution, although for most it is a small but enabling and highly-leveraged part of the overall budget. Many centers will apply for grants to support young performers, special outreach, and other initiatives, but these are generally not large and are one-time restricted funds (line 6). Some performing arts centers may be fortunate to have an endowment from when they were established, and/or that they have diligently grown over time. Those investment returns (line 7), because they can be relied upon, are also enabling and leveraged. Looking at total revenues (line 8 and Figure 9.3), we can see that earned income is primarily from ticket sales and rentals and comprises roughly half of all income.
Moving to expenditures in the lower half of the budget (line 9), we see that paying the artists and associated costs (line 10) is the largest expense, approaching half the total and exceeding ticket sale revenue. Management (managers, front of house, accounting, security, etc.), staging and production (back of house including lighting, tech, stagehands, etc.), marketing and fundraising expenses all include labor and supplies; all these areas support the performances as well as operating the venue for other events (lines 11–14). The proportions of total expenditures (line 15 and Figure 9.3) are quite different to most other university unit budgets, where in-house labor costs make up the bulk of expenditures; here, the main budget dynamic is around artist costs and the large revenues from ticket sales required to offset them. Finally, this example has a small net operating margin (line 16), ideally for investment in future activities if it isn’t needed to cover past deficits.
A successful university performing arts center will manage this budget model adroitly, by sharing risk with partners, combining safer and riskier bets across the portfolio of acts and genres discussed earlier, and developing diverse income streams from fundraising and other sources. More importantly, a flourishing performing arts center brings cultural richness to the community, connects it with the campus, and adds broadly to the quality of life by making the city more attractive and livable.
9.3 How are university museums paid for?
Over one quarter of the nation’s art museums are located at colleges and universities (Association of Art Museum Directors 2019). While museums of art constitute the majority of campus museums, some institutions are home to museums of natural history, culture, archaeology, botany, zoology, minerals and more. The functions of a university museum are archival (de facto, they house collections of academically significant objects), scholarly (curatorial staff and faculty study the objects), educational (they are resources for teaching students) and engaging (they serve the broader community). Importantly, they are not simply venues to go and see beautiful or interesting things with a consumer mindset. Ideally, these museums are a vital part of campus and community life, infusing and inspiring young and old with an appreciation of art and science (Cotter 2009). For donors, university museums provide the opportunity for their collections to be seen rather than overshadowed as they might be in major civic museums, and some smaller museums have found that universities can be valuable stabilizing partners (Kiley 2013; Grant 2019). While those in the trade proclaim that “Great Universities Have Great Museums” there are critics who think that campus museums may have gone too far with extravagant commissions and extraordinary exhibits (Urist 2016; The Association of Academic Museums and Galleries 2020).
Museums are typically started and continue to grow through donations (and bequests) to the collection from private or scholarly enthusiasts. The gift of a private art collection or the need to conserve a set of scientific specimens, if of sufficient cultural or academic value, enables the development of a museum while also creating the need to support the people, programs and facilities necessary to run it. Business models for university museums differ widely, but virtually all of them rely on some combination of direct support from the parent institution, endowment proceeds, and philanthropy for the bulk of their support.
Figure 9.4 illustrates the revenue mix for four example university museum budgets: a small museum ($1.5M annual budget) at a public institution; two medium museums ($4M budget), one at a public school and one at a private school; and, a large museum ($20M budget) at an elite private university. Comprehensive data on university museum budgets are not available, but fortunately some campus museums publish their financials in an annual report; these simplified examples are drawn broadly from those reports.1 Small museums are heavily dependent on their parent institutions, which supply about two-thirds of the revenue; gifts and membership are the next largest revenue category at about 20%, while endowment income, grants and earned income are relatively small. Earned income includes admissions, museum store and merchandise proceeds, space rentals, as well as restaurant and catering income (typically only found in larger museums). At medium-sized museums the university allocation comprises about half of the revenue (a bit more at the publics and a bit less at the privates) while endowment income might contribute 10–20% along with several percent each from grants and earned income. The biggest university museums are supported by large endowments and their endowment earnings can be well over half the revenue budget, even exceeding three quarters in some cases.
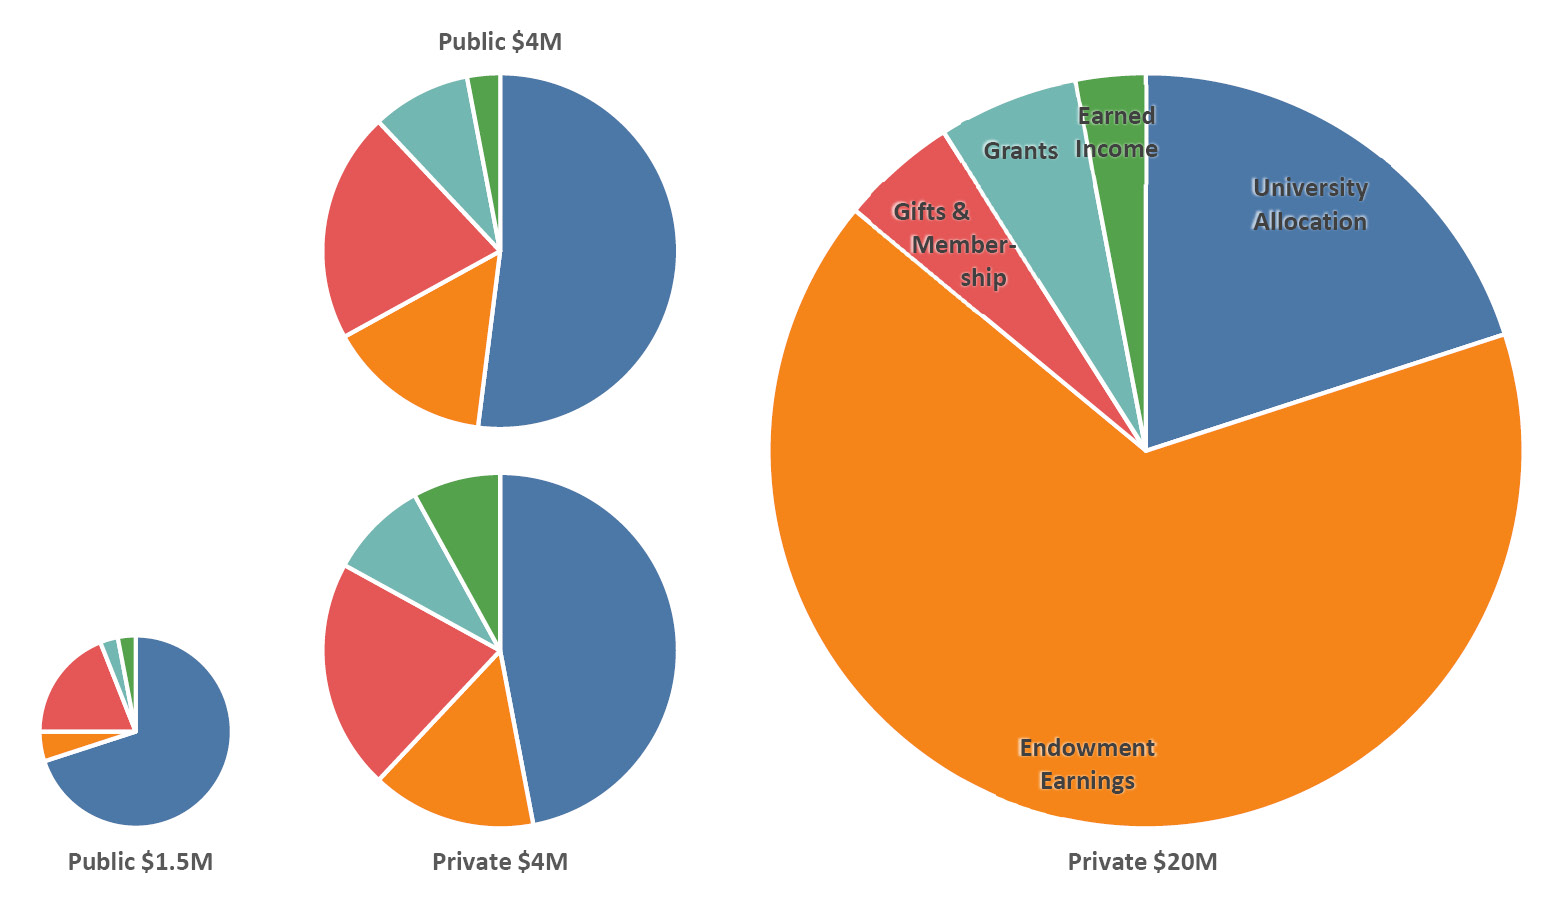
Figure 9.4. Revenue mix for four example university museum budgets. See text for details.
Small museums may see 15,000 to 50,000 visitors per year, while that number can exceed 100,000 at some medium-sized museums and rise over 200,000 at large museums. Virtually all university museums will have thousands of students visiting through classes as well as providing students with part-time paid internships and volunteer opportunities. Such positions serve a critical staffing as well as educational role and may include dozens of students at small museums and over 100 at larger ones. At smaller museums the regular staff may number from less than 10 to more than 20, with 30–40 at medium-sized museums and well over 100 staff at the largest museums.
It’s no surprise that payroll is the largest item in the expense budget of university museums—they are labor-intensive units just like the rest of the university. Curators, assistants, security attendants, conservators, IT staff, financial administrators and managers are all on the staff in addition to the many part-time assistants, not to mention volunteer docents. In Figure 9.5 we can see that personnel expenses range from just over half the budget at large museums to about two thirds at medium-sized museums (a bit more at the publics and a bit less at the privates) to almost three quarters at small museums. Non-personnel spending on collections-related items (exhibitions, acquisitions, education programs, and collections care and conservation) is the next biggest category at 20–30% of the budget, and about 60% of that portion goes to exhibitions. Non-personnel investments in revenue-generating activities such as fundraising development, marketing and communications comprise 4–5% of the budget. Non-personnel expenses in administration, information technology, security, facilities maintenance and other operations round out expenditures, scaling with museum size from 3–8% of the budget. An important note: these budgets exclude utilities and building costs (an additional 10–20%) as these are often covered by the university.
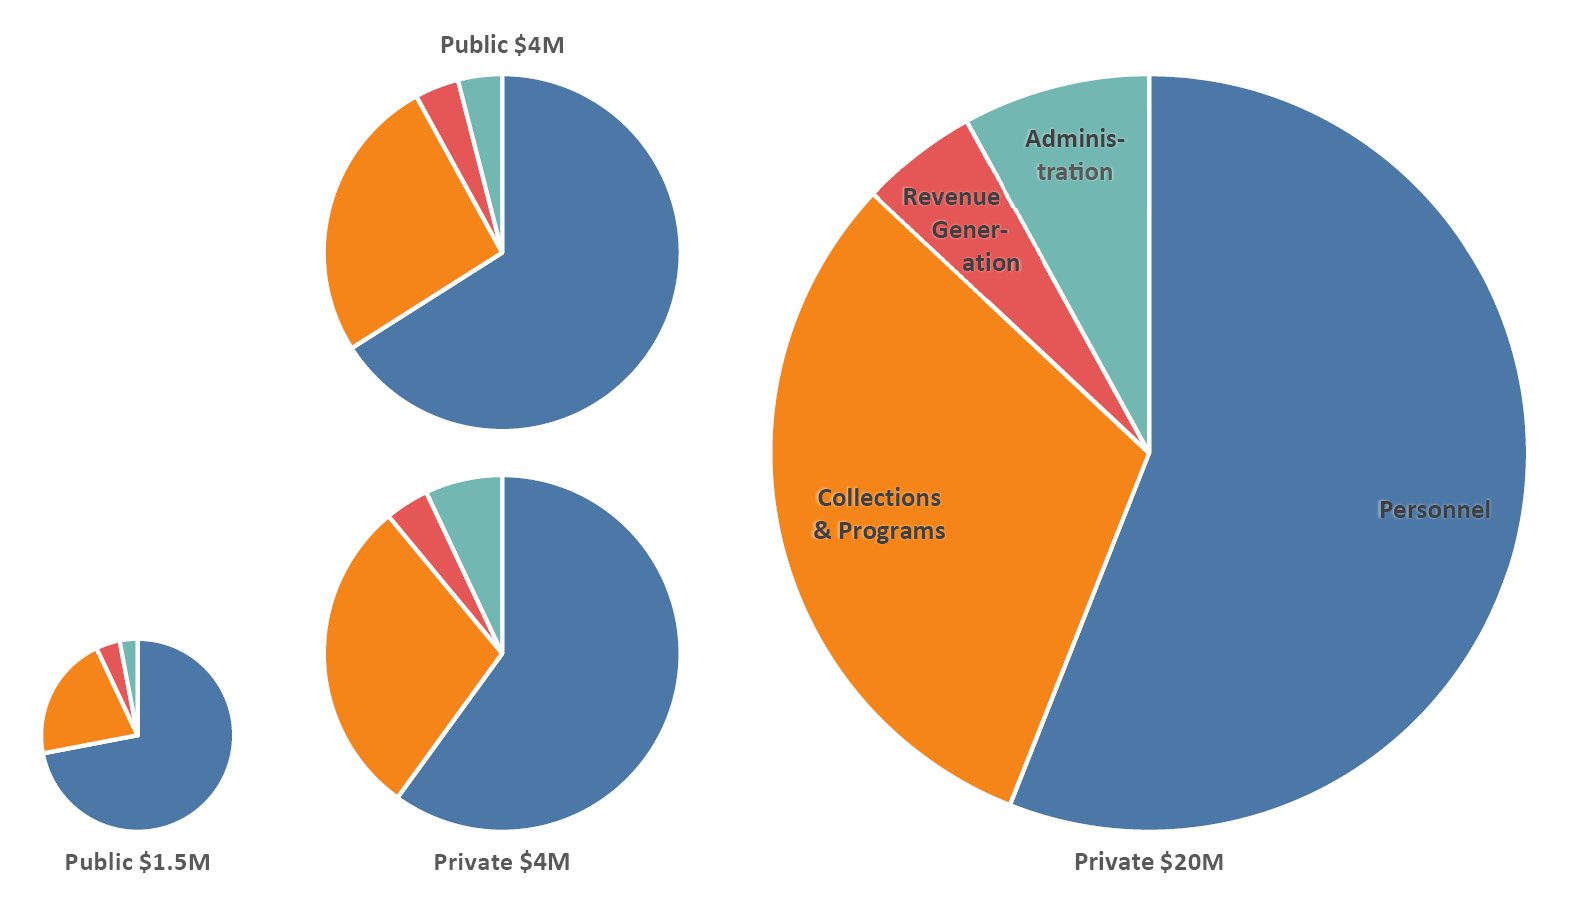
Figure 9.5. Expenditure mix for four example university museum budgets. See text for details.
An illuminating metric used by some museum directors is direct revenue versus overall expenditure per visitor. Average direct revenue per visitor at university museums is low, no more than $2 or $3; many university museums are free to the public, although some special exhibitions may require a fee, and visitors may sometimes spend a little on merchandise. Average expenditure per visitor is many times that amount, in the $50 to $100 range. This is a crude way to reflect monetary value for something that is intrinsically non-financial, yet it underlines the level of commitment that university museums have towards their communities.
A section on university museum finances, particularly art museums, would be incomplete without mention of the ultimate taboo: selling valuable pieces of the collection to pay the bills. There isn’t a single museum that doesn’t endure challenging budgetary conditions from time to time, whether that is a budget cut from the parent university or a drop-off in philanthropic support. There are stories, not all apocryphal, of administrators, board members or politicians suggesting that the director could solve the museum’s financial woes by selling a prominent piece. Here’s one story:
I was invited for a dinner at the president’s house… the trustees are all kind of bantering around and one of them sort of grabbed me and said, “Well you could sell your Picasso and solve all your financial problems. That would be a good solution, wouldn’t it?” And I said, “Would you fire your only Nobel laureate to have a bunch of teaching assistants?” (Glesne 2012, 22)
The most notable recent example was the 2009 recession-induced attempt by Brandeis University to close its Rose Art Museum and sell off the collection. The decision was later reversed following an uproar from the broader art community, alumni and faculty members and an accompanying lawsuit (Shea 2011). The Brandeis case also illustrates two important points: (i) the university broke the trust placed in it to look after the donated items, and (ii) many such donations build in a failsafe that stipulates the piece or collection cannot be sold, or that it will revert to the donor if the institution does not have sufficient funds to care for it and share it with the public (Glesne 2012).
9.4 How is a university press supported?
This chapter is about the university’s public service mission and you may be wondering why a section on the university press fits here rather than, say, with libraries in the academic affairs chapter. While a university press is run by the university, it serves the broader academy (i.e., scholars at other universities) and to an extent the general public. Perhaps surprisingly, university presses have little direct connection to teaching and research on their own campuses, and instead they succeed and serve their role by publishing authors from many other institutions, often in specialty areas particular to each press. The imperative to spread knowledge beyond the confines of campus was recognized from the beginning: “It is one of the noblest duties of a university to advance knowledge, and to diffuse it not merely among those who can attend the daily lectures—but far and wide.” So proclaimed Daniel Coit Gilman, who founded Johns Hopkins University and who, just two years later in 1878, started what is now the oldest continually operating university press in the country (Givler 2002). He and many of his peers at other universities around that time also appreciated that specialized scholarly research would not see the light of day if left to the commercial presses (Givler 2002).
There are nearly 100 US university presses that both belong to the Association of University Presses and appear in our dataset of four-year colleges and universities (Figure 9.6). Except for a small number that publish through a consortium, these presses bear the moniker of the principal institution (rather than branch campuses) and serve as its scholarly publishing arm. The substantial majority are at R1 institutions, about 60% of which have a press. There are a handful at R2 schools, public and private, plus a further handful at the smaller private campuses.
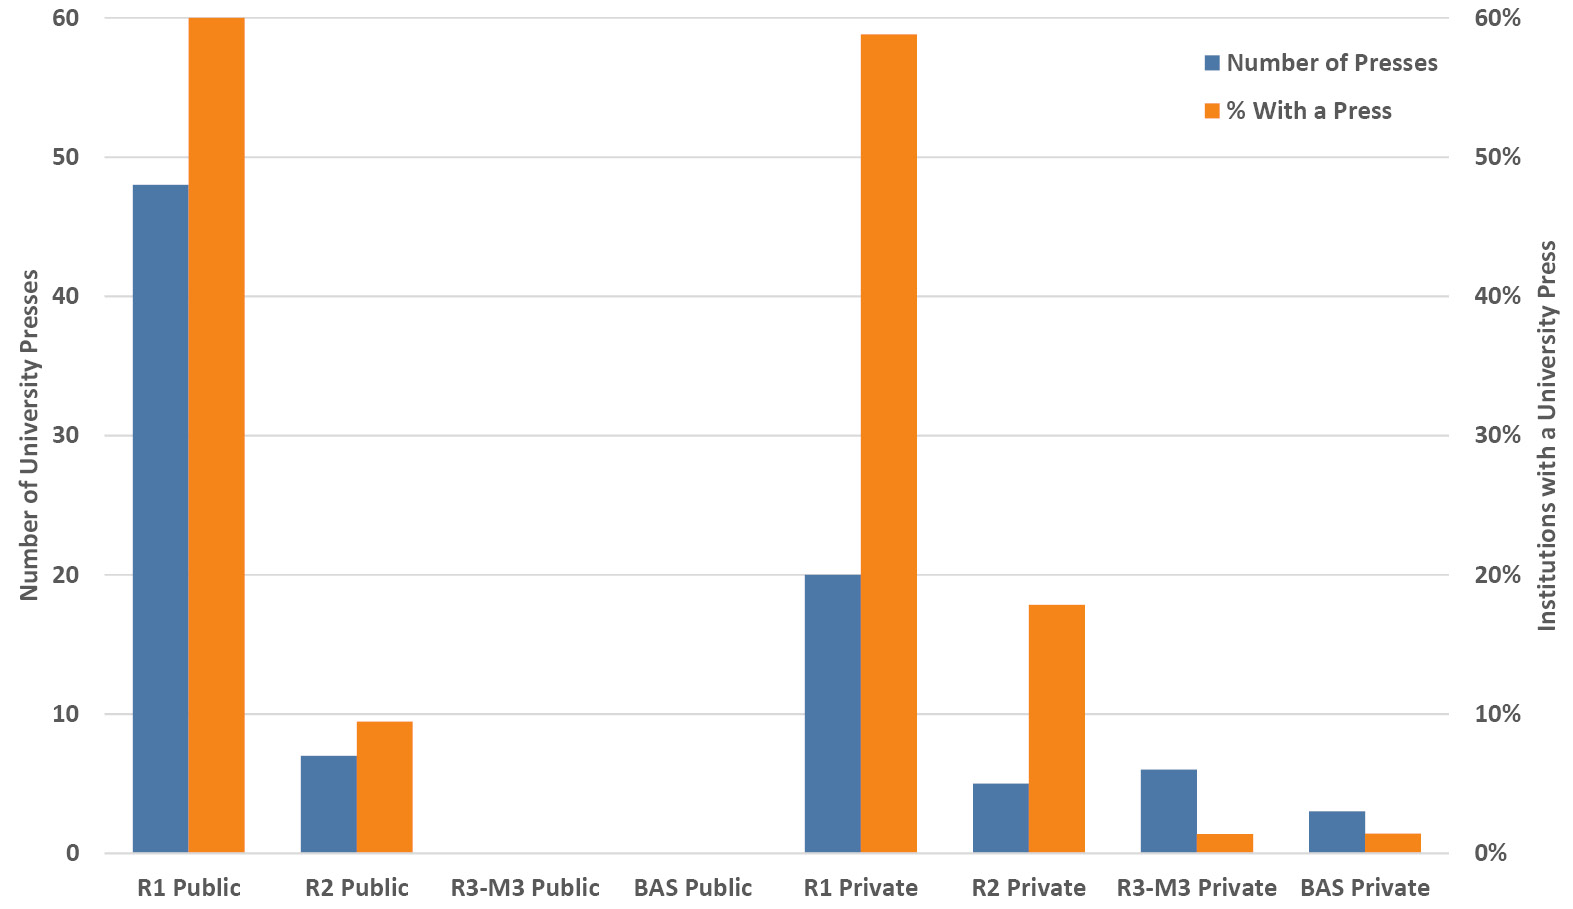
Figure 9.6. Number of university presses and percentage of institutions with a university press, by Carnegie classification and control. Sources: Association of University Presses (2019) and IPEDS (2020).
As nonprofit entities, university presses benefit from non-commercial mailing rates and, importantly, their inventories are not subject to tax—nonetheless, they are subject to the other business challenges faced by all publishers (Givler 2002). The bulk of university press net revenue is generated from book sales, over three quarters on average, as seen in Figure 9.7. While book sales include a portfolio of activity such as edited volumes, textbooks, reprints, and translations, the quintessential university press book is the monograph: one that is written by one or more scholars and that is expected to be read predominantly by other scholars (Maron et al. 2016). Institutional allocations (i.e., university subsidies) average about 10% of press net income, with successively smaller shares from endowment income, journal publishing, other services, and grants and title subsidies (from authors and their institutions). Sales to university libraries have historically been a cornerstone of this market (although that is changing, as we saw in Section 6.13); while print and e-book sales dominate these revenues at most US university presses,2 it is worth noting that scholarly journals constitute nearly half or more of library sales at a few of the very largest university presses such as Chicago, Duke, and the University of California (Daniel et al. 2019).
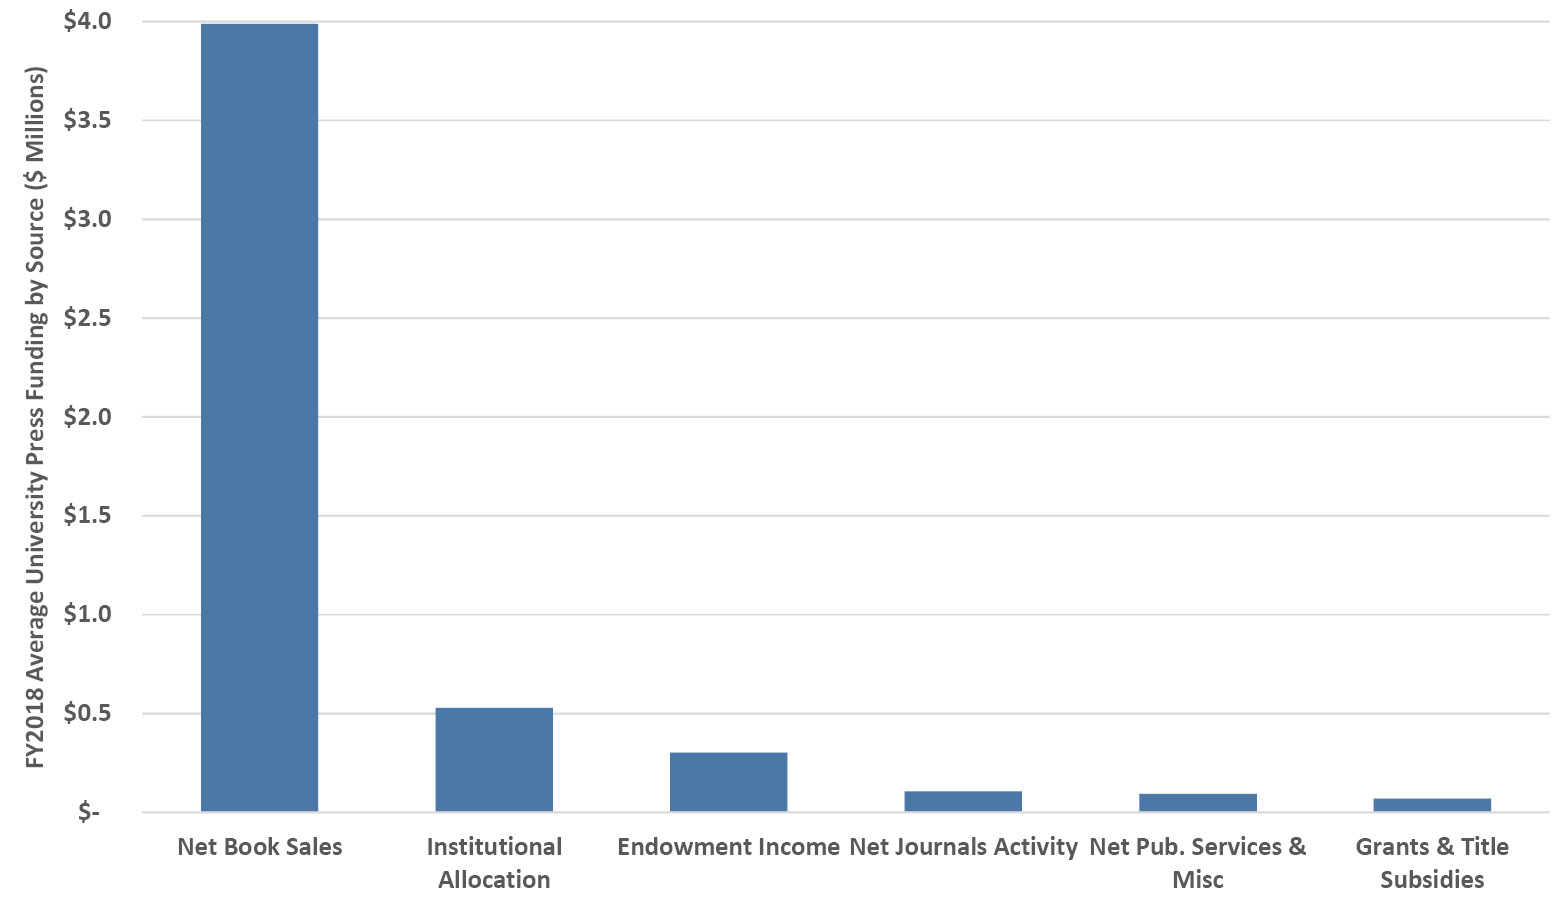
Figure 9.7. FY2018 sources of university press funding. Source: AUP (Association of University Presses 2019).
It’s useful to understand university press expenditures by examining costs per monograph, which total nearly $30,000 in directly attributable expenses and over $40,000 when full costs are accounted for (Maron et al. 2016). Figure 9.8 shows a breakout of staff and non-staff costs per monograph for the five core press departments from acquisitions through editorial, production, design and marketing, as well as for other general and administrative costs. Acquisitions are the most expensive part of the process in labor and total cost terms. This is where the intellectual qualities of the press’s book list are shaped, and it includes author recruitment, topical expertise in selection, communication, and managing a thorough peer review process. Despite the switch to digital copy and the automation of some parts of production, the majority of expenditures in other parts of the process are also on labor. This is true even for general and administrative costs that include staff in accounting and information technology (Maron et al. 2016). Considering that monographs on obscure topics in small fields may sell only a few hundred copies and more popular titles might do more than a thousand (Berlatsky 2014; Barclay 2015; Straumsheim 2016), the margins are small overall. To ensure financial sustainability of their university presses, astute directors and editors are continually seeking the balance between their curatorial role and hoped-for prestige, the relevance and likely popularity of book topics, and the realities of their business model.
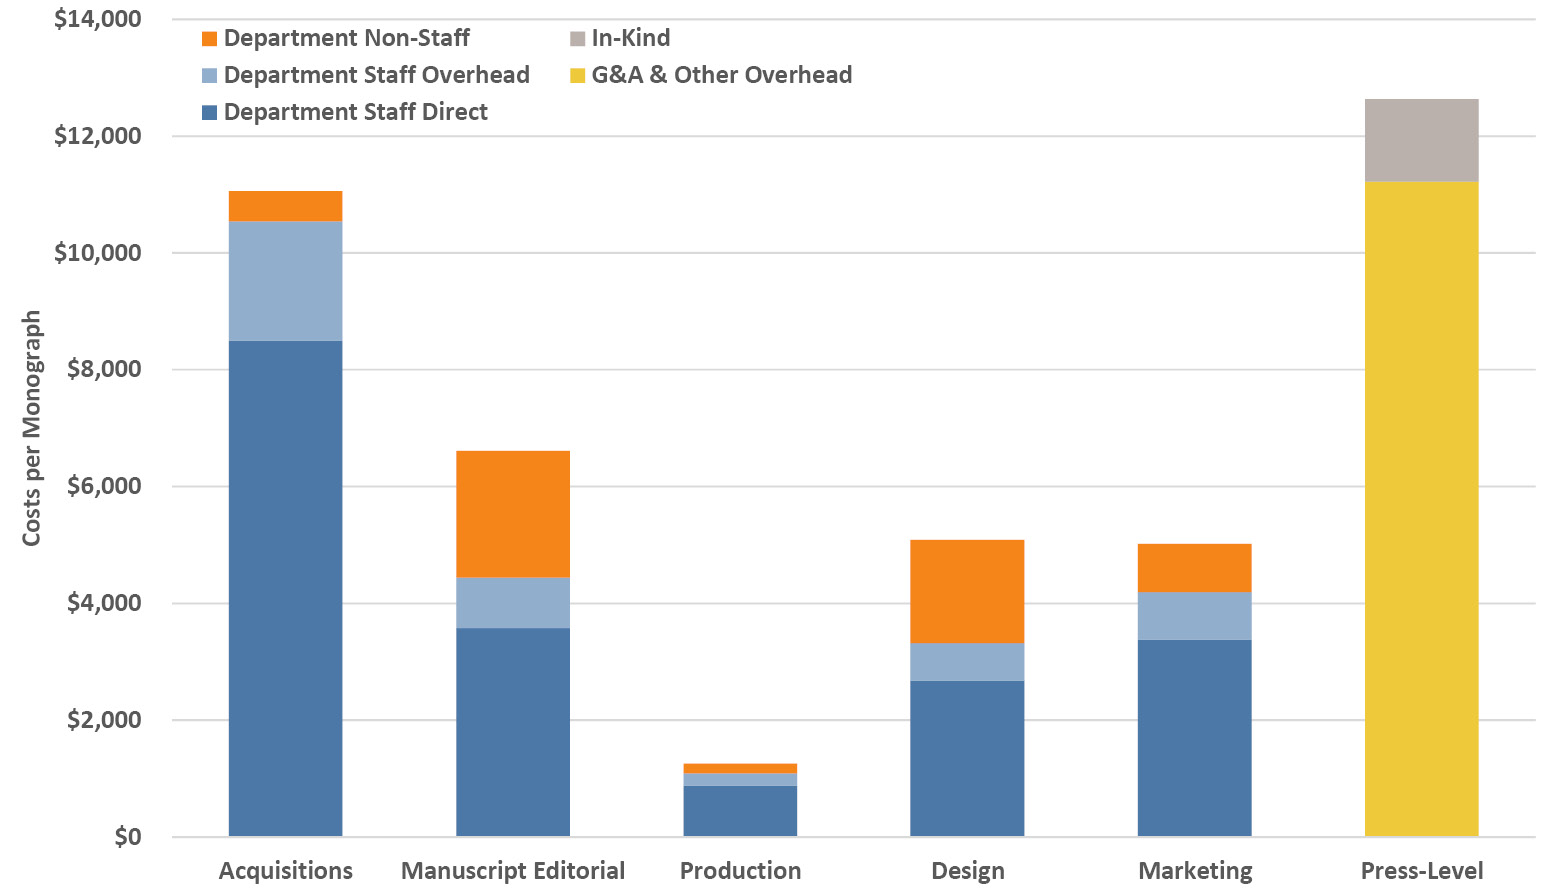
Figure 9.8. FY2014 average staff and non-staff costs per monograph by core department, as well as general and administrative (G&A) costs, other overhead costs, and in-kind costs (e.g., contributed staff time, author-paid fees and office space) at the press level. Source: Ithaka S+R (Maron et al. 2016).
That business model is shifting too, with reductions in library purchases, multiple distribution models including print and electronic forms, and the advent of open access (Maron et al. 2016). In the latter, much wider readership is possible with a low or zero cost to the reader in electronic form and payment for print-on-demand as a conventional paper book; the difference is that the press must cover its costs via other funding sources (e.g., the author or the author’s institution, grants, crowdfunding, institutional support).
As we saw above, those costs amount to tens of thousands of dollars at conventional university presses—can they survive with such a high cost structure, and will university libraries and individuals continue to pay a premium for that model when lower-cost and alternative business models are becoming available? A quick online search reveals a convenient lower-end cost benchmark: the basic cost of self-publishing a book with a quality of editing, cover design, formatting and marketing comparable to a press-produced book is on the order of $6,000 (Reedsy 2020). Most university press editors wouldn’t let me finish that last sentence without interjecting, rightly, that their presses offer far more than those basic services in the academic and production quality of their books (e.g., peer review, an established platform, the stamp of authority from a prestigious press, technical editing and production, targeted marketing). Still, the potential to expand reader access and lower cost structure by implementing business models that are not sales-based continues to drive the development of open access publishing in academia. Book production costs at presses created specifically to produce open access material are typically under $10,000, while they are $15,000 and more at existing presses that have started open access imprints and consortia (Willey 2019; Champion 2020; Luminos 2020; Penier et al. 2020). Such entities can lower their costs through labor savings due to technology and leaner approaches to, for example, acquisitions. It’s important to appreciate that open access books are not necessarily cheaper to produce—the different underlying business philosophy and necessary associated infrastructure are what distinguish it from sales-driven publication (Grimme and Watkinson 2020).3
Open access is still evolving, and there are multiple business models in the ecosystem (Speicher et al. 2018) that are often combined in practice:
- Article/book processing charges: the dominant model, in which upfront fees are paid by the author (or the author’s institution) to offset a portion of the publishing costs, that vary considerably by publisher;
- Collaboration/coalition: organizations and institutions combine assets (e.g., technical skills, funding sources) to support open access;
- Community: some academic-led presses use volunteers from their intellectual community, not only for peer review, but also for editing and other tasks;
- Endowment: endowment income can support open access as well as regular publishing;
- Freemium: a model adapted from the software world, whereby an online version of the publication is provided for free while other formats (e.g., e-reader, regular print) are available for a charge;
- Grants: some foundations will support projects to make publications open access, or support open access costs within a research project;
- Institutional: the university may include support for open access as part of the institutional support for its university press;
- Library funding: libraries may participate in a contribution arrangement with publishers to ensure open access to certain kinds of publications, such as in the arts, humanities and social sciences;
- Sales revenues: the press may sell print copies and other formats while also running an open access imprint;
- Services revenues: in addition to their regular publishing activities, some presses offer publishing services to other institutions.
As can be seen, libraries are active in this space, as are academic and professional societies, and also academic-led presses. Interestingly, open access is in many ways further developed in Europe and the UK than in the US, and it continues to develop actively at presses both small and large on both sides of the Atlantic.
Shifting back to other business model issues, another concern is the university allocation, the most visible recent example being that of Stanford University Press, where the institution proposed and subsequently delayed eliminating the press’s $1.7M bridging allocation, relative to its $5M in book sales (Kafka 2019). Some on campus expressed dismay at the full financial sustainability argument, noting it isn’t applied to athletics, while the wider university press community were alarmed at the potential domino-effect of such a decision at a well-endowed institution (Jaschik 2019b). Yet further business model concerns for university presses include the decline in long-form reading, shifting scholarly modes of writing and communication, and of course the implications of the evolving digital revolution in print and online media.
1 Acknowledgements to the David Owsley Museum of Art at Ball State University, the Stanley Museum of Art at the University of Iowa, the McClung Museum of Natural History & Culture at the University of Tennessee-Knoxville, the Jordan Schnitzer Museum of Art at the University of Oregon, the Spencer Museum of Art at the University of Kansas, the Block Museum of Art at Northwestern University, the Nasher Museum of Art at Duke University, the Princeton University Art Museum, and the Museum of Comparative Zoology at Harvard University.
2 Oxford University Press (OUP) and Cambridge University Press dominate the overall academic press landscape. In a recent study of US university library purchases, each of the two British presses has book sales that approach ten times those of the biggest US university presses. Together OUP and Cambridge book sales to US university libraries represent 77% of all US university press book sales combined and 11% of total book sales from all publishers to university libraries (Daniel et al. 2019).
3 Full disclosure: this book is published under an open access model. In this particular case, the born-open and born-digital approaches meant that including roughly 200 color figures did not greatly affect the sales or production costs. In contrast, many of the university presses that I approached shied away from that much color and the prohibitive cost. It seems anachronistic to be limited to the legacy of almost 600-year-old black and white printing technology as we enter the third decade of the twenty-first century.