
19. Evolutionary Demography of the
Great Apes
© 2024 Melissa Emery Thompson and Kristin Sabbi, CC BY 4.0 https://doi.org/10.11647/OBP.0251.19
The living hominids share a suite of life history features that distinguishes them from other primates, including larger body size, extended juvenile growth and development, and a long lifespan. While modern humans exhibit many distinctions from their great ape relatives, these species provide an important reference by which to infer the life history characteristics of our last common ancestor. Demographic analysis of the great apes reveals specifically how life histories changed during recent human evolution and can provide perspective on inter- and intra-specific variation in life history features. In this chapter, we provide the most detailed information available on demographic characteristics of great apes, comparisons with humans, and discussion of the proximate factors that influence life history variation across the clade.
Introduction
Human life histories are extraordinary in many respects. Even in the poorest of conditions, we are capable of substantially longer lifespans compared with any other primates. Humans have slow growth rates and long periods of infant dependency, followed by prolonged juvenile and adolescent periods. Women reliably experience menopause and a prolonged post-reproductive lifespan, traits that are rare or insignificant in other primates. While weaning ages and interbirth intervals in humans are broadly consistent with allometric relationships to maternal weight across primates, they are substantially shorter than would be predicted from infant development (Harvey and Clutton-Brock 1985; Watts and Pusey 1993; Dettwyler 1995; Kennedy 2005) and much shorter than in other great apes, despite similarities in body mass and elevated costs of brain growth.
Part of our understanding of the origins of human life history requires examining our unique and recent evolutionary history, but a necessary step must come from recognizing our deeper evolutionary roots as primates and as hominids, taxa that evolved slower life history patterns than their ancestors (Charnov and Berrigan 1993). The hominid clade, comprising humans and other great apes, is arguably best defined by virtue of its life history features. A common ancestor of hominids experienced selection for a larger body, increased relative brain size and complexity, a longer lifespan, and an extended period of offspring dependency and juvenile development compared with its progenitors. These features are retained in the living great apes (hereafter, understood to refer to “non-human great apes”): 7 species comprising Sumatran orangutans (Pongo abelii), Bornean orangutans (P. pygmaeus), Tapanuli orangutans (P. tapanuliensis, recently identified), eastern gorillas (Gorilla beringei), western gorillas (G. gorilla), common chimpanzees (Pan troglodytes), and bonobos (Pan paniscus). These species exemplify, in essence, multiple copies of a common template on which human life history evolved. This allows us to study the factors that can produce variation in life history features within and between species that have similar biology, uncovering potential pathways upon which human traits could have evolved. For example, if we want to know why our species can live for 100+ years, we must first ask how our closest relatives achieved long lifespans and what factors constrain them to 50–60 years.
A valuable feature of using great apes as a referent is that they retain the shared, derived slow life history complex despite having diverged into markedly different foraging environments and having evolved radically different social systems. All great apes, to a certain extent, use a complex diet and seem to prefer fruit — a high-quality, unevenly-distributed resource — when they can get it. All exhibit some social flexibility to minimize the costs of grouping when food is scarce, best exemplified by the fission-fusion organization of chimpanzees and bonobos. However, orangutans contend with radically fluctuating habitats, forcing them to weather periods of extreme food shortage (Knott 2005; Harrison, Morrogh-Bernard, and Chivers 2010; Vogel et al. 2012). They exhibit commensurate adaptations, such as enhanced fat storage, delayed male secondary sexual development, semi-solitary foraging behaviour, and extraordinarily slow metabolic rates (van Schaik 1999; Utami Atmoko and van Hooff 2004; Pontzer et al. 2010). Gorillas display adaptations for processing the large amounts of herbaceous material available in their habitats, effectively buffering both spatial and temporal variation in fruit availability (Remis 2003). At the extreme, mountain gorillas living in the Virunga Mountains can subsist with almost no fruit in their diet (Harrison and Marshall 2011).
While the utility of contextualizing human demographic features with primate data has long been recognized, high-quality data have been scarce, particularly for the great apes. The most prominent reference datasets on primate life history (e.g., Harvey and Clutton-Brock 1985; Smith and Jungers 1997; Leigh 2001), which continue to yield important analyses, incorporate small samples derived primarily from captivity. Captive data have a number of drawbacks, the most obvious of which is the influence of improved nutrition and medical care on features such as growth, reproductive rate, and mortality. Reproductive data are particularly fraught, due to contraceptive measures, separation of mothers and infants, and group management decisions that affect breeding opportunities. These practices are often applied intermittently (e.g., contraception only for certain individuals or at certain times), non-randomly (e.g., selection for breeding of certain individuals), and with poor documentation. Captive data are valuable for understanding the limits of variation within each species, by comparing them to wild data. Such comparisons have some less well-recognized problems. For example, all gorillas in captivity are lowland gorillas, overwhelmingly of the western species (Nsubuga et al. 2010), while data from the wild come primarily from one population of mountain gorillas, which lives at an extreme of gorilla habitat variation. Similarly, the vast majority of founder chimpanzees in captivity (along with most museum specimens) were caught in West Africa, and thus represent the subspecies Pan troglodytes verus (Ely et al. 2005), while the majority of wild demographic data are being generated by East African sites comprising P.t. schweinfurthii. To the extent that data on other subspecies are available, it is difficult to evaluate whether variation is due to true taxonomic differences or to phenotypic plasticity in response to local environments. Wild data also have their limitations. For example, ages of many individuals are estimated, particularly for the dispersing sex. Limiting analyses to individuals with well-known ages can also impose bias, if the excluded individuals pursue specific strategies that might alter life history events (e.g., transient male orangutans). Nevertheless, great ape research in the wild has reached a point where there are a number of high-quality longitudinal demographic datasets, in many cases representing multiple populations within species. In our discussion, we focus on these wild datasets as much as possible, referring only to captive data where they are the only data available or where they can provide meaningful insights on the range of variation.
Just as the sparsity of demographic data on great apes has constrained comparative analyses, the desire to conduct such analyses has led to the overzealous use of very limited demographic datasets. Thus, this chapter is as much about how to interpret the great ape demographic data as it is about the data themselves. Are datasets comprehensive enough to make conclusions about species differences? What sources of bias occur in great ape demography, and how important are they in different datasets? How can we best apply comparisons to human demography? Our goal is to emphasize what conclusions about interspecific variability, and the sources of that variation, can reasonably be made and what further data might be needed to address outstanding questions.
Mortality
Understanding how humans came to be so long-lived necessitates considering the evolutionary backdrop of long lifespans in our sister hominids. As a group, these species have notably lower adult mortality rates than do other primates, likely an essential precondition for slow growth, large body sizes, and other aspects of a “slow” life history (Charnov and Berrigan 1993). Great ape lifespans are so long that even the most intensively studied wild populations have not been studied long enough to capture the maximum lifespan. Several chimpanzees, all females, from the Kibale Forest in Uganda are estimated to have lived into their 60s, though their exact ages are uncertain (Hill et al. 2001; Muller and Wrangham 2014; Wood et al. 2017). Two captive chimpanzees, Cheeta (of Tarzan fame) and Little Mama (Lion Country Safari Park), are estimated to have lived nearly 80 years, but their original provenances are controversial. It can generally be concluded that only a small fraction of great apes survive past the age of 50, though they appear to be capable of exceeding 60 years in exceptional circumstances. In most wild populations, life expectancy of females exceeds that of males.
A summary of mortality data from wild populations is provided in Table 1 and Figure 1. Despite their long lifespans, wild great apes do not have reduced early life mortality compared to other primate species (Bronikowski et al. 2011). Infant mortality rates during the first year of life range from less than 10% in some populations of orangutans, western gorillas, and bonobos, to 20% or higher in some populations of chimpanzees and eastern gorillas. Infanticide plays a role in this difference, as it is more common in the latter species than in the former; orangutans and bonobos have never been reported to commit infanticide in the wild. However, infanticide is an insufficient explanation as it affects about 5.5% of mountain gorilla infants born (Robbins et al. 2013) and somewhat fewer chimpanzees (Wrangham, Wilson, and Muller 2006; Wood et al. 2017) [n.b. in both species, rates are highly variable over time, even within populations]. In Grauer’s gorillas at Kahuzi-Biega, rates of first-year mortality are estimated at 20% despite a rarity of infanticide (Yamagiwa et al. 2012). Mortality rates decline after the first year in all populations studied except for the Taï community of West African chimpanzees, which has been affected by periods of high infant and juvenile mortality from leopard predation and the Ebola virus (Boesch and Boesch-Achermann 2000). Thus, while human mortality in the first year of life falls within the range of other great apes, the rate of human survival to adulthood is considerably higher. Anywhere from 25% to over 80% of great apes in wild populations die before reaching reproductive maturity. This high sensitivity of survival in early life is particularly important for population viability and of critical concern given that many of the long-term study groups that have yielded demographic data are assumed to be relatively protected from conservation threats compared to nearby groups/populations.
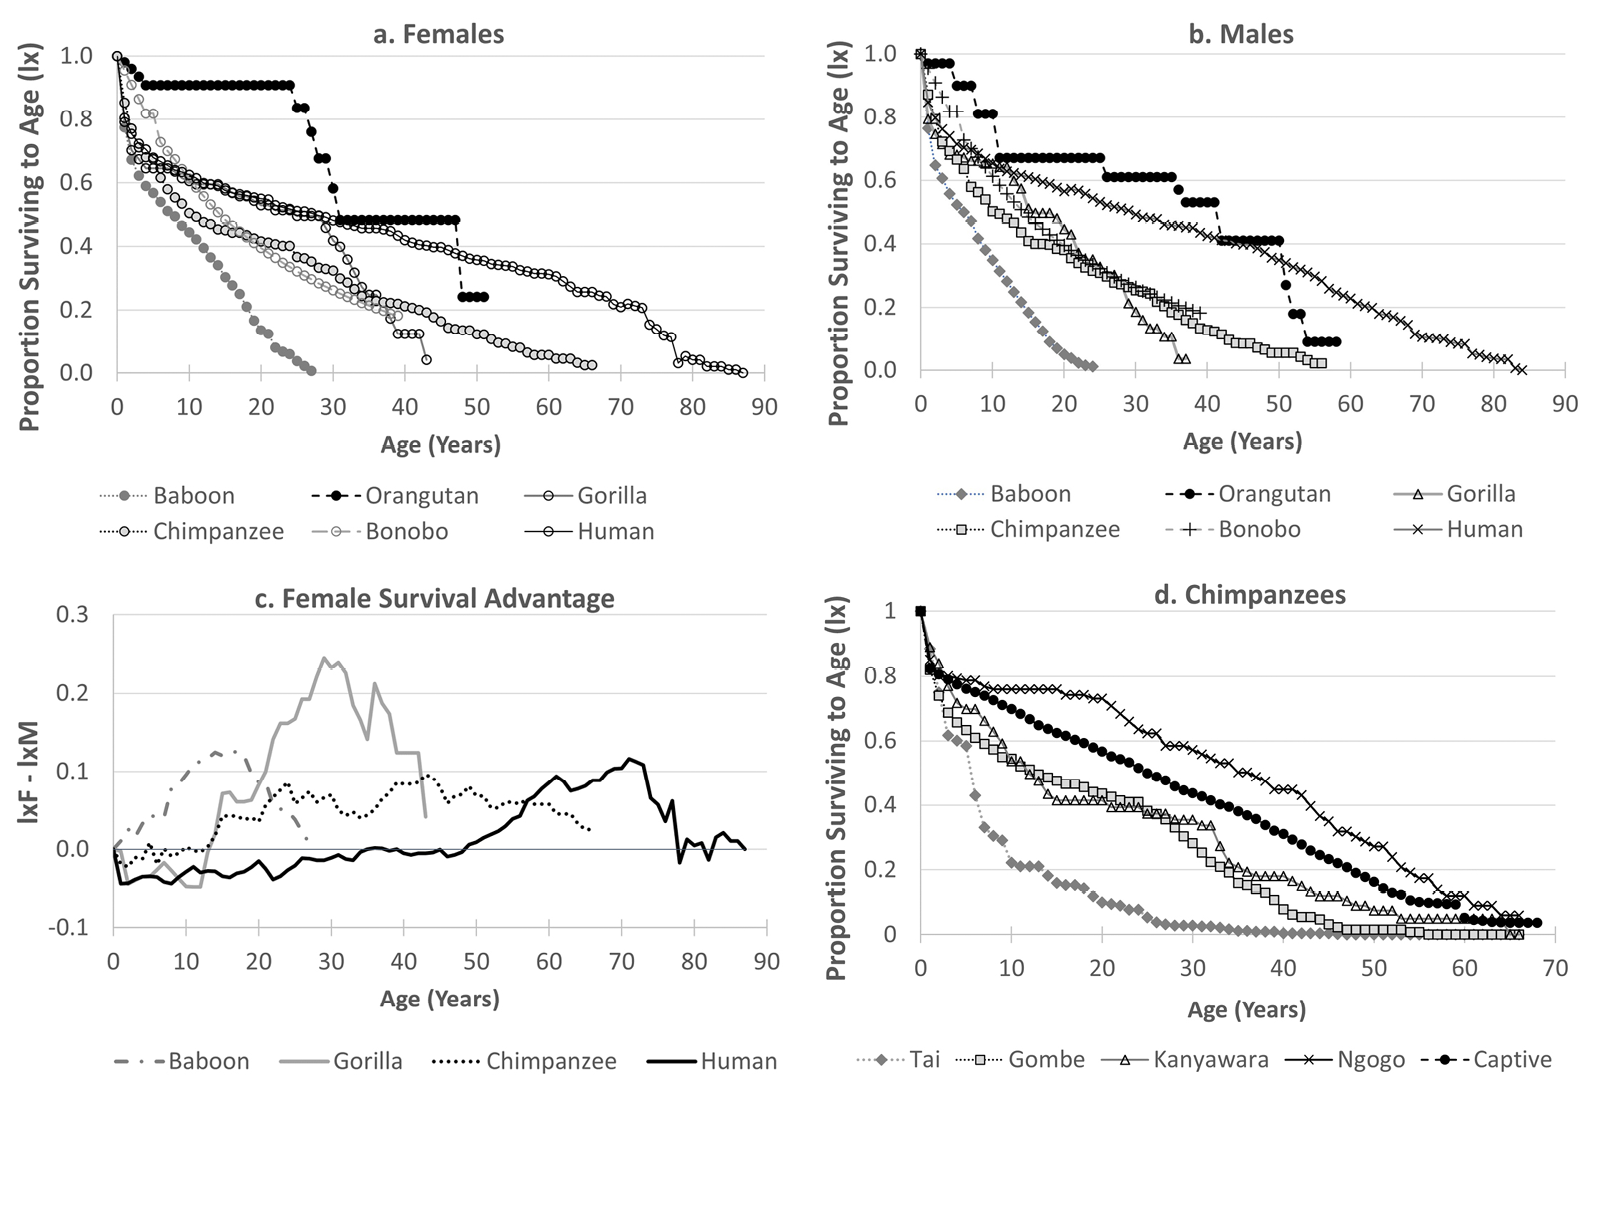
Fig. 1 Comparative survival data from hominid life tables, indicating proportion of individuals born surviving to age x (lx). (a) Survivorship of females; (b) survivorship of males; (c) excess survivorship of females, calculated as female lx − male lx, (d) survivorship of chimpanzees (males and females combined), illustrating differences among captives and four wild populations. Baboon and human forager curves are shown for contrast. Age-specific survival/mortality were not available for bonobos past age 7 but were approximated from mortality rates by age-class and were truncated at age 40 because long-term survival is unknown. Bonobo and orangutan data excluded from sex comparison because adult mortality is based on poor samples and age estimates (see text). Human and chimpanzee curves in a, b, and c show the mean of several populations. Sources: baboons (Papio cynocephalus, Amboseli: Bronikowski et al. 2016a,b); orangutans (females ages 0–17, Pongo spp.: van Noordwijk et al. 2018; males and females aged 18+: Pongo abelii, Ketambe: Wich et al. 2004); mountain gorillas (Gorilla beringei beringei, Karisoke: Bronikowski et al. 2016a,b); wild chimpanzees (Pan troglodytes schweinfurthii, Gombe: Bronikowski et al. 2016a,b; Kanyawara: Muller & Wrangham 2014; Ngogo: Wood et al. 2017; P. t. verus, Taï: Boesch & Boesch-Achermann 2000); captive chimpanzees, averaged from United States and Europe (Dyke et al. 1995), Japan (Havercamp et al. 2019); bonobos: (Wamba: Furuichi et al. 1998); Human foragers (Ache, forest period: Hill & Hurtado 1996; Hadza: Blurton-Jones 2016; Hiwi, pre-contact: Hill et al. 2007; n.b. !Kung San mortality data omitted because not differentiated by sex).
Mortality in the first year of life is similar between the sexes, or slightly skewed towards females, while excess male mortality emerges in adolescence and adulthood. Prime adulthood, between the ages of approximately 15 and 30 years, is characterized by low rates of mortality, with some populations experiencing rates as low as those observed in human foraging populations (Wich et al. 2004; Muller and Wrangham 2014; Wood et al. 2017). Humans’ increased longevity arises not from consistently lower mortality rates across adulthood but from a prolongation of the low mortality period. In the other great apes, mortality rates accelerate at approximately 25 years of age, while this take-off point is delayed by 20–30 years in human populations. A recent analysis of life tables in several primate species, including humans, East African chimpanzees, and mountain gorillas, concluded that there was no strong phylogenetic signal in Gompertz-derived adult mortality parameters, given that hominids fell within the continuum of other primates (Bronikowski et al. 2011). However, these data also show that hominids cluster at the low end of the continuum, with lower rates of initial mortality (i.e. mortality at onset of adulthood) and rates of aging (acceleration of age-specific mortality rate) than most other primate species.
At this point, life tables for wild apes remain sparse and may be vulnerable to stochastic variation, so caution should be used in interpreting variation among species. There are two major impediments to constructing life tables on wild great apes: age estimation and unrecognized mortality. For older individuals, who were adults when first identified by researchers, ages may be mis-estimated by 10 or more years. These oldest individuals have a relatively minor influence on the shape of survival functions, as the number of individuals whose ages are known with negligible error increases with research time. However, age estimation is a more serious problem for the dispersing sex, particularly if dispersal occurs multiple times or across a wide range of ages. Dispersal also creates the possibility for unrecognized mortality, as it may not be possible for dispersal events to be distinguished reliably from mortality events. Unrecognized mortality may also occur if rates of observation for some individuals are low. The latter is particularly a problem for identifying early infant mortality. These problems will gradually improve as researchers use genetic information to track individuals over larger study areas and monitor health and reproductive status of subjects.
Orangutans present a particular challenge, as males may experience delayed secondary sexual development, which makes it difficult to assign ages based on appearance alone (Utami et al. 2002). Sexual development is accompanied by dramatic physical changes and can occur rapidly, which also prevents researchers from recognizing an individual post-transition. Additionally, orangutan males often disperse over great distances and many remain transients for significant periods of time (van Schaik 1999; Nietlisbach et al. 2012). This creates significant uncertainty about the ages of new individuals entering the study area, as well as about the mortality status of individuals who disappear. These problems are noted by the authors of the only wild orangutan adult life table (Wich et al. 2004), which shows similar or higher survival in the wild than in captivity (Anderson et al. 2008; Wich, Shumaker, et al. 2009) or even, for early adulthood, human forager populations (Figure 1). This could be an artifact of having a small sample from a period of relative stability. Two features of the life table are cause for concern. First, the distribution of risk years exhibits distinct bulges at the author-defined age categories. For example, flanged males were assigned an age of 35 years when first encountered, thus the life table contains fourteen males aged 35 years, twice as many as were observed at age 34 and more than were observed at any age after 4 years. This could be possible if the Ketambe study site was a particularly attractive place for flanged males to mate and feed, and thus experienced an influx, but it would then be a poor representation of the broader study population. A second concern is that Ketambe males were reported to have substantially higher survival than females. There is a general expectation for a male-bias in mortality, particularly in species experiencing strong sexual selection for male body mass and polygynous mating effort (Clutton-Brock 1991; Clinton and Le Boeuf 1993; Allman et al. 1998; Colchero et al. 2016). In captivity, male orangutans exhibit much lower survival than females (Anderson et al. 2008; Wich, Shumaker, et al. 2009). It is notable that the biases imposed by dispersal and transience are expected to be most relevant to males, thus these results should be taken with caution. Despite the limitations of this sample, it can be clearly concluded that orangutans experience low mortality rates and can achieve lifespans at least comparable to those of other great apes.
Both sexes of gorillas disperse and may occupy multiple groups over their lifetimes (Tutin 1996; Yamagiwa and Kahekwa 2001; Harcourt and Stewart 2007), thus ages can be difficult to estimate unless a large number of groups can be monitored. Since starting with three groups of mountain gorillas in the 1960s, research at Karisoke has expanded to include twenty groups, and their work provides the only published wild gorilla life table (Bronikowski et al. 2016a, 2016b). While the research centre can only study the groups of mountain gorillas ranging on the Rwandan side of the Virunga Mountains, these groups range within a fairly restricted area and are geographically isolated from most other gorilla groups (Gray et al. 2013), thus the study population comprises the majority of groups that individuals could move between, and demographic data carry a high degree of confidence. Other study sites are more constrained. For example, the Mbeli Bai site monitoring western lowland gorillas affords the opportunity to observe a large number of unhabituated groups (>60) but is limited to making long-distance observations from a platform overlooking a 12.9 ha swampy clearing (Breuer et al. 2009). Thus, little is known about the variation in mortality across gorilla populations or species.
In chimpanzees, males remain in their community for life and females disperse and reproduce within a fairly narrow age range, so age estimation is a fairly minor problem after a couple of decades of research. Accordingly, several life tables exist for chimpanzees. All but one of these life tables comprises the East African subspecies. As noted above, the West African population at Taï has had a particularly devastating recent history, reflected in mortality rates that are not viable over the long-term (Boesch and Boesch-Achermann 2000; Köndgen et al. 2008). By contrast, a recent report from East African chimpanzees in the Ngogo community describes remarkable survivorship, exceeding that of captive chimpanzees (Wood et al. 2017). This study concluded that under favourable ecological circumstances, including high food availability and relative protection from human disturbance, wild chimpanzees may experience mortality rates as low or lower than those of human hunter-gatherers until the age of about 40. There are good reasons to believe that the Ngogo community would have reduced mortality compared to other chimpanzee communities. They are relatively isolated from human settlements that can be a source of disease, and they are not hunted by humans or other predators. The Ngogo chimpanzees have access to more fruit (Potts, Watts, and Wrangham 2011) and maintain higher energy balance than the nearby Kanyawara community (Emery Thompson et al. 2009), which itself exhibits relatively high adult survival (Muller and Wrangham 2014). They may indeed exemplify the best-case scenario for wild chimpanzees, but one that would appear to generate growth rates too high to be stable over the long-term. However, these specific survival estimates should be treated with caution due to peculiarities in the life table. For example, the survival function predicts that 20% of females ever born should live past the age of 60 years, while only 4 (in a community numbering 115 females) ever have. Unrecognized mortality is a distinct and unavoidable possibility in this sample due to the unusually large size of the community. This may occur because it takes many years to habituate and positively identify all individuals (particularly females), during which time deaths may go unrecognized. Additionally, a large number of female migration events may obscure death in early adulthood. Given the relative rarity of mortality events recorded, even a small number of unrecorded deaths could substantially alter the survival functions.
Wild bonobo life table statistics are only available for a small number of juveniles, though overall mortality rates are provided for adults and for adolescent males (Furuichi et al. 1998). These were 0.040 and 0.046 deaths/year, respectively, over an entire 20-year study, which included periods of intensive poaching. During a stable period, mortality rates dropped to approximately 2%. This initial data on adult mortality falls within the range of variation reported for other great apes, but bonobos may experience a relatively low infant mortality rate.
The range of variation in mortality among wild great apes, and even just among chimpanzees (Figure 1D), is very large, and given that long-term studies have been conducted primarily in protected areas, may represent only a fraction of the variation seen in nature. Available mortality data do not reveal a strong species signal, and instead suggest the influence of localized ecological conditions, including habitat disturbance, predation, natural disasters, poaching, and epidemic diseases. These stochastic factors, along with temporal variation in risk of infanticide (e.g., periodic male takeovers in gorillas) and intraspecific violence (e.g., intercommunity conflict in chimpanzees), mean that rates of mortality can vary dramatically even within a population over time. For example, the Taï chimpanzees experienced a 15-fold decrease in survival between earlier and later periods of study (Boesch and Boesch-Achermann 2000). Given the tremendous influence of human activities on ape populations, it may not be possible to reconstruct the patterns of mortality characteristic of these species during their evolutionary histories. This is perhaps not so different from the demographic examinations of modern human foragers (Gurven and Kaplan 2007).
After decades of research on wild great apes, there is relatively little understanding of cause-specific mortality. Even in well-monitored groups, a large number of individuals simply disappear without ever being recovered. In rainforests, decomposition and scavenging occur so rapidly that full necropsies cannot be performed even a couple of days after death. Thus, we know primarily about causes of death that have been preceded by obvious signs. For example, respiratory diseases occur in distinct outbreaks and cause readily observable signs, so individuals that disappear after coughing and sneezing can safely be assumed to have died from the disease.
Predation: As large-bodied primates, great apes are less vulnerable to predation than are other species, and large predators have in many cases been extirpated from their habitats. While rare, predation does occur and is likely to have been a low but consistent source of mortality for all great apes. Leopards are the principal non-human predator for gorillas, chimpanzees, and bonobos (Boesch and Boesch-Achermann 2000; Henschel, Abernethy, and White 2005; D’Amour, Hohmann, and Fruth 2006; Harcourt and Stewart 2007; Klailova et al. 2012). During one 4-year period, leopard predation was the primary source of mortality for West African chimpanzees at Taï, accounting for 39% of deaths (Boesch and Boesch-Achermann 2000). Older infants and juveniles appear to be targeted most frequently (Boesch and Boesch-Achermann 2000), but adults are also attacked and consumed (Henschel, Abernethy, and White 2005). Lions have killed chimpanzees during temporary incursions into the forest (Tsukahara 1993) and likely pose a threat for chimpanzees ranging in savannah habitats, though no such attacks have been observed (Stewart and Pruetz 2013). Both tigers and clouded leopards appear to prey upon wild orangutans (Rijksen 1978), and orangutans exhibit prolonged alarm responses to predators (Lameira et al. 2013), but tigers are absent from Borneo and the high degree of arboreality in orangutans likely provides them with protection.
Poaching: Predation by humans is a persistent threat to all great ape species. Commercial poaching for bushmeat consumption is most common in western and central Africa, where it can have catastrophic impacts on great ape populations (Walsh et al. 2003; Stiles et al. 2016). Even small-scale hunting, such as for local consumption or for traditional medicine, practices that have likely persisted for much longer, can have important effects on great ape populations (Meijaard et al. 2011). For example, densities of Bornean orangutans are better predicted by distance to the nearest hunting village than by logging intensity or ecological measures of habitat quality (Marshall et al. 2006). Even where great apes are not targeted for hunting, they are vulnerable to snares and traps set for other animals (Quiatt, Reynolds, and Stokes 2002), and they are killed when perceived to be a threat to crops or the safety of local villagers.
Trauma: Non-poaching trauma accounts for a considerable number of deaths. Infanticide is common in gorillas (Robbins et al. 2007a; Breuer et al. 2010; Hassell et al. 2017) and chimpanzees (Wilson and Wrangham 2003; Townsend et al. 2007). Chimpanzees also kill mature individuals during intergroup conflicts and even within their own communities, comprising approximately 1.4 deaths/100 individuals/year (Wrangham, Wilson, and Muller 2006). One-on-one conflicts among silverback gorillas and flanged male orangutans result in severe injury and death (Meder 1994; Knott 1998b). Falls from trees can also be fatal (Boesch and Boesch-Achermann 2000).
Infectious disease: Respiratory disease, frequently of human origin, is a persistent cause of mortality in African ape populations (Leendertz et al. 2006; Williams et al. 2008; Sakamaki, Mulavwa, and Furuich 2009; Humle 2011; Spelman et al. 2013). Outbreaks spread rapidly within groups, often producing signs in nearly 100% of individuals. Single outbreaks have been known to kill 10–20% of chimpanzees in a community within a matter of weeks (Kaur et al. 2008; Köndgen et al. 2008; Negrey et al. 2019). While old chimpanzees are most likely to exhibit respiratory signs, significant mortality occurs among all age classes except juveniles (Emery Thompson et al. 2018). Multiple outbreaks of Ebola haemorrhagic fever have caused catastrophic mortality among gorillas and chimpanzees in West Africa over the past 35 years (Leroy et al. 2004; Ryan and Walsh 2011). African apes have also experienced smaller-scale outbreaks of anthrax, polio, scabies, and measles (Leendertz et al. 2006; Williams et al. 2008; Hoffmann et al. 2017). A number of viruses (e.g., simian foamy virus) and intestinal parasites (e.g., Oesophagostomum, Strongyloides), along with malaria parasites, occur persistently in wild apes, but their long-term impact on health is not yet understood (Hasegawa, Kano, and Mulavwa 1983; Landsoud-Soukate, Tutin, and Fernandez 1995; Dupain et al. 2002; Lilly, Mehlman, and Doran 2002; Liu et al. 2008; Gillespie et al. 2010; Prugnolle et al. 2010). Chronic infections may play a role in the “wasting” illness observed in some older chimpanzees (Goodall 1986; Nishida et al. 2003; Terio et al. 2011). Simian immunodeficiency virus (SIV), a retrovirus related to HIV, occurs in some populations of chimpanzees and gorillas, but appears absent in bonobos (Santiago et al. 2002; Van Dooren et al. 2002; Van Heuverswyn et al. 2006). Among Gombe chimpanzees, the effects of SIV are not easily observed, but infected individuals have significantly reduced long-term survivorship (Keele et al. 2009). While wild orangutans are known to be infected by many of the pathogens impacting other apes (Kilbourn et al. 2003), no information is available on cause-specific mortality.
Degenerative Disease: Degenerative diseases, such as cancer, heart disease, and kidney disease, are expected to be major sources of adult mortality in long-lived species. A large number of unexplained deaths due to “old age” might suggest to be the case for great apes, but evidence of these processes has proved elusive. Heart disease is the largest cause of mortality among captive great apes (Lowenstine, McManamon, and Terio 2015; Strong et al. 2016; Laurence et al. 2017). However, atherosclerosis, arteriosclerosis, and associated coronary artery disease, the processes underlying most aging-associated cardiovascular deaths in humans, are very rare in great apes. Instead, captive great apes suffer from aortic dissections and myocardial fibrosis (Lammey et al. 2008; Varki et al. 2009; Lowenstine, McManamon, and Terio 2015). Evidence from a limited number of necropsies suggests that these or other cardiovascular processes are not significant sources of mortality in wild chimpanzees (Terio et al. 2011) or mountain gorillas (Nutter et al. 2005; Cooper 2017). Type II diabetes is rare even in well-fed captive apes (Kuhar, Bettinger, and Laudenslager 2005; Lowenstine, McManamon, and Terio 2015). Renal disease occurs in captive great apes, but its presence in the wild is unconfirmed (Lowenstine, McManamon, and Terio 2015; Strong et al. 2016). Malignant neoplasms occur but appear relatively rare in both wild and captive apes compared to humans (Lowenstine, McManamon, and Terio 2015; Laurence et al. 2017). Perhaps these would be found if more necropsies were done, but genetic evidence suggests that great apes have an increased capacity for cell apoptosis compared to humans (Arora, Mezencev, and McDonald 2012). Amyloid plaques and neuron loss have been identified in the brains of older captive great apes, but the full suite of signs of Alzheimer’s disease have not (Finch and Austad 2015, Edler et al. 2020).
Growth and Development
Postnatal Growth
A key feature of primate life histories is relatively slow growth compared with other mammals. Allometric comparisons across taxa suggest that primates as a group are constrained by a rate of production — energy available for growth and/or reproduction — of about 42% that of other mammals (Charnov and Berrigan 1993). The net result is prolonged infant dependence, a slow rate of reproduction, and a delay until attainment of full adult size and reproductive maturity. Slow growth may be advantageous, allowing primates to learn complex foraging (Kaplan et al. 2000) or social skills (Joffe 1997) before they enter the adult world, or it may simply be less risky for juveniles than to assume the costs of rapid growth in competitive or unstable environments (Janson and van Schaik 1993). Alternatively, somatic growth rates may be constrained by the costs of building a large brain (Foley et al. 1991; Ross and Jones 1999). The latter has convincing, direct support for humans, who experience an unusually slow rate of early growth. Growth rates are slowest when the metabolic demands of brain growth are highest, and the subsequent adolescent growth “spurt” is delayed until the costs of the brain decline (Kuzawa et al. 2014). Comparisons across primates suggest that variation in growth is not simply a product of how long it takes to reach a particular body size, but as in humans, manifests in complex variation in the timing and speed of successive growth stages (Leigh 2001).
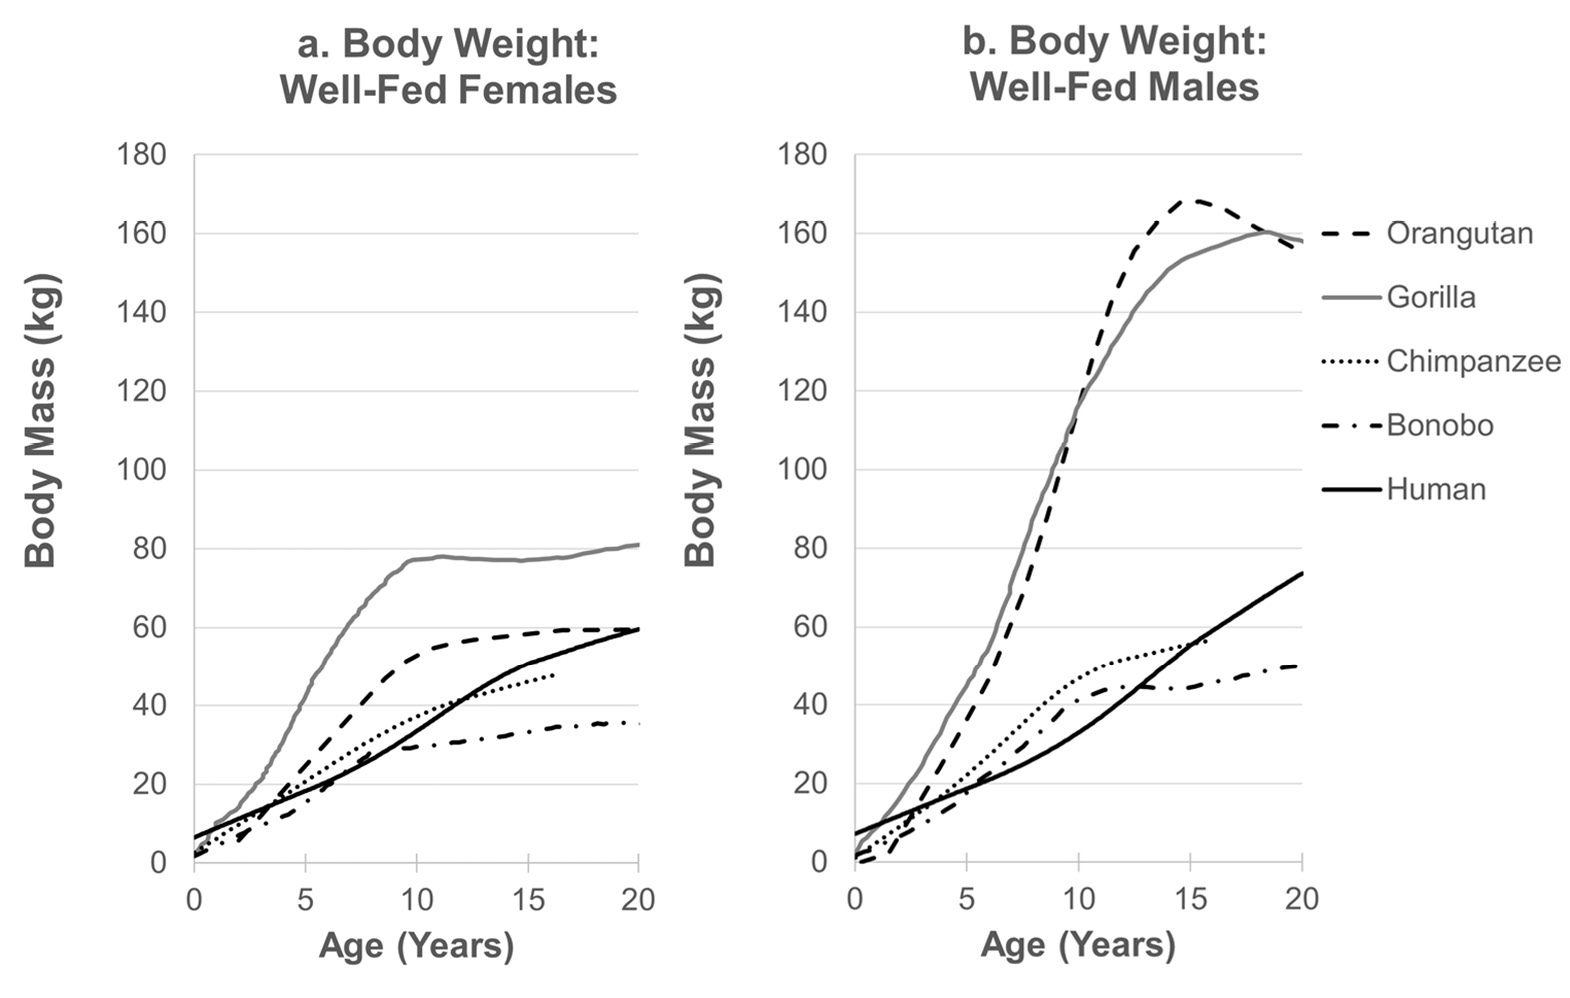
Fig. 2 Comparative hominid growth. Growth in body mass among male (a) and female (b) hominids in well-fed populations, loess-smoothed data. Data sources: orangutans (Pongo spp., N = 24, developmentally arrested males excluded; Fooden and Izor 1983); gorillas (Gorilla gorilla, N = 72F, 64M: Leigh and Shea 1996); chimpanzees (Pan troglodytes, N = 56F, 49M: Hamada and Udono 2002); bonobos (P. paniscus, N = 13F, 23M: Leigh and Shea 1996); humans (US, CDC, N >500,000: Kuczmarski et al. 2002). Where necessary, raw data acquired via WebPlotDigitizer (v. 3.9, Ankit Rohatgi).
Comparative data on growth in great apes, as in other primates, has primarily been generated from captive populations. This is important because the stable nutritional base in captivity accelerates both growth and sexual maturation and may do so differently depending on the natural diet. Captive data have other disadvantages. For example, increased fat deposition in sedentary captive colonies can lead to less robust correlations between body mass and growth in stature, and reproductive interventions can obscure the trade-off between reproduction and growth. As a general rule, differences in adult body mass among great ape species are due to differences in the rate of early growth, whereas sexual dimorphism within species results primarily from differences in the duration of growth and the magnitude of the growth spurt (Figure 2, Fooden and Izor 1983; Shea 1983; Leigh and Shea 1996). Gorilla growth rates start higher and accelerate more rapidly than either species of Pan, reaching peak velocities more than twice as great (Table 2). Chimpanzees grow slightly faster than bonobos during the early growth period, but chimpanzees grow for longer before reaching peak velocity. Sex differences in growth rates are minimal until adolescence, when male rates accelerate. Whereas male apes exhibit distinct adolescent growth spurts in weight, female growth spurts are notable in gorillas and bonobos but indistinct in orangutans and chimpanzees (Leigh 1996). Growth in mass for most apes reaches an asymptote by approximately 10–15 years, except for male gorillas and orangutans who may grow for substantially longer. All of the great ape species grow faster during the early growth period than do humans and reach an earlier peak velocity. Thus, humans are exceptional both in how slowly and for how long they grow, and these characteristics are not readily explained by adult body mass (Leigh 2001).
Growth data from wild apes are sparse and differences in analytical approaches makes them difficult to compare directly to captives. Most estimates of wild body mass and length come from animals shot for museum collections, which may be a biased sample and may have errors in weight estimation. Based on the available data, the effect of captivity on adult body mass varies substantially. Orangutans are about 60% heavier, while gorillas and bonobos are of similar mass in both contexts (Table 2). Comparative growth data on living animals are available only for chimpanzees; wild chimpanzees at Gombe National Park were weighed by baiting hanging scales with food (Pusey et al. 2005). Differences in growth between Gombe and captive chimpanzees are apparent from infancy and result in an approximate 1/3 reduction in body mass (n.b., Gombe chimpanzees are small compared with other wild chimpanzees: Emery Thompson and Wrangham 2013), a difference that parallels that between human foragers and those in developed countries (Figure 3). However, wild individuals reach their full adult mass at approximately the same age as do captive individuals. Sexual dimorphism is not conspicuously enhanced with captivity for any of the great apes.
Brain growth is not well characterized in great apes. The brains of captive chimpanzees grow at a substantially lower rate than humans, and the marked difference in size is near fully realized in the first year (Leigh 2004). Growth rates subsequently decelerate rapidly such that chimpanzees complete their brain growth at about the same age, or slightly earlier (4–7 years), than do humans (5–7 years) (Herndon et al. 1999; Leigh 2004; Robson and Wood 2008; Coqueugniot and Hublin 2012; Neubauer et al. 2012). Wild mountain gorillas reach adult brain size by only age 3–4 years (McFarlin et al. 2013) The significance of adult brain mass differences among great apes is unclear. Early efforts to compare brain size across species emphasized encephalization quotients that account for body size (chimpanzees > orangutans > gorillas, Marino 1998), while recent studies suggest that absolute size (gorillas > chimpanzees = orangutans > bonobos, Table 2) is most relevant to cognition (Reader and Laland 2002). Phylogenetic analyses indicate a dissociation between brain size and body size during primate evolution (Montgomery et al. 2010). New analyses using neuronal cell counts indicate that brains of primates, including all hominids, follow a common isometric scaling pattern (Herculano-Houzel and Kaas 2011). An interesting conclusion of this work is that while human brains are extraordinary in their absolute size, sophistication, and cost, they do not actually have larger brains than expected for primates of their size (Azevedo et al. 2009; Herculano-Houzel 2012). Instead, it is the other great apes that are outliers, with the evolution of large body mass outpacing selection on the brain (Herculano-Houzel and Kaas 2011).
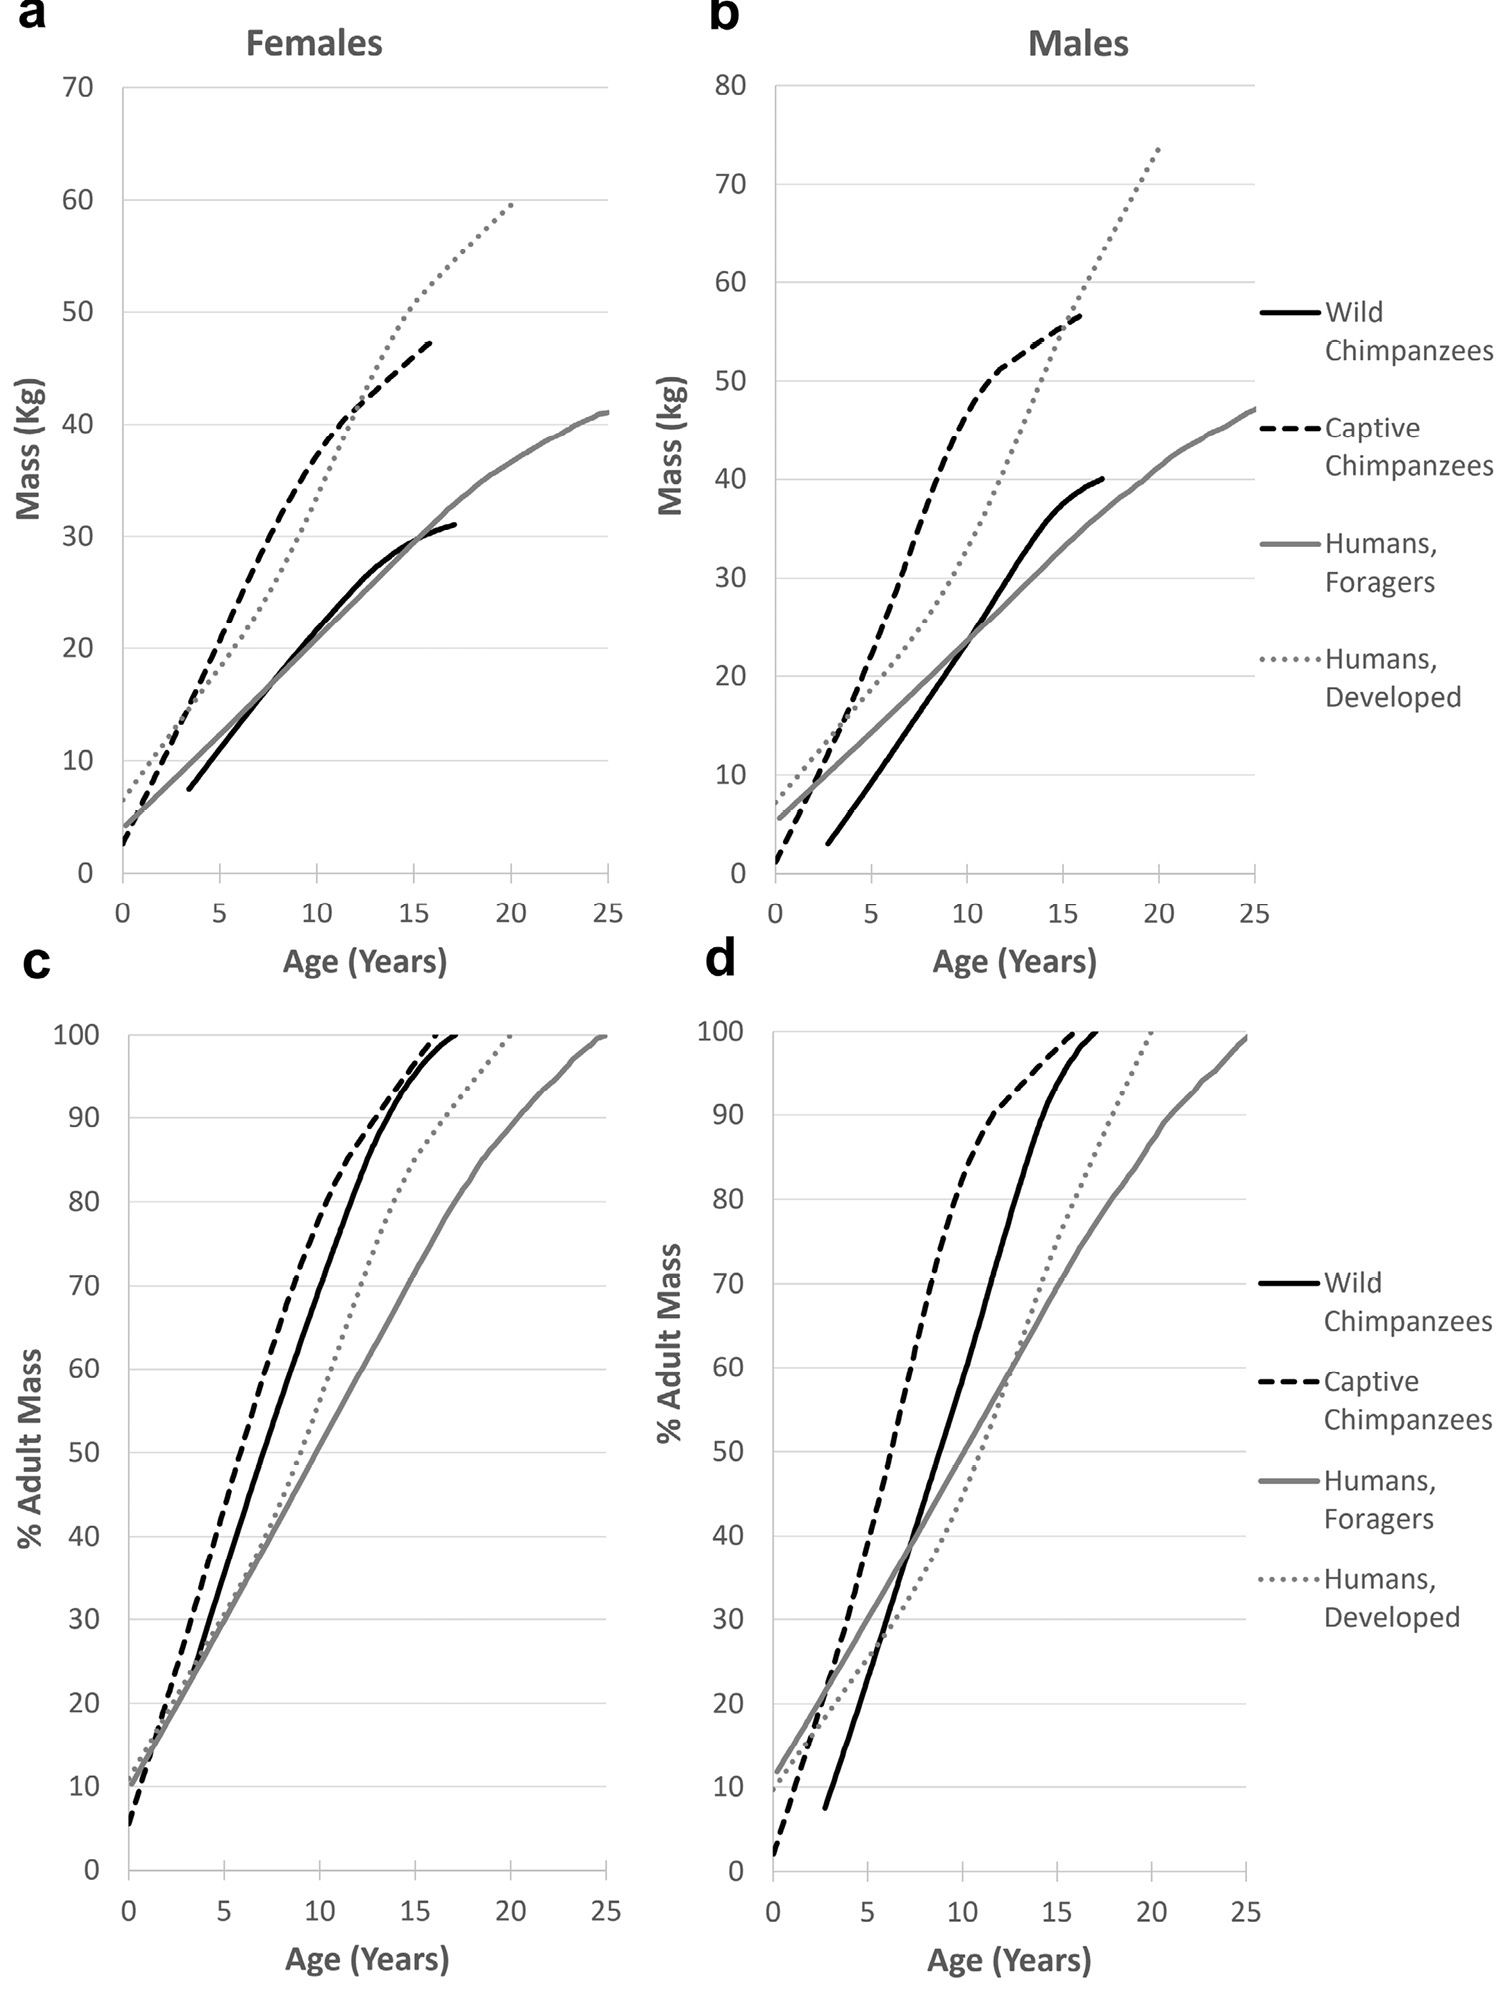
Fig. 3 Growth in body mass among chimpanzees and humans under subsistence and well-fed conditions, loess smoothed data: (a,c) females, (b,d) males. Panels a, b depict absolute growth in body mass, emphasizing the intraspecific effect of energy availability. Panels c, d depict growth relative to adult body mass, emphasizing interspecific effects. Data sources: wild chimpanzees, Pan troglodytes schweinfurthii (Gombe, N = 26F, 31M: Pusey et al. 2005); captive chimpanzees, P. t. verus (Sanwa-Kagaku Kumamoto Primate Park, N = 56F, 49M: Hamada and Udono 2002); human foragers (Dobe !Kung: Howell 2010); humans, developed nation (U.S., CDC, >50,000: Kuczmarski et al. 2002). CDC data available to age 20, captive chimpanzees to age 16, !Kung and Gombe data truncated at ~95% adult weight (ages 25, 17 respectively). Where necessary, raw data acquired via WebPlotDigitizer (v. 3.9, Ankit Rohatgi).
Weaning and Nutritional Independence
While age of weaning is considered a critical developmental milestone across species, it is clear that its significance has changed in humans due to the availability of cooked or processed weaning foods and contributions to infant provisioning by fathers and alloparents. Humans consequently wean infants at a relatively young age compared to other hominids despite longer periods of nutritional dependence and maturation (Kennedy 2005). Observations from the other great apes indicate that the weaning ages correspond more clearly with the expectation of later weaning associated with slower developmental trajectories (Table 3). That is, all of the great apes nurse their infants for longer periods in the wild than do other primates. Differences among the apes correspond to later features of maturation: weaning is earliest in the Karisoke population of mountain gorillas (3.3 years) and latest in orangutans (6–8 years).
There are two major problems with defining and comparing ages of weaning in wild hominids. The first is the reliability of measurement. Nipple contact is difficult to observe and quantify, as a lot of nursing may occur out of view while high in trees or during the night. It is also not clear how well nipple contact times approximate actual milk ingestion. A second issue emerging from recent studies is that age of last nipple contact, the classic definition of weaning age, appears to be a poor indicator of relative infant development or maternal nutritional support (van Noordwijk, Kuzawa, and van Schaik 2013; Bădescu et al. 2017). In many smaller primates, the transition from exclusive maternal nutritional support to completely independent infant foraging occurs relatively rapidly at a stage of growth at which the infant’s nutritional needs outstrip the mother’s ability to accommodate them (Lee, Majluf, and Gordon 1991; Lee 1996). In these species, weaning is marked by overt maternal rejection and mother-infant conflict, and reliably precedes the resumption of maternal cycling, often corresponding to seasonal patterns of resource availability. For hominids, the increased energetic requirements of larger bodies and brains necessitates multiple years of lactation, including a substantial period where both mothers and infants need to contribute to meet the costs of growth (van Noordwijk, Kuzawa, and van Schaik 2013; van Noordwijk et al. 2013).
Studies of developmental processes in apes have just begun to gain traction, and these studies indicate that the multi-year lactation pattern is fundamentally different from the “classic” primate model (van Noordwijk et al. 2013). Hominid lactation comprises 3 major phases. The period of exclusive lactation lasts only a few months, with first ingestion of solid food occurring at similar ages as in other primates. Subsequently, infants continue to nurse intensively, while using supplemental foods, until their second or third year of life, at which time they undergo a marked nutritional transition to independent feeding. This transition comprises steep increases in infant time spent independently foraging (van Noordwijk et al. 2013; Matsumoto 2017; Bray et al. 2018) and decreases in time spent suckling (Clark 1977; Stewart 1988; Nowell and Fletcher 2007). The energetic relevance of these transitions has recently been confirmed using stable isotope ratios, which comprise signatures of milk ingestion or of dietary convergence by mother and infant (Reitsema 2012). For example, mother and infant chimpanzees have high divergence of carbon and nitrogen isotopes in their faeces until the infant reaches approximately 18 months and begin to converge thereafter (Bădescu et al. 2017). Dental nitrogen isotopes from deceased juvenile chimpanzees tell a similar story (Fahy et al. 2014). Urinary C-peptide of insulin levels have been used to track changes in the energetic costs of lactation for chimpanzee mothers, and these profiles also indicate a transition to a reduced load at approximately 2 years postpartum (Emery Thompson, Muller, and Wrangham 2012). This transition is most functionally equivalent to weaning in other primates, though it occurs later. However, most hominids do not fully wean until they are between 3 and 8 years old, suggesting a third stage wherein infants can provide most of their own calories but continue to use breastmilk for supplemental nutrition. It is unclear how consistently infants use breastmilk after this point, or how reliant they are on milk for survival. Dental barium isotopes from the teeth of orangutans, which have the latest weaning ages of any mammal, indicate that the pattern of milk ingestion fluctuates dramatically, with significant peaks in milk consumption during periods of food scarcity (Smith et al. 2017). Isotopic signatures of nursing disappear by about 4 years in wild chimpanzees, though infants are observed nursing for 5–6 years (Bădescu et al. 2017). Some wild chimpanzees can survive, albeit at a disadvantage, if they are weaned or even orphaned in their third year (Boesch et al. 2009; Emery Thompson et al. 2016), even though most continue to suckle for 2–4 years longer. While mountain gorilla infants can be weaned anywhere between ~2–5 years of age, final weaning age has had little impact on survival (Eckardt, Fawcett, and Fletcher 2016). Thus, for infants, whose costs of growth and competitive disadvantage make them particularly vulnerable to fluctuations in food supply (Janson and van Schaik 1993), mother’s milk may not be a consistent need but an important buffer. This may help explain why mountain gorillas complete weaning substantially younger than other great apes. The low-quality herbaceous vegetation that comprises the mountain gorilla diet might seem less than ideal for infants, but it is consistently and abundantly available and requires relatively little learning of selection or processing techniques. Bamboo shoots, in particular, are soft and high in energy yield and seem to be ideal weaning foods (Grueter et al. 2014; Eckardt, Fawcett, and Fletcher 2016). On the other hand, orangutans experience the most drastic fluctuations in food supply (Conklin-Brittain, Knott, and Wrangham 2006) and continue to use supplemental nursing for the longest of any of the hominids.
The classic model of primate reproduction emphasizes the role of nursing, and consequently of weaning, as an adaptive regulator of birth spacing. As mothers are predicted to reproduce again only when their infants are sufficiently developed and capable of foraging independently, nursing itself is thought to suppress maternal reproduction. There is even a well-known mechanism for this. The hormone prolactin, produced by the mother’s pituitary in response to the suckling stimulus, directly acts to suppress ovarian cycling. Under this model, infants exert considerable influence over maternal reproductive schedules, though mothers can push back by rejecting infants from the nipple at an earlier age than they might like. However, in humans it has become clear that even very intensive nursing practices may not suppress maternal cycling if the mother has abundant energy available to her (Ellison and Valeggia 2003; Valeggia and Ellison 2004; Valeggia and Ellison 2009), chiefly because the prolactin response to suckling is blunted in well-nourished mothers (Lunn et al. 1984). Instead, reproductive timing is determined by the ability of a mother to recover the energetic losses of pregnancy and lactation. While intensive breastfeeding detracts from maternal energy balance, breastfeeding alone, particularly subsequent to the introduction of supplemental foods, may not comprise a sufficient “metabolic load” to prevent the resumption of cycling (Ellison and Valeggia 2003; Valeggia and Ellison 2004). It is thus observed that many women resume cycling or even conceive while still nursing their previous infant (Gioiosa 1955; Merchant, Martorell, and Haas 1990; Moscone and Moore 1993). Similarly, weaning is not a prerequisite for the resumption of cycling in great apes, and it appears that infants habitually suckle into their mothers’ next pregnancy (orangutans: van Noordwijk et al. 2013; gorillas: Eckardt, Fawcett, and Fletcher 2016; Robbins and Robbins 2021; chimpanzees: personal observation). The final age of weaning, therefore, is determined by the mother’s reproductive pattern rather than the infant’s age or relative development. For example, wild chimpanzees who were forced to wean early due to a mother’s pregnancy had a significant growth disadvantage relative to those whose mothers reproduced slowly (Emery Thompson et al. 2016). Thus, species variation in final weaning ages make sense in the scheme of other life history variation, but individual weaning ages may be poor indicators of development. Weaned apes are often well past the age at which they can feed themselves but well before the age when benefits of mother’s milk are exhausted.
In both chimpanzees (Lonsdorf et al. 2020) and mountain gorillas (Robbins and Robbins 2021), later weaning ages have been reported male infants than for female infants. Maternal rank did not affect weaning age in the mountain gorillas. Among Gombe chimpanzees, high ranking mothers had both the earliest and latest ages of weaning (Lonsdorf et al. 2020). This pattern likely reflects two processes, one where improved condition drives faster reproduction among high-ranking females (forcing earlier weaning), and another where rank is increasing with age as fertility declines (high terminal investment).
Behavioural Development
Great apes experience many years of further growth and development after becoming nutritionally independent from their mothers. This juvenile period, defined as the interval between weaning and sexual maturity (Pagel and Harvey 1993), is greatly extended in primates compared to many other species, even after accounting for differences in adult body size (Charnov and Berrigan 1993). Skeletal, cognitive, endocrine, and sexual maturation proceed across this period. As in humans, great ape juvenility is a time of continued close proximity to mothers, frequent play, and development of foraging expertise and social relationships. The great apes also exhibit a distinct and lengthy period of adolescence, the interval between the first signs of puberty and the attainment of full adult size and adult social and breeding status. This period comprises increasing independence from the mother, initiation of sexual behaviour, slowly increasing fecundity, elaboration of secondary sexual characteristics, participation in status competition, and (depending on sex) dispersal into new groups.
Orangutans cling to their mothers almost exclusively for the first 2 years of life, and by 4 years they spend little time in direct contact with their mothers (van Noordwijk et al. 2009). They continue to spend almost all of their time within 10m of their mothers until approximately 6–8 years, and rarely associate with their mothers after age 9–10 years (van Noordwijk et al. 2009; van Adrichem et al. 2006). In Western gorillas, infants are in direct contact with mothers for 1–1.5 years and cling very rarely after approximately age 3.5 years (Nowell and Fletcher 2007). By that age, they are more apt to wander away from their mothers than are orangutans, but they continue to spend at least 50% of their time within 10m of their mothers until about age 6 years (Nowell and Fletcher 2007). Mountain gorillas reduce spatial proximity with their mothers more rapidly. They are in contact almost exclusively for the first 6 months of life, with very low rates of contact after 2 years (Fletcher 2001). Individuals begin wandering more than 5m away by age 1 and spent less than half their time within 5m by 2.5 years (Fletcher 2001). Chimpanzee infants are in contact almost exclusively until about 7–9 months (van de Rijt-Plooij and Plooij 1987). Males begin traveling in different subgroups from their mothers at about 7–8 years of age, and by ages 12–14 spend most of their time with adult males, though there is considerable variation in this (Pusey 1983, 1990a; Machanda et al. 2014). Females, who typically disperse and will not form adult relationships with other members of their natal group, continue to associate in the same subgroup as their mothers at high rates until they emigrate (Machanda et al. 2014). When individuals of either sex are in the same subgroup with their mothers, they tended to remain in close proximity (<15 m) with her until at least 10 years of age (Pusey 1983).
Though individual differences in attainment of behavioural milestones may reflect differences in growth or maturation, the difference between species likely has more to do with socioecological factors. Given their high risk of infanticide from outside males, it is somewhat surprising that mountain gorillas leave the safety of their mothers relatively early and often compared with other hominids. However, even in the first year of life, immature gorillas seek proximity with silverback males, who offer the most effective protection (Stewart 2001; Rosenbaum, Silk, and Stoinski 2011).Differences in mother-offspring distance across species covary with group cohesion — where groups as a whole exhibit tighter proximity, as in mountain gorillas, infants and juveniles spend less time in close proximity with their mothers. These differences also covary with dietary complexity, perhaps suggesting differences in the importance of staying near mothers for observational learning of foraging. In gorillas, where low-quality forage is easily acquired, infants may have less need to observe their mothers’ food choices and processing behaviour. Orangutans, on the other hand, rely on a wide range of foods to buffer periods of food scarcity, and infants carefully observe their mothers in foraging contexts (Schuppli, Forss, et al. 2016; Schuppli, Meulman, et al. 2016).
Dispersal
In great apes, as in most species, one or both sexes tend to disperse from their natal groups around the time of sexual maturity, but dispersal patterns vary considerably. Dispersal is thought to serve a primary function in reducing the potential for inbreeding (Pusey 1987, 1990b). While individuals also use mate choice behaviours to avoid mating with close kin (Pusey 1980), these mechanisms can fail if a male relative is sexually coercive or if paternal kin are not well recognized (Walker et al. 2017). The diversity of dispersal patterns among great apes suggests that emigration serves additional or alternative functions, such as mitigating competition among relatives or providing access to better breeding opportunities.
Both bonobos and chimpanzees exhibit clear female-biased dispersal whereby most, but not all, females leave their natal groups around reproductive maturity, while males remain in their natal groups for life (Nishida 1979; Furuichi 1989; Eriksson et al. 2006). Female chimpanzees almost always emigrate after starting their sexual swelling cycles and having mated with males in their natal communities (Pusey 1980; Stumpf et al. 2009), and the swelling itself may serve as a kind of “passport” to facilitate acceptance by males in a new group (Nishida 1979). Most chimpanzee females emigrate between ages 10 and 15 (Emery Thompson 2013b; Wittig and Boesch 2019), while bonobos emigrate between ages 6 and 10 (Furuichi et al. 2012). Females may emigrate immediately after starting their swelling cycles or may be delayed for as much as 2 years. Dispersal timing in female chimpanzees in Kibale National Park was not predicted by gynaecological age or elevations in glucocorticoid levels, but tended to occur during periods of high diet quality, suggesting that females emigrated when they had energy to spare (Stumpf et al. 2009). The majority of females transfer only once and do so permanently. However, female chimpanzees and bonobos may visit several communities before settling or leave their natal group temporarily and return to breed later (Pusey 1980; Goodall 1986; Furuichi et al. 2012), and rare secondary dispersal by adult female chimpanzees occurs (Nishida, Takasaki, and Takahata 1990; Emery Thompson, Newton-Fisher, and Reynolds 2006; Walker et al. 2017). In both chimpanzees and bonobos, male dispersal is rare due to hostile intergroup relations, but isolated (some temporary) male immigration events have been observed (Sugiyama 1999; Hohmann 2001; Sugiyama 2004; Furuichi et al. 2012).
Gorillas exhibit bisexual dispersal: either sex may disperse or may be philopatric (Douadi et al. 2007; Harcourt and Stewart 2007; Robbins et al. 2009). Dispersal of males appears to be dependent on breeding opportunities. Mountain gorilla males generally leave their natal groups between ages 13 and 21, after the saddles on their backs turn grey and they have reached, or nearly reached, their full adult size (Stoinski et al. 2009). They often range temporarily in bachelor groups until they are able to acquire females to establish their own groups. Some mountain gorillas remain in their natal groups by inheriting the dominant silverback position after the former silverback’s death or by maturing into a position as a secondary male (Watts 2000; Robbins and Robbins 2005). In Eastern lowland gorillas, which have uni-male groups, males emigrate relatively early at 10–14 years (Yamagiwa and Kahekwa 2001). Female gorillas mature faster and leave their natal groups earlier than males: between 8–10 years in the Western species (Robbins et al. 2004), 7.5 to 15.3 years in eastern lowland gorillas (Yamagiwa and Kahekwa 2001), and approximately 8 years in mountain gorillas (Harcourt and Stewart 1978). Unlike chimpanzees, gorilla females may exhibit secondary or even tertiary dispersal, apparently to manage the risk of infanticide (Harcourt and Greenberg 2001; Stokes, Parnell, and Olejniczak 2003; Harcourt and Stewart 2007). Females may maintain kin associations by dispersing with female relatives or into groups with related individuals (Bradley, Doran-Sheehy, and Vigilant 2007).
Adult orangutans establish individual ranges, thus both sexes effectively disperse. However female orangutans can be viewed as the more philopatric sex because at least some females establish home ranges adjacent to or overlapping their mothers’ and maintain friendly, albeit rare, interactions with maternal relatives (van Noordwijk et al. 2012; Ashbury et al. 2020). Males emigrate substantially farther than females (Nietlisbach et al. 2012; van Noordwijk et al. 2012), and some may continue to shift ranges throughout life (van Schaik 1999). Genetic evidence suggests that developmental arrest does not impact dispersal: even sexually-mature unflanged males are not found near related individuals (van Noordwijk et al. 2012).
Despite variation within and among great apes, as a group they depart fundamentally from the predominant pattern of male dispersal and strong female kin associations observed in cercopithecine primates. Available genetic and ethnographic evidence paint an uncertain view of sex-biased dispersal during human evolutionary history, with some studies supporting a history of female migration and others suggesting a considerably more complicated pattern (Seielstad, Minch, and Cavalli-Sforza 1998; Hammer et al. 2001; Marlowe 2004; Wilder et al. 2004; Langergraber et al. 2007). This likely emerges from high flexibility in residence patterns across human populations, including multilocality, and perhaps from different patterns of local versus long-range migration. While agriculture appears to be responsible for a recent strong tendency for patrilocality (Marlowe 2004), the great ape data parsimoniously indicate that some degree of female dispersal would also have occurred in early hominin ancestors.
Sexual Maturation
Menstruation occurs in all great apes, but it is lighter than in humans and cannot be reliably detected in the wild. Among captive apes, menarche occurs at approximately age 8 years in orangutans, bonobos, and chimpanzees, and 6–7 in Western gorillas (Knott 2001). In female chimpanzees and bonobos, large oestrogen-dependent swellings of the anogenital region provide a conspicuous indication that ovarian cycles have begun (Dahl, Nadler, and Collins 1991). Fully tumescent swellings begin at approximately age 10–12 years in wild East African chimpanzees, after months or even years of small, sporadic swellings (Wallis 1997; Nishida et al. 2003; Stumpf et al. 2009; Walker et al. 2018). Earlier ages (8–9 years) are reported for small samples of West African chimpanzees at Bossou (Sugiyama 2004) and bonobos at Wamba (Kuroda 1989). Gorillas exhibit much smaller labial swellings that first emerge at approximately 6–8 years in wild mountain gorillas (Harcourt et al. 1980; Harcourt and Stewart 2007), but possibly not until 9–10 years in Western gorillas (Breuer et al. 2009). First cycling likely begins later in orangutans, which have no external indicators of ovulatory state, as first sexual behaviour does not occur until 10–14 years (Knott, Emery Thompson, and Wich 2009).
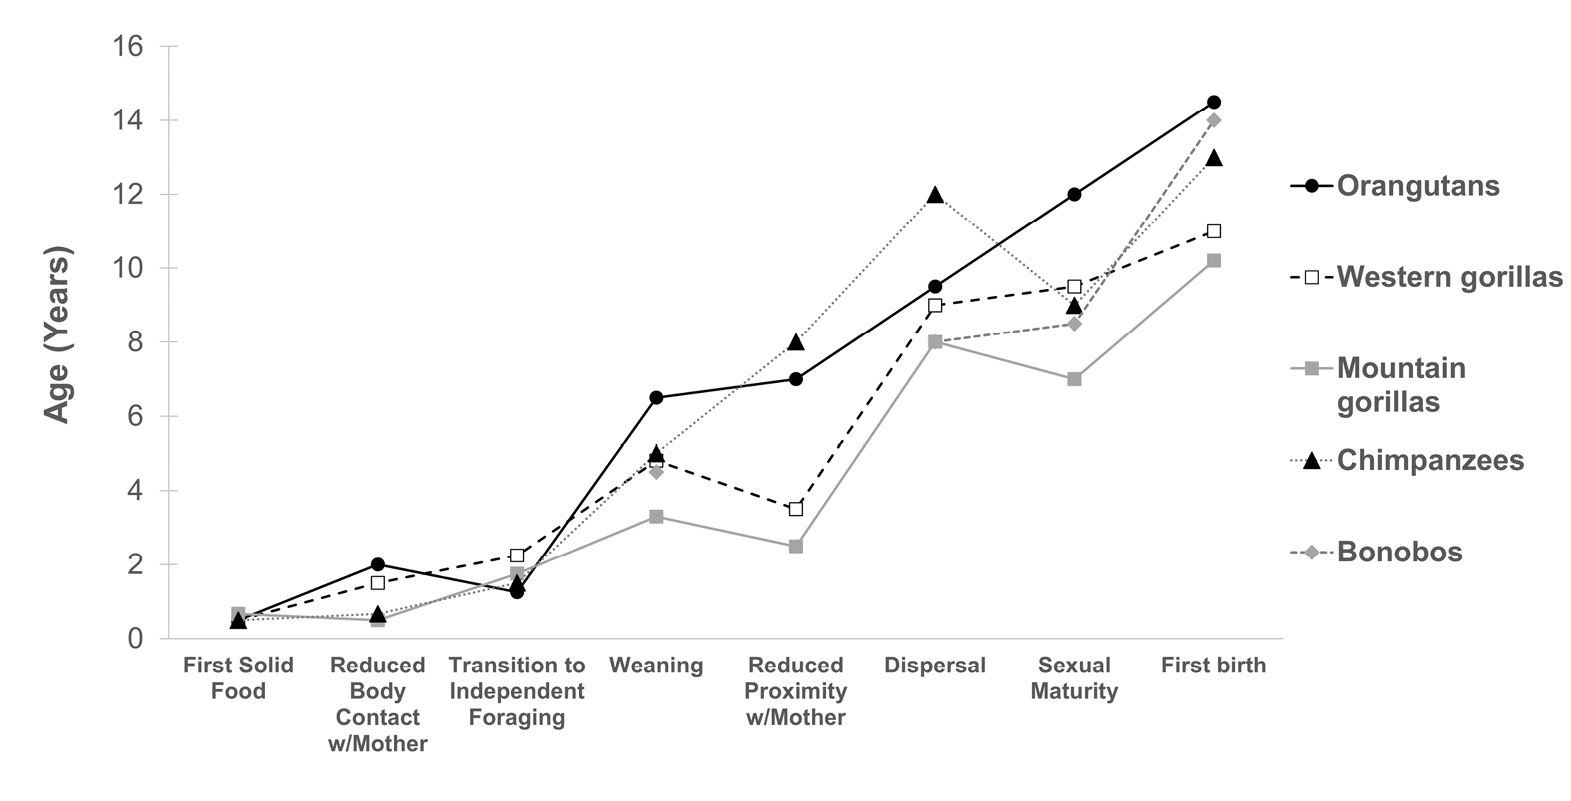
Fig. 4 Maturation in hominids. Relative timing of foraging, social, and sexual development in wild great apes, showing approximate species averages for each milestone (data: see Tables 3 and 4). Note that data are missing for some events in bonobos. Mountain gorilla data shown are for Karisoke, where all milestones are available, though it should be noted that the second mountain gorilla population at Bwindi has later ages of weaning (Robbins and Robbins 2021).
Like humans, great ape females undergo substantial periods of adolescent subfecundity, defined as the interval between onset of sexual cycling and first conception (Montagu 1979). These data are difficult to acquire for individuals, as dispersal often interrupts the subfecund interval. As a result, the reports of true adolescent subfecundity based on natal individuals (approximately 1–1.5 years in mountain gorillas, 2.5 years in chimpanzees, and 4–5 years in orangutans, Knott 2001) underestimate the difference between mean age of menarche and first birth. In chimpanzees, for example, natal individuals give birth 1–2 years earlier than do immigrants (Nishida et al. 2003; Walker et al. 2018). This suggests that dispersing females may suffer a longer period of adolescent subfecundity.
Testicular enlargement occurs in wild chimpanzees at approximately 8–10 years (Goodall 1986; Pusey 1990a). First ejaculatory copulations occur at approximately age 9 years in the wild (Goodall 1986; Pusey 1990a; Sugiyama et al. 1993), compared with approximately 7 years in captivity (Marson et al. 1991). Like females, males undergo a long period of subfecundity, as sperm counts and viability increase (Marson et al. 1991). Comparable data are not available for bonobos, but puberty-associated increases in testosterone occur at the same age in captive chimpanzees and bonobos (Behringer et al. 2014). The testes of male gorillas are too small to be reliably evaluated in the wild (Harcourt 1995). The development of other adult characteristics (e.g., sagittal crest, silver hair) takes place between approximately 10 and 16 years in wild gorillas (Watts and Pusey 1993; Breuer et al. 2009). Male reproduction is typically constrained by the ability to become the dominant silverback, which occurs at a minimum age of 14 and average age of 17 (Breuer et al. 2009; Stoinski et al. 2009). Orangutan males exhibit two sexually-mature morphs (Rijksen 1978; Schürmann and van Hooff 1986; Utami et al. 2002). Some males may maintain an undeveloped (“unflanged”) state, difficult to distinguish from the subadult phenotype, for up to 20 years after reaching sexual maturity. Fully “flanged” males exhibit pronounced cheek flanges, enlarged throat pouches, ropy hair, and increased body mass, and display pronounced differences in behaviour, such as in long-calling rates, activity budgets, and interactions with females (Utami Atmoko and van Hooff 2004; Knott et al. 2010). While flanged males produce higher levels of testosterone than unflanged males (Kingsley 1982; Maggioncalda, Sapolsky, and Czekala 1999), particularly if they developed early (Emery Thompson, Zhou, and Knott 2012), unflanged males are physiologically capable of siring offspring (Utami et al. 2002; Goossens et al. 2006). Given relatively late ages of first reproduction among captive orangutans compared with other great apes, it is reasonable to assume that wild orangutan males reach reproductive maturity late relative to their wild counterparts. As a general rule, great apes are similar to humans in that females exhibit outward signs of sexual maturity (e.g., sexual swellings) early in the pubertal transition and before the development of full fecundity, whereas males do not develop the physical appearance of adults until well after they are capable of siring offspring.
Figure 4 depicts the timing of behavioural development and sexual maturation across great apes. While these data indicate some consistent species differences in developmental rate, especially after weaning, they also indicate that species do not follow a consistent trajectory across modalities. For example, there is very little variation in when great apes ingest their first solid food or when they draw down their reliance on breastmilk, but greater variation in when offspring are finally weaned. While orangutans and mountain gorillas tend to fall at the upper and lower extremes, respectively, at each time point chimpanzees deviate from the expected pattern by maintaining social cohesion with their mothers and natal groups for longer.
Female Reproduction
Fertility
First births to wild females occur at average ages of 10–12 years in gorillas, 10–14 years in chimpanzees and bonobos, and 14–16 years in orangutans (Table 4). These differences reflect an additive effect of interspecific differences in age of maturity and duration of subfecundity. In general, reproductive rates correlate with the interspecific and interpopulation variation in age of first birth (Figure 5, r = 0.696, N = 14, p = 0.006 for wild populations), with mountain gorillas exhibiting the fastest reproduction and orangutans the slowest. However, compared to the other species, most populations of chimpanzees and bonobos have faster reproductive rates than their late age of first reproduction should predict. This could, in part, reflect the costs of dispersal on delaying first reproduction in these species (Walker et al. 2018). The Bossou chimpanzee study group, where first births are known only for non-dispersing females, is an outlier for chimpanzees, but conforms to the predicted pattern for the other apes (Sugiyama and Fujita 2011).
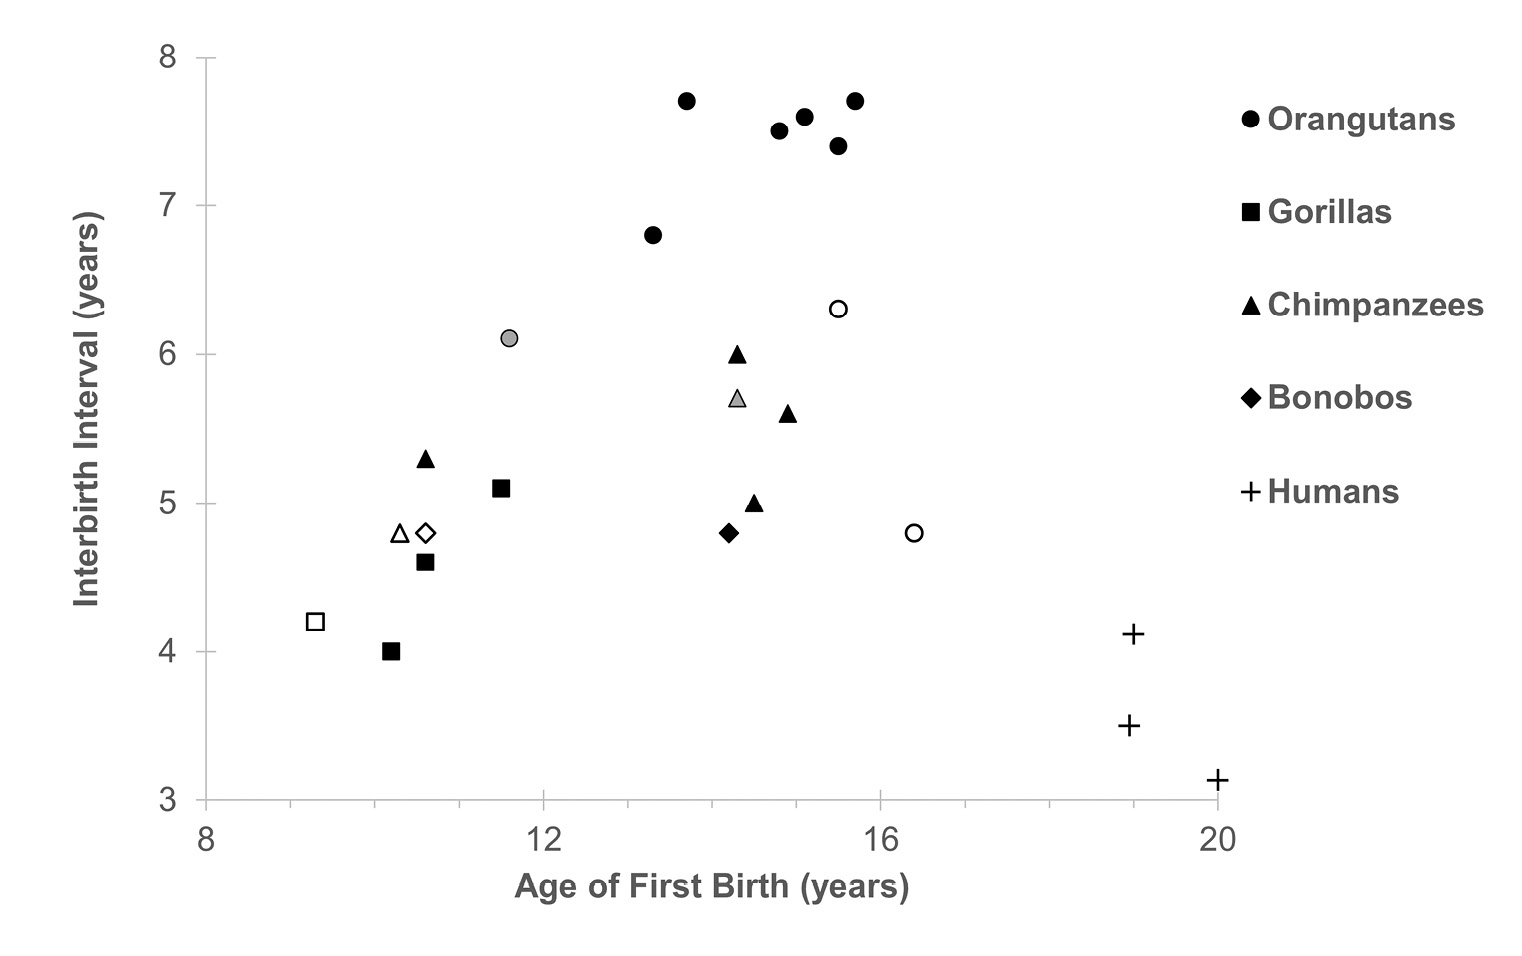
Fig. 5 Relationship between the length of interbirth intervals and age of first birth in great apes, using data from Table 4. Symbol shapes according to species. Closed symbols depict wild populations, open symbols captive populations, and gray symbols free-ranging provisioned populations. Among wild populations, r = 0.696, N = 14, p = 0.006. Human data (+) shown for comparison.
Fertility data for chimpanzees is the most comprehensive and shows remarkably little interpopulation variation: for seven populations of two subspecies, average intervals between births range from 5 to 6 years. Intrapopulation variation greatly exceeds interpopulation variation (Emery Thompson 2013b), and shows broad overlap with interbirth intervals of human populations (Emery Thompson and Ellison 2017). Birth rates of wild chimpanzees peak between ages 15–25 years, an earlier and less pronounced peak than is exhibited in human forager populations (Emery Thompson, Jones, et al. 2007).
The interval between births consists of a prolonged period of postpartum amenorrhea, a shorter period of cycling to conception, and gestation. Most of the variation in interbirth intervals within and between species occurs during postpartum amenorrhea, which typically comprises 60–80% of the interbirth interval. Thus, interbirth intervals following the deaths of unweaned offspring are substantially shorter than those when the previous offspring survives (Harcourt et al. 1980; Furuichi et al. 1998; Emery Thompson, Jones, et al. 2007; Wich, de Vries, et al. 2009). However, bonobos exhibit unusually early resumption of cycling, followed by an unusually long period of cycling (Kano 1992; Furuichi and Hashimoto 2002). This pattern also has been observed in West African chimpanzees at Taï (Deschner and Boesch 2007). Since data on West African chimpanzees are available only for this one population, it is not yet clear whether this is a subspecies-typical pattern, or if they exhibit an extreme of interpopulation variation across chimpanzees. The functional significance of this difference is yet unclear, but it has been hypothesized that a longer period of cycling may reduce sexual coercion or increase the benefits of promiscuous mating (Wrangham 2002; Deschner and Boesch 2007).
Variation in fertility among chimpanzees has been attributed to temporal and interindividual variation in dietary quality and/or female energy balance (Emery Thompson 2013b), which affects occurrence of sexual cycles (Anderson, Nordheim, and Boesch 2006), ovarian hormone production (Emery Thompson, Wrangham, and Reynolds 2006; Emery Thompson, Kahlenberg, et al. 2007; Emery Thompson and Wrangham 2008; Emery Thompson, Muller, and Wrangham 2014), waiting time to conception (Emery Thompson and Wrangham 2008), and duration of postpartum amenorrhea (Emery Thompson, Muller, and Wrangham 2012). Similar effects are suggested for at least one population of wild orangutans, where ovarian hormones and conceptions peak during peaks in food availability (Knott 1999; Knott 2001; Knott, Emery Thompson, and Wich 2009). The influences of energy availability are reflected in markedly accelerated reproductive rates in captive versus wild great apes (Table 4). Interspecific variation in interbirth intervals is still evident among well-fed captive populations, so reproductive rates are likely to have a strong genetic component. However, these differences may still be long-term adaptations to feeding ecology, promoting more conservative reproductive effort in response to chronic resource instability. Mountain gorillas have the most stable food base and the shortest birth intervals, while orangutans have the most unstable food base and the longest birth intervals. Western gorillas pursue a more chimpanzee-like diet than do mountain gorillas at Karisoke, and they have correspondingly longer birth intervals. Bonobos pursue a more gorilla-like diet than do chimpanzees and have correspondingly shorter birth intervals. Early reports from orangutans proposed the reverse: longer birth intervals in Sumatran versus Bornean orangutans were suggested to result from more productive Sumatran forests, perhaps as a transition to a slower overall life history (Marshall et al. 2009; Wich et al. 2011; Skinner 2014). However, newer comprehensive analyses indicate that the birth intervals of the two species are statistically indistinguishable (van Noordwijk et al. 2018). Captive orangutans exhibit a small but significant species difference in the opposite direction, with longer birth intervals in captive-born individuals from the Bornean species (Anderson et al. 2008). Neither captive nor wild studies detect significant differences in other demographic variables between Bornean and Sumatran orangutans, supporting a general conclusion that these species have not experienced divergence in life history evolution (Anderson et al. 2008; Knott, Emery Thompson, and Wich 2009; Wich, de Vries, et al. 2009; van Noordwijk et al. 2018).
Comparative reproduction in human populations is often estimated using completed fertility, which is the sum of all age-specific fertility rates. This statistic assumes survival to the end of the reproductive period. By this metric, completed fertility in wild chimpanzees and mountain gorillas would be approximately 8 infants per female (calculated from: Karisoke gorillas, Robbins et al. 2006; multi-site chimpanzee sample, Emery Thompson, Jones, et al. 2007), as high as many high-fertility human populations. This is clearly misleading because most wild great apes do not live through their potential fertility. If mortality is considered, each chimpanzee female born in a multi-site sample (Emery Thompson, Jones, et al. 2007) would be expected to produce 2.53 infants (a net reproductive rate of 1.27 daughters), while the net reproductive rate for the largest chimpanzee sample at Gombe is only 0.745 daughters per female (Bronikowski et al. 2016b). The net reproductive rate of mountain gorilla females at Karisoke is estimated at 1.918 daughters per female (Bronikowski et al. 2016b). Those chimpanzee and gorilla females who live long enough to reproduce at all may be expected to produce approximately 3–5 surviving offspring (Yamagiwa and Kahekwa 2001; Robbins et al. 2007a; Emery Thompson 2013b). Given that a large proportion of females do not live to reproduce at all, most great apes hover dangerously close to the replacement levels of fertility necessary for population viability.
Humans and the other great apes share derived characteristics of the reproductive system that distinguish them from many other primates (Emery Thompson 2013a, 2013b; Emery Thompson and Ellison 2017). These differences include not only the physiological systems governing the reproductive process (e.g., ovulation, pregnancy), but a generally cautious pace of reproduction in which fecundity is highly sensitive to energy availability. The unexpectedly faster rate of human reproduction may not have required major innovations in reproductive physiology but can have instead resulted largely by adaptation to enhanced energy availability for reproductive females, which is in turn a product of cognitive and social adaptations including cooking, tool use and cooperative foraging and hunting, division of labour, and food sharing (Hawkes et al. 1998; Kaplan et al. 2000; Kramer 2005; Wrangham and Carmody 2010; Reiches et al. 2009), as well as metabolic adaptations for higher energy throughput (Pontzer et al. 2016). For example, whereas male foragers increase their workload in order to provision offspring and directly supplement the energy budgets of reproductive women (Marlowe 2001), male great apes provide food for neither. Male chimpanzees have a net negative effect on the energetic status of their female associates (Emery Thompson, Muller, and Wrangham 2014), while association with males raises glucocorticoid levels of female orangutans (Kunz et al. 2020). While male gorillas protect and play with infants (Rosenbaum et al. 2018), and may even adopt orphans, infanticidal behaviour has extreme negative consequences for female reproductive success (Robbins et al. 2007b).
Female Aging and Fertility
The question of whether extended post-reproductive lifespans occur in the great apes is of central importance to evaluating hypotheses for the evolution of this feature in humans. Nevertheless, it continues to be debated whether a significant post-reproductive lifespan is a distinctly human trait (Pavelka and Fedigan 1991; Hawkes 2003; Alberts et al. 2013) or an extension of a trait common in other primates (Cohen 2004; Walker and Herndon 2008). Some of the debate hinges on the choice and definition of terms, such as “menopause”, “reproductive cessation”, “reproductive senescence”, “post-reproductive lifespan”, or “post-fertile viability”. There is also some fundamental disagreement on the appropriate question. Evolutionary anthropologists are largely concerned with the occurrence and length of the post-reproductive life stage and whether it specifically evolved due to its adaptive benefits. Gerontologists are concerned with mechanistic and evolutionary processes shaping fertility decline, regardless of whether this results in reproductive cessation. Theoretical biologists have focused on whether it is a logical expectation for somatic and reproductive lifespans to be tightly linked, or if post-reproductive lifespans are and should be the norm and subject to allometric scaling (Cohen 2004). To a certain extent, these perspectives can exist simultaneously, provided that the evidence, and their interpretations are accurately understood.
A variety of processes contribute to reductions in fertility with age, but the critical constraint on reproductive lifespan in humans is the exhaustion of the lifetime supply of ovarian follicles, the specific phenomenon that results in menopause. This process is not easily detected, thus various proxies are used, including presence of menstruation (also difficult to detect in wild apes), presence of sexual swellings (only readily observed in Pan), and demonstrated fertility. On the one hand, evidence of continued fertility, such as from population-level analysis of age-specific fertility rates, is difficult to misconstrue. However, many analyses, particularly for cross-species comparisons, rely on inference from the interval between last reproduction and death to calculate the proportion of individuals experiencing a post-reproductive lifespan and/or the proportion of the lifespan individuals spend in the post-reproductive stage. These criteria are applied inconsistently and introduce statistical bias (Levitis and Lackey 2011). Moreover, observations of amenorrhea or infertility in a small number of older apes cannot necessarily be attributed to the menopausal process, as little is known about other sources of secondary infertility, such as foetal loss, endometriosis, hormonal imbalances, or infections in the reproductive tract. A second hurdle comes from distinguishing menopause from the natural process of reproductive senescence, which leads to longer intervals between births. For example, in the Kanyawara community of wild chimpanzees, a female estimated to be in her early 60s had experienced over 8 years of amenorrhea following her last infant but began exhibiting sexual swelling cycles in the months before her death (personal observation). The influence of ill health on fertility is also underappreciated. A cross-population study of wild chimpanzees indicated that, even in their 30s, females who were close to death exhibited reduced fertility compared with healthy females (Emery Thompson, Jones, et al. 2007).
Signs of reproductive senescence in gorillas and chimpanzees are clear and consistent with reproductive aging in humans. Cycles gradually increase in length throughout adulthood and become more irregular, ovarian hormone levels decline, and birth rates decrease (Caro et al. 1995; Atsalis et al. 2004; Atsalis and Margulis 2006; Robbins et al. 2006; Emery Thompson, Jones, et al. 2007; Lacreuse et al. 2008). Some captive apes exhibit long acyclic periods at older ages (Atsalis and Margulis 2006). These data have been interpreted as data for perimenopause and menopause occurring prior to age 40 years in captive apes (Atsalis and Margulis 2006; Videan et al. 2006; Atsalis and Videan 2009). However, other captive facilities have reported continued menstrual cycling in nearly all individuals, suggesting the opposite — menopause is very rare (Lacreuse et al. 2008; Herndon and Lacreuse 2009). In one study of captive chimpanzees, only one of 20 females over the age of 39 years ceased cycling for longer than 12 months: she was 56 years old (Lacreuse et al. 2008).
Direct data on ovarian follicle depletion are available only for captive chimpanzees and one bonobo. In an early study of captive chimpanzees, six deceased females aged 35–48 had histological evidence of continued reproductive ability: primary follicles, recent luteal activity, and/or active endometria (Graham 1979). Two more recently histological analyses used larger samples. Based on different sample sizes and slightly different modelling approaches, one concluded that rates of follicular depletion in humans and chimpanzees were nearly indistinguishable (Jones et al. 2007), while the latter reported a faster rate of decline after age 35 years in humans, albeit with broadly overlapping confidence intervals (Cloutier, Coxworth, and Hawkes 2015). These specific conclusions should be treated with caution not only because the sample of relatively old chimpanzees is sparse but because chimpanzee follicle counts resulted from ovarian cross-sections, while human follicle counts were from whole ovaries. However, two essential points are clear. The ovaries of most (15 of 18) chimpanzee females over age 35 years (up to 49 years) had non-negligible counts of primordial follicles, suggesting continuing fertility to late ages. And, both chimpanzees and humans converge on an approximate age of follicular exhaustion near 50 years.
In humans, menopausal status can be detected by sustained, elevated levels of the gonadotropins LH and FSH and a decreased response to GnRH challenge (Wood 1994). One aged captive bonobo (the only examined, precise age unknown) exhibited menopausal ovaries and had both elevated gonadotropin levels and weak response to GnRH (Gould, Flint, and Graham 1981). The 47- and 48-year old chimpanzees in the same study responded normally to GnRH challenge and exhibited cyclic gonadotropin peaks, though they were less defined than in younger chimpanzees. A larger study of captive chimpanzees found declining LH and FSH levels among older females (Videan et al. 2006), but the significance of this pattern is unclear as it is opposite to that found in aging women. Notably, in vivo and post-mortem examinations of captive apes have sometimes shown structural abnormalities of the ovaries and reproductive tract that might interfere with reproductive function of some individuals independently of menopausal processes (Graham 1979; Loskutoff et al. 1991).
Relevant data from the wild are limited to observed births. Among Sumatran orangutans at Suaq Balimbing, interbirth intervals (N = 14) did not increase with age, and the three oldest females had recent births (at ages 38, 38, and 41–50 years: Wich et al. 2004). An analysis of 38 years of demographic data from the mountain gorilla population in the Virungas found that birth rates declined moderately in older age groups, but births to females in their late 30s and early 40s were observed (Robbins et al. 2006). As many as 25% females had terminal birth intervals that exceeded expectation, but the post-reproductive lifespan was trivial, approximately 1–3% of the total lifespan. Birth rates aggregated across six populations of chimpanzees also exhibited a clear pattern of reproductive senescence; interbirth intervals increased with age, but there was evidence for continued reproductive ability in females in their late 40s and even early 50s (Emery Thompson, Jones, et al. 2007). Birth rates declined to zero at approximately the same age that survivorship reached zero. Taken together, these data suggest that great apes experience a senescent process that can culminate in menopause in some individuals during the 5th or 6th decade of life, but that even in favourable conditions, few individuals live to see this transition. Post-reproductive viability in the great apes would appear to be too rare and too brief to have been a target for selection.
Comparisons across mammals indicates that as maximum lifespan increases, the duration of fertility fails to keep pace, suggesting that the “shelf-life” of oocytes is constrained (Huber and Fieder 2018). In accordance, the great ape data is consistent with the conclusion that the age of last reproduction has been largely conserved during human evolution, such that menopause is primarily the result of extended human lifespan (Hawkes 2003).
The great ape data suggest that the attraction of human men to young women (Buss 1989; Kenrick and Keefe 1992) is a derived feature linked to long-term pair bonding. Whereas men seeking marriage partners may be concerned with the years of fertility remaining, great ape males can be expected to allocate reproductive effort according to a female’s likelihood of bearing offspring in the immediate future, as well as her probability of successfully rearing them. In the absence of a long post-reproductive period, aging chimpanzee females not only retain their attractiveness, they actually become more attractive to males, earning more solicitations and inciting more vigorous male competition than younger females (Muller, Emery Thompson, and Wrangham 2006). In most nonhuman primates, young females are less attractive mates (Anderson 1986). Lengthy sub-fecund periods of nulliparous females may deter males from expending mating effort on them. In both chimpanzees and gorillas, females also experience a particularly long interval between first and second births (Jones et al. 2010; Robbins et al. 2006), perhaps because early reproductive effort competes with the last years their own growth. Additionally, older mothers are expected to produce higher quality offspring due to prior maternal experience, increased access to resources, and/or stronger social ties. Like many other primates, first-born mountain gorilla infants have significantly higher mortality than later-born infants (Robbins et al. 2006). This is not true of chimpanzees, despite the low rank of primiparous mothers, perhaps because primiparous mothers are more solicitous of their infants (Stanton et al. 2014). Because birth rates decline at later ages, chimpanzees born to older mothers receive longer periods of investment and experience less sibling competition, positively impacting their growth (Emery Thompson et al. 2016). On the other hand, without a prolonged post-reproductive period, older ape mothers pose a higher risk of orphaning dependent infants.