15. Kenya: Free Primary and Day Secondary Education Policies and Their Contributions to Learning at the Bottom of the Pyramid
© 2022 Manyasa and Karogo, CC BY-NC 4.0 https://doi.org/10.11647/OBP.0256.15
Introduction
The 2000 United Nations (UN) Millennium Declaration highlighted universal primary education as one of eight global goals, which led to unprecedented enrollment of children in primary school. In response to these Millennium Development Goals (MDGs), Kenya implemented Free Primary Education (FPE) in 2003, with significant support from multilateral development partners. Both the UN and the Kenyan government sought to address the challenge of intergenerational transmission of illiteracy, marginalization, and poverty.
FPE implementation significantly increased access to primary school. The Gross Enrollment Rate (GER) in primary school rose from 88.2 percent in 2002 to 103.21 percent in 2016. Among those who enrolled was the late Kimani Maruge, who holds the Guinness World record for being the “oldest person to begin primary school” at age 84. Buoyed by this success, the government implemented Free Day Secondary Education (FDSE) in 2008. As a result, GER in secondary school rose from 41.9 percent in 2009 to 58.2 percent in 2014. More recently, the government implemented the 100 percent transition policy, pushing up the primary to secondary transition rate from 76.1 percent in 2014 to 83.3 percent in 2018 (Republic of Kenya, 2019).
MDG2 (primary-school access) was largely achieved, but there is no evidence that the core mission for universalizing basic education and learning was. Indeed, Uwezo learning assessments have consistently reported low learning outcomes among children aged 6–16 years in the country. In 2015, up to eight percent of children exiting primary school had not acquired the basic literacy and numeracy competencies expected of a Grade 2 child. Without learning, universal schooling will not disrupt the intergenerational transmission of illiteracy, marginalization, and poverty. Indeed, it might contribute to the polarization of society by widening the learning gaps and the attendant social dysfunction (Manyasa, 2015). Yet the learning crisis is not just a Kenyan phenomenon. It is a global problem (Bashir et al., 2018), a fact that informed the formulation of the Sustainable Development Goal (SDG) 4 as part of the broad 2030 Global Development Agenda. SDG4 acknowledges the fact that schooling is not the same as learning.
In this chapter, we explore whether the FPE policy is contributing to quality learning for all. We use the Kenya Certificate of Secondary Education (KCSE) examination results for 2017–2019 to demonstrate that universal schooling at the basic level, implemented without a deliberate mechanism to ensure equitable learning opportunities, may still marginalize those at the bottom of the pyramid. We draw on a rich family of sorting models to analyze and interpret secondary school data to achieve the following objectives:
- Establish the relationship between the type of primary school attended and the category of public secondary school attended by learners;
- Establish the relationship between the category of secondary school attended and the performance of learners in the national examinations at the secondary-school level; and
- Determine the equity implications of FPE as currently implemented in Kenya for the children at the bottom of the learning pyramid.
We demonstrate that children at the bottom of the pyramid constitute a significant proportion of all children, and yet despite being in school, their learning levels remain low. According to Uwezo (2016), a Grade 3 pupil in a private school in Kenya was twice as likely to successfully complete a Grade 2 task as a pupil in the same grade in a public school. We highlight the steady decline in budgetary allocation to the Ministry of Education (MOE) as a percentage of total government spending from 21.3 percent in the financial year 2013/14 to 8.8 percent in the year 2020/21 (Republic of Kenya, 2019; 2020). Additionally we argue that implementation of FPE and FDSE in an environment of diminishing budgetary support may deepen the learning poverty of those at the bottom of the pyramid.
Theoretical framework
Manyasa (2015) underscores the impact of the FPE policy on sorting children, based on household poverty, into public and private primary schools. This view differs from Kremer (1997), who studied the effect of sorting in marriage and neighborhoods and assessed parental and neighborhood effects on steady-state inequality, as proxied by the standard deviation in educational attainment. By measuring educational attainment in years of schooling, Kremer (1997) found that “changes in sorting will have only a small impact on steady-state inequality of characteristics that are only moderately heritable, such as education and income”. He concluded that inequality is insensitive to sorting and, further, that sorting has been declining.
According to his model, sorting would have a greater effect on the distribution of the quality of schooling if it was based on the individual rather than parental characteristics. It is further argued that: “Since sorting increases the intergenerational correlation of education, inequality among dynasties will be more sensitive to sorting than inequality among individuals” (Kremer, 1997, p. 128). Thus, he concludes that sorting is an insignificant factor that has received undue attention in inequality discourse.
This view is not shared by Fernandez and Rogerson (2001). In a model that includes the ability to borrow against a child’s future income, they argue that sorting affects inequality except in circumstances where it does not affect the families’ credit constraint. Their model also includes the price of skill, which is not included in Kremer (1997). They postulate that the price of skill is determined by three factors: “the existence of a nonlinear relationship between parental years of education and those of their children; a negative correlation between fertility and parental education; and wage rates that are sensitive to changes in the skill” (Fernandez & Rogerson, 2001, p. 1330).
Fernandez and Rogerson argue that, when parents are unable to borrow against their children’s future income, they are constrained financially in investing in their children’s education. This makes parental income an important factor in children’s access to “quality education”. It is this constraint that the Kenyan FPE and FDSE policies may have sought to remove, but the current quality gaps between public and private primary schools, as well as sub-county and higher-ranked secondary schools, indicate that the policies may in fact have tightened the constraint. This may be the case due to the worsening quality of education in the schools where children of the poor go, yet according to Psacharopoulos (1984), quality of education, however it is measured, has an impact on children’s learning and later, earnings.
Methodology
This study utilized secondary data consisting of the KCSE examination results for the candidates whose scores were in the top and bottom 25 percent across three years: 2017, 2018, and 2019. Both descriptive and inferential statistics were obtained and are presented in the next section. For inferential analysis, we fitted a Poisson regression model to assess the relationship between KCSE performance against a student’s gender, age, KCPE score (marks), secondary-school type (national, county, extra-county, sub-county, and special), primary-school category (rural-public, urban-public, and private), KCPE exam year, and a binary variable to show whether the student repeated grades. To fit the KCSE grades in a Poisson count model, the grades were assigned corresponding values equivalent to their assessment strength, where grades A, A-, B+ ... D, D-, and E were assigned numerical values 12, 11, 10 … 3, 2, 1, respectively. By fitting a Poisson regression model, we assumed that the response variable (KCSE grade) assumes a count variable where the lowest grade, E, is assigned lowest count (1) and the highest grade, A, is assigned highest count (12).
Letting y1, y2 ... yn be the KCSE grades from n students, we assumed that these sample random observations can be treated as a realization of independent Poisson random variables and fitted a Poisson model shown by Equation (1).
Yi ~ P(µi)………………………. (1)
where µi is the mean and variance of a Poisson distribution. The mean vector µi depends on the explanatory variables Xi. A simple Poisson regression model can be expressed in the form given by Equation (2).
log (µi) = Xiβ…………………. (2)
where β is a vector of coefficients and X is a matrix consisting of data from the explanatory variables. By mimicking the ordinary regression equation, the Poisson Equation (2) can be expressed as Equation (3).
µi = exp{Xiβ}…………………. (3)
Thus, the fitted Poisson model is used to assess the effect of different learning and demographic characteristics on the probability of the student scoring one grade higher.
Empirical findings
We analyze the performance of 901,128 secondary-school leavers who sat KCSE examinations in the years 2017–2019, and were either in the top or bottom 25 percent of the performance table. We depart from the assumption that the KCSE results follow a normal distribution. This then means that the bottom 25 percent forms the bottom of the pyramid, while the top 25 percent is the top of the pyramid, with the remaining 50 percent forming the middle of the pyramid. Therefore, the learners whose KCSE scores put them in the bottom 25 percent are the main focus of this analysis, but the top 25 percent are useful to contextualize the discussion of the findings. Table 1 shows the analyzed school-leavers’ distribution among three types of primary schools, with the majority attending rural-public schools (65.8 percent), followed by private schools at 20.3 percent, and urban-public schools at 13.9 percent. The distribution is stable across the three years under consideration (see Table 1).
Table 1. Distribution of school leavers by type of primary school attended and KCSE examination year.
|
Primary school type |
2017 |
2018 |
2019 |
Total |
||||
|
No. |
% |
No. |
% |
No. |
% |
No. |
% |
|
|
Private |
54,147 |
20.6 |
62,801 |
20.1 |
66,088 |
20.3 |
183,036 |
20.3 |
|
Public (U) |
37,393 |
14.2 |
43,298 |
13.8 |
44,592 |
13.7 |
125,283 |
13.9 |
|
Public (R) |
171,775 |
65.2 |
206,544 |
66.1 |
214,490 |
66.0 |
592,809 |
65.8 |
|
Total |
263,315 |
100.0 |
312,643 |
100.0 |
325,170 |
100.0 |
901,128 |
100.0 |
Table 2 shows consistent over-representation of the school leavers who attended rural-public primary schools in the bottom quarter of KCSE examination performance, and over-representation of those who attended private primary schools in the top quarter. Across the three years, secondary-school leavers who attended rural-public primary schools account for over 75 percent of the bottom achievers in KCSE examinations, which is higher than their overall percentage in the population of approximately 66 percent. Those who attended private primary schools account for approximately 11 percent of the bottom achievers, against their overall percentage in the population of 20.3 percent. Those who attended urban-public primary schools account for a proportionate percent of both bottom and top achievers to their overall percentage in the population under study. It is important to note here that most urban-public primary schools are expensive, and many of them are located in affluent parts of cities, thus attracting children from households that differ significantly from those of their rural counterparts.
Table 2. KCSE mean score distribution between top and bottom performance quarters by type of primary school attended.
|
KCSE level |
2017 |
2018 |
2019 |
|||||||||
|
Priv. |
Pub ® |
Pub (U) |
Total |
Priv. |
P®(R) |
Pub (U) |
Total |
Priv® |
Pub (R) |
Pub (U) |
Total |
|
|
Bottom |
11.0 |
76.0 |
13.0 |
100 |
11.4 |
75.4 |
13.1 |
100 |
11.4 |
75.5 |
13.1 |
100 |
|
Top |
30.5 |
54.0 |
15.5 |
100 |
28.9 |
56.6 |
14.6 |
100 |
29.2 |
56.5 |
14.3 |
100 |
|
Total |
20.6 |
65.2 |
14.2 |
100 |
20.1 |
66.1 |
13.8 |
100 |
20.3 |
66.0 |
13.7 |
100 |
Table 3 and Figure 1 show the distribution of the study population by Kenya Certificate of Primary Education (KCPE) examination marks and type of primary school attended. Table 3 shows that, while private primary schools were attended by 20.3 percent of the school leavers in this study, they account for 72.7 percent of those who scored over 400 in KCPE examinations, and only 8.9 percent of those who scored less than 200. This contrasts sharply with school leavers who attended rural-public schools, who account for 65.8 percent of the population under study, but account for only 16.4 percent of those who scored over 400, and 75.8 percent of those who scored less than 200.
Table 3. Distribution of study population by KCPE examination marks and type of primary school attended.1
|
School categories |
>400 |
350–399 |
250–299 |
200–249 |
<200 |
Total |
|
Private |
72.7 |
47.4 |
12.7 |
9.4 |
8.9 |
20.3 |
|
Rural-public |
16.4 |
37.8 |
74.3 |
78.2 |
75.8 |
65.8 |
|
Urban-public |
10.9 |
14.9 |
13.0 |
12.5 |
15.3 |
13.9 |
|
Total |
100 |
100 |
100 |
100 |
100 |
100 |
Figure 1, on the other hand, shows that among the school leavers in this study, 10.5 percent of those who attended private primary schools scored over 400 marks on the KCPE examinations, compared to only 0.7 percent of their compatriots who attended rural-public schools. The figure also shows that 60 percent of those who attended private primary schools scored 350 and above, compared to 12.4 percent of those who attended rural-public primary schools, and attained similar marks. Importantly, however, the figure shows that while 24.4 percent of the private-schoolers scored below 250 marks (which is the pass mark), 60.7 percent of rural-public-schoolers failed to reach this pass mark, with 23.3 percent of them scoring below 200 marks.
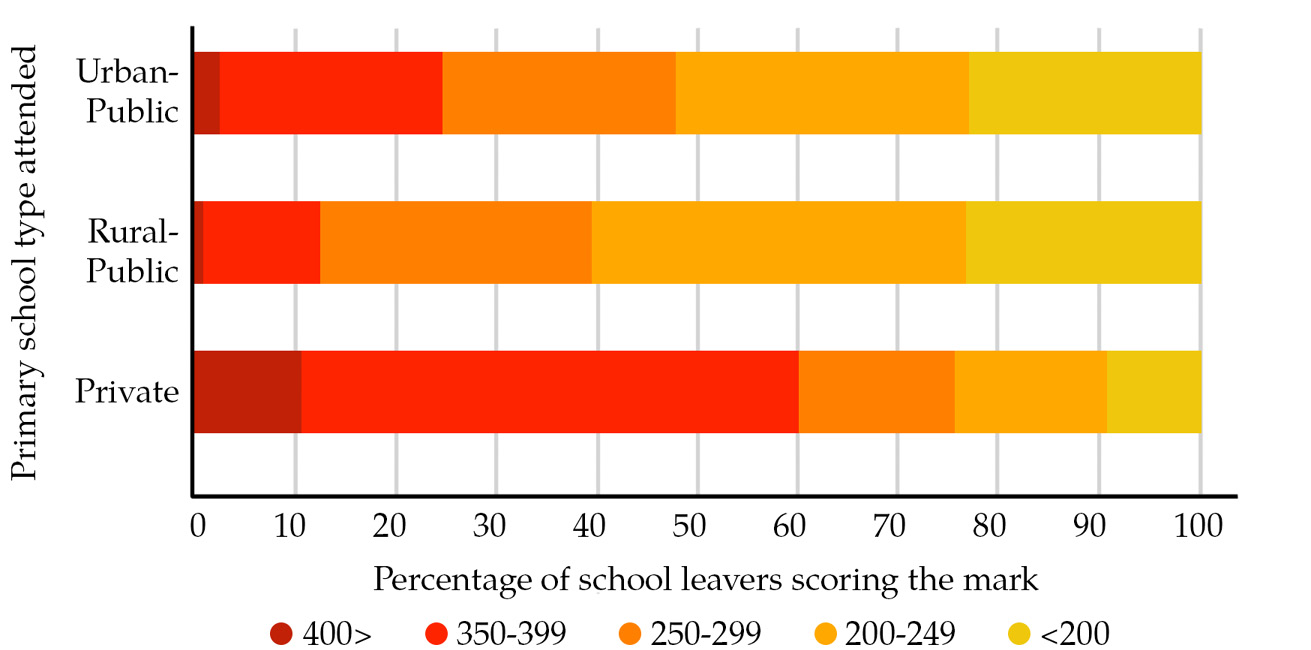
Fig. 1. Distribution of study population by KCPE examination scores and type of primary school attended.
The marks scored in primary school have implications for the secondary-school mean grade, as indicated in Table 4 and Figure 2. From Table 4, the color green shows the school leavers who qualified for university, orange indicates those that were within the top 25 percent but did not qualify for university, and red indicates those in the bottom quarter in the KCSE examinations performance for the respective KCPE examination score brackets. The table shows that, on aggregate, 23.4 percent and 63.7 percent of the study population qualified to join university and fell in the bottom quarter of KCSE examinations performance, respectively. However, 95.1 percent of those who scored at least 400 marks on the KCPE examination qualified to join university, compared to 0.1 percent of those who scored below 200 marks. Conversely, 99.6 percent of those who scored less than 200 marks in KCPE examinations fell in the bottom quarter in KCSE examination performance, compared to 0.1 percent who scored at least 400 marks.
Table 4. KCSE mean grade distribution by marks scored in KCPE examinations.
|
KCSE mean grade |
KCPE examination score |
|||||
|
>400 |
350–399 |
250–299 |
200–249 |
<200 |
Total |
|
|
A |
4.2 |
0.2 |
0.0 |
0.0 |
0.0 |
0.2 |
|
A- |
25.1 |
4.3 |
0.0 |
0.0 |
0.0 |
1.6 |
|
B+ |
26.7 |
12.1 |
0.3 |
0.0 |
0.0 |
3.3 |
|
B |
19.7 |
18.6 |
2.0 |
0.1 |
0.0 |
4.9 |
|
B- |
12.1 |
21.0 |
5.5 |
0.4 |
0.0 |
6.1 |
|
C+ |
7.3 |
20.5 |
10.9 |
0.9 |
0.1 |
7.3 |
|
Sub-Total |
95.1 |
76.7 |
18.7 |
1.4 |
0.1 |
23.4 |
|
C |
3.7 |
16.5 |
17.3 |
1.6 |
0.1 |
8.2 |
|
C- |
1.1 |
6.3 |
12.2 |
1.2 |
0.2 |
4.7 |
|
Sub-Total |
4.8 |
22.8 |
29.5 |
2.8 |
0.3 |
12.9 |
|
D- |
0.1 |
0.5 |
49.0 |
85.2 |
59.3 |
51.3 |
|
E |
0.0 |
0.0 |
2.9 |
10.7 |
40.3 |
12.4 |
|
Sub-Total |
0.1 |
0.5 |
51.9 |
95.9 |
99.6 |
63.7 |
|
Total |
100 |
100 |
100 |
100 |
100 |
100 |
Table 5 shows the distribution of KCSE examination mean grades by category of secondary school attended by the population under study. The green shows the school leavers who fell in the top 25 percent, and red indicates those in the bottom quarter in KCSE examination performance for the respective secondary-school category attended. Among those who attended national secondary schools, 97.1 percent fell in the top performance quarter, while 2.9 percent fell in the bottom performance quarter. For those who attended sub-county schools, the lowest-rated public-secondary-school category, 27.2 percent fell in the top quarter while 72.8 percent fell in the bottom quarter.
Table 5. Distribution of KCSE mean grade by category of secondary school attended.
|
KCSE mean grade |
National |
Extra-county |
County |
Sub-county |
|
A |
1.3 |
0.1 |
0 |
0.0 |
|
A- |
9.9 |
2.1 |
0.2 |
0.1 |
|
B+ |
15.8 |
6.9 |
1.4 |
0.6 |
|
B |
18.2 |
12.9 |
4.6 |
1.9 |
|
B- |
17.1 |
17.8 |
9.2 |
4.1 |
|
C+ |
15.8 |
22.1 |
14.5 |
6.5 |
|
C |
13.6 |
23.7 |
19.8 |
8.4 |
|
C- |
5.4 |
10.3 |
13.8 |
5.6 |
|
Sub-Total |
97.1 |
95.9 |
63.5 |
27.2 |
|
D- |
2.2 |
3.8 |
32.8 |
60.5 |
|
E |
0.7 |
0.3 |
3.7 |
12.3 |
|
Sub-Total |
2.9 |
4.1 |
36.5 |
72.8 |
|
Total |
100 |
100 |
100 |
100 |
Figure 2 shows that 14.9 percent of the population under study who attended private primary schools also attended national secondary schools, while 20.1 percent of private primary-schoolers attended sub-county secondary schools. This contrasts sharply with rural-public primary-schoolers, among whom only 4.3 percent attended national secondary schools and 63 percent attended sub-county secondary schools. We underscore the fact that sub-county secondary schools educate most of the children who come from public primary schools, while most of those who come from private primary schools end up either in the national or extra-county secondary schools. Although allocation of spaces in the secondary schools is purely meritocratic, it ignores the differential learning opportunities that children in public and private primary schools are exposed to. This underlies the observed fact that most children from poor households wind up in sub-county secondary schools, which are generally low-performing. This is a significant equity issue of concern in light of the performance gap between these two sets of secondary schools, as indicated in Table 5.
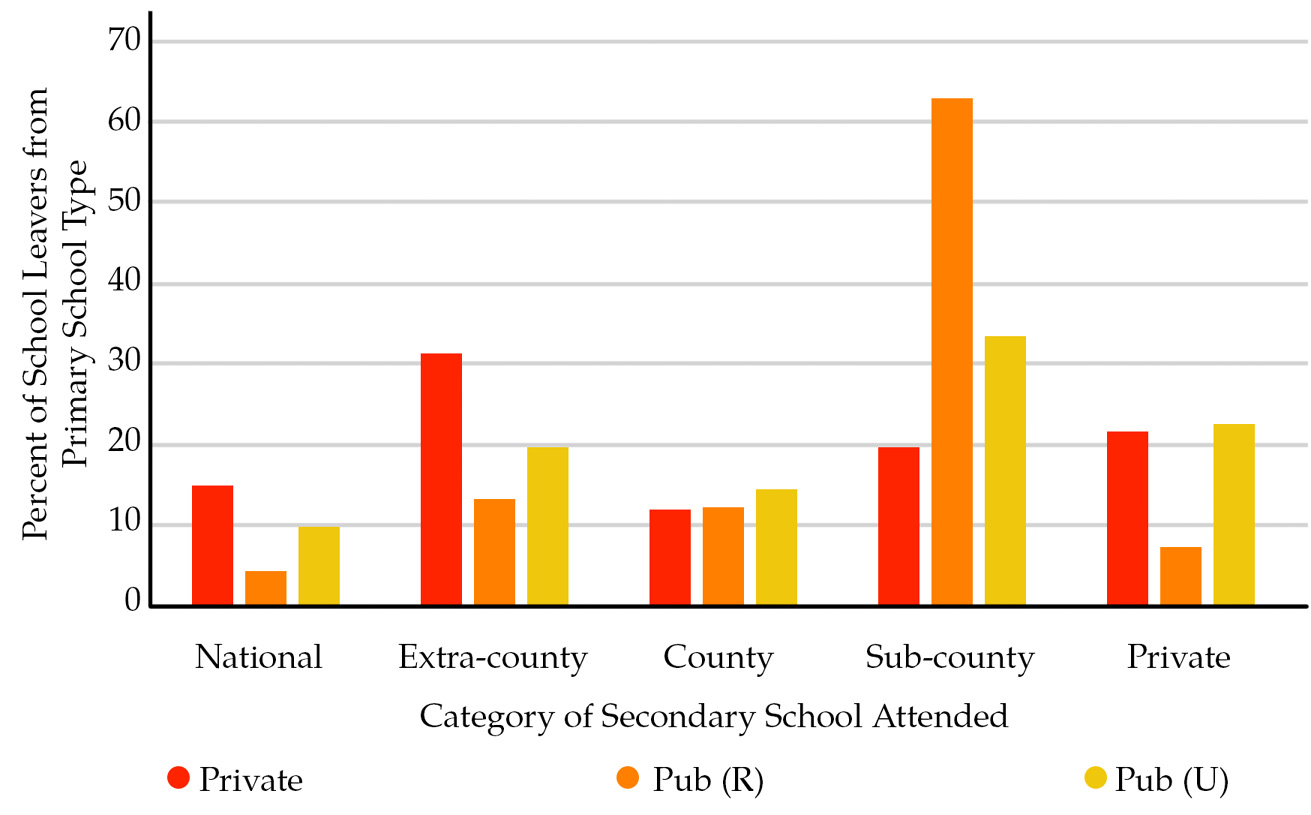
Fig. 2. Distribution of school leavers by type of primary and category of secondary schools attended.
Table 6 shows that 41.9 percent, 39.2 percent, and 18.9 percent of the school leavers who attended national secondary schools had attended private, rural-public, and urban-public primary schools, respectively. In contrast, 8.1 percent, 82.6 percent, and 9.3 percent of those who attended sub-county secondary schools had attended private, rural-public, and urban-public primary schools, respectively.
Table 6. Distribution of the study population by type of primary and category of secondary schools attended.
|
Secondary-school category |
Primary school attended |
|||
|
Private |
Pub (R) |
Pub (U) |
Total |
|
|
National |
41.9 |
39.2 |
18.9 |
100 |
|
Extra-county |
36.0 |
48.6 |
15.4 |
100 |
|
County |
19.4 |
64.5 |
16.1 |
100 |
|
Sub-county |
8.1 |
82.6 |
9.3 |
100 |
|
Private |
35.6 |
39.1 |
25.3 |
100 |
We also analyze two other important policy issues from the data: grade repetition and age of learners, to assess their impact on school leavers’ KCSE examination results. An estimated 11.6 percent, 11.1 percent, and 14.5 percent of those who attended private, urban-public, and rural-public primary schools respectively repeated at least one grade during their secondary education. The difference in repetition rate was insignificant across the primary school types attended. However, from the regression results in Table 7, being a repeater increases the chances of achieving one grade higher by 37 percent, and the difference is statistically significant. This finding contradicts the basis of the government’s non-repetition policy that prohibits learners from repeating grades.
The school leavers in this study ranged from 15 years to over 25 years old. The age range violates the MOE age guidelines, which expect learners to join primary school at the age of 6 and complete Form 4 at the age of 18. 15-year-olds are proportionately represented in the bottom quarter, 16- and 17-year-olds are under-represented in the bottom quarter, while the rest are over-represented. The extent of over-representation increases with age, with 24-year-olds being over-represented by up to five times and the 25-and-older group being over-represented by more than five times in the bottom quarter. This finding is corroborated by the regression results in Table 7. From the results, one more year on the age of the learner decreases the chances of achieving one grade higher by seven percent, other factors held constant. This finding is statistically significant.
Table 7. Regression model results based on Poisson Regression Model (probability of getting higher grade).
|
Factor |
Incidence rate |
p-value |
95% Conf. interval |
||
|
Gender of the student (ref: female) |
|||||
|
Male |
1.04 |
0.000 |
1.03 |
1.04 |
|
|
KCSE category (ref: county) |
|||||
|
Extra-county |
1.02 |
0.000 |
1.02 |
1.03 |
|
|
National |
1.04 |
0.000 |
1.03 |
1.04 |
|
|
Private |
0.91 |
0.000 |
0.91 |
0.92 |
|
|
Sub-county |
0.95 |
0.000 |
0.95 |
0.96 |
|
|
Private |
1.09 |
0.000 |
1.08 |
1.09 |
|
|
Urban-public |
1.08 |
0.000 |
1.08 |
1.09 |
|
|
KCSE grade category (Ref: >400) |
|||||
|
350–399 |
0.83 |
0.000 |
0.82 |
0.83 |
|
|
250–299 |
0.48 |
0.000 |
0.47 |
0.48 |
|
|
200–249 |
0.26 |
0.000 |
0.26 |
0.27 |
|
|
<200 |
0.21 |
0.000 |
0.21 |
0.21 |
|
|
Age of the student |
0.93 |
0.000 |
0.93 |
0.93 |
|
|
Repeating a grade (Ref: no) |
|||||
|
|
Yes |
1.37 |
0.000 |
1.36 |
1.37 |
These findings also show a statistically significant gender gap in performance among the study population. Boys have a 4 percent probability of scoring a grade higher than girls. Similarly, with rural-public primary schools as the base category for the primary school attended, attending a private and an urban-public primary school increases one’s chances of scoring a grade higher by nine percent and eight percent, respectively. With county schools as the base category for secondary school attended, attending an extra-county school and a national school increases one’s chances of scoring a grade higher by two percent and four percent respectively. Conversely, attending a sub-county or a private secondary school increases one’s chances of scoring a grade lower by five percent and nine percent respectively. These findings are statistically significant
With the cohort that scored more than 400 on the KCPE examinations as the base group, scoring between 350 and 399 increases one’s chances of scoring a grade lower by 17 percent; scoring between 250 and 299 increases one’s chances of scoring a grade lower by 52 percent; scoring between 200 and 249 increases one’s chances of scoring a grade lower by 74 percent; and scoring less than 200 increases one’s chances of scoring a grade lower by 79 percent. These findings are also statistically significant.
Conclusion
We define children at the bottom of the learning pyramid as those who would not attend school without the government’s free education policies. While Kenyan government policies have facilitated children’s access to school, the findings of this study tell a simple story about learning for these children: there is little learning happening in their early years of schooling, and this problematic start to education exacerbates the initial disadvantages into a burden which they will carry with them for their entire school journey. The children who would otherwise have been out of school due to their inability to pay school fees are in school thanks to the free education policy of the government. But parents of these children are only able to send them to public primary schools or the poorly equipped and staffed low-cost private schools (which unfortunately we could not separate from other private schools due to data limitations). They learn much less compared to their counterparts in private schools, perform comparatively dismally in KCPE examinations, and get placed in the lowest-ranked secondary schools, which are also often poorly equipped and staffed.
Two factors direct children at the bottom of the pyramid into these sub-county secondary schools: low KCPE examination marks that limit their choice of secondary school, and their inability to pay fees. This leaves them with the option of FDSE, accessible through day/sub-county secondary schools. Once in these ill-equipped and often inadequately staffed schools, and given the weak academic foundation bequeathed by their primary schools, these disadvantaged children learn less than they should and find it hard to excel in KCSE examinations. As Fernandez and Rogerson (2001, p. 1312) argue: “This would then affect both the amount of human capital obtained from high school attendance and the probability that the child attends college”. Indeed, our findings illustrate how low the probability of qualifying for university is, having attended a rural-public primary school.
Failure to qualify for university education, which is highly subsidized by the state, augments the initial disadvantage by tightening the households’ borrowing constraints. These findings illustrate the fact that, under the FPE and FDSE policies as currently implemented, “…schooling is open to all children in the society but acquisition of vital skills remains a preserve of those from privileged households, who can afford private school fees” (Manyasa, 2015). The implication of this is failure to achieve SDG4 despite increasing enrollments, but more importantly it is the imminent failure to realize the core mission of education as envisaged at Kenya’s founding, and further elucidated in the country’s Vision 2030.
Given the pivotal role of formal education in social mobility (Becker, 1964; Psacharopoulos, 1984; Romer, 1990; Fernandez & Rogerson, 2001; Desjardins & Schuller, 2006; Martin & Pimhidzai, 2013; McKnight, 2015), we argue that this state of affairs is unsustainable. Indeed, it is inconsistent with the Global 2030 Development Agenda, which is built on a vision of shared prosperity.
In light of these outcomes, we suggest three possible solutions to ensure that well-intentioned government interventions deliver equitable learning opportunities for all children in Kenya, especially those afflicted most by learning poverty: first, there is a need for a comprehensive review of FPE and FDSE policies as currently implemented. This is to identify systemic and conceptual gaps in their design that may have been overridden by their political popularity, but which may be undermining their efficacy. Second, there is a need to redesign the programs implemented under these policies with a clear focus on equity. The programs currently lay more emphasis on promoting access, which we have demonstrated in this paper to be an incomplete solution to the problems underpinning learning poverty and increasing inequity. Third, we suggest a review of the education financing model implemented by the government. This will help to refocus government investments to ensure efficient and optimal utilization of the scarce public resources invested in the sector for those most in need.
References
Bashir, S., Lockheed, M. E., Ninan, E., & Tan, J. (2018). Facing forward: Schooling for learning in Africa. Washington, DC: World Bank.
Becker, G. S. (1964). Human capital: A theoretical and empirical analysis, with special reference to education. New York: NBER.
Desjardins, R., & Schuller, T. (2006). Understanding the social outcomes of learning. In OECD (Ed.), Measuring the social effects of education on health and civic engagement: Proceedings of the Copenhagen symposium (pp. 11–18). Paris: OECD.
Fernández, R., &. Rogerson, R. (2001). Sorting and long-run inequality. The Quarterly Journal of Economics, 116(4), 1305–1341.
Kremer, M. (1997). How much does sorting increase inequality? The Quarterly Journal of Economics, 112(1), 115–139.
Manyasa, E. (2015). Schooling without learning: The long-term implications of free primary education for income and welfare inequalities in Kenya. In N. Aworti & H. Musahara (Eds.), Implementation of millennium development goals: progresses and challenges in some African countries. Addis Ababa: Ossrea.
Martin, G. H., & Pimhidzai, O. (2013). Education and health services in Kenya: Data for results and accountability. New York: World Bank.
McKnight, A. (2015). Downward mobility, opportunity hoarding and the ‘glass floor’. Centre for Analysis of Social Exclusion (CASE), London School of Economics.
Psacharopoulos, G. (1984). The contribution of education to economic growth: International comparisons. In J. W. Kendrick (Ed.), International comparisons of productivity and causes of the slowdown (pp. 335–355). American Enterprise, Ballinger.
Republic of Kenya. (2019). Medium term expenditure framework 2020/21–2022/23 (2019 Education Sector Report). Nairobi: Government Printers.
Republic of Kenya. (2020). 2020/2021 Estimates of recurrent expenditure of the Government of Kenya for the year ending 30th June, 2021 (Vol. I, Votes R1011 – R1162). Nairobi: Government Printers.
Romer, P. (1990). Endogenous technological change. Journal of Political Economy, 98, 71–102.
Uwezo. (2016). Are our children learning? Uwezo Kenya Sixth Learning Assessment Report. Nairobi, Twaweza East Africa.
1 Note that the table does not include children whose KCPE marks were in the range of 300–349. This is because none of them fell in either the bottom or top quarters in their KCSE performance. The table also does not have any candidates who scored mean grade D and D+ because the candidates with those grades fell in the middle 50 percent in their KCSE performance.