16. Kenya: Disability and Learning at the Bottom of the Pyramid
© 2022 Chapter Authors, CC BY-NC 4.0 https://doi.org/10.11647/OBP.0256.16
Introduction
Globally, estimates of the number of children ages 0–14 with disabilities range between 93 million and 150 million (WHO, 2011). At least in policy, those with disabilities have been entitled to basic human rights since the Universal Declaration of Human Rights in 1948. The rights specific to people with disabilities were better defined and confirmed by the Convention on the Rights of Persons with Disabilities (UN, 2006)―key among them the right of all children with disabilities to schooling within general education systems. However, more than half a century later, the world is far from delivering on this promise. For instance, a recent analysis of available datasets from developing countries established that, in seven out of the eight countries included, more than 85 percent of primary school age children with disabilities had never attended school (Mizunoya, Mitra, & Yamasaki, 2016).
In Kenya, the education of children with disabilities has been a focus since the birth of the nation in 1963. Immediately after independence, the Ominde Commission (Kenya, 1964) recommended a focus on education for learners with special needs, and this same year, the government appointed the Ngala Commission to advise on matters of special needs education. As a result, enrollment over the past six decades has increased ten-fold. In the financial year 2017/2018, the Ministry of Education disbursed capitation grants to 108,221 learners with disabilities, who were enrolled in 290 special primary institutions and 2,057 special units/integrated programs (MoE, 2018).
Despite this focus, there is emerging evidence that students with disabilities continue to lag behind their peers without disabilities, and that disability continues to exacerbate the learning crisis (World Bank, 2019). Among the factors attributed to this is the lack of curriculum adaptation, and the exclusion of disability measurement in assessment.
This chapter seeks to unmask the multidirectional learning exclusions at the bottom of the pyramid, linked to disability categories, gender, and age. The analysis further examines the effectiveness of the examination accommodations instituted by the Kenyan National Examinations Council, among them time extensions. The conclusions and policy recommendations of this analysis are summed up into three key messages:
- The effect of age and disability type on performance is high. Early screening and assessment, and other age-of-entry support, might benefit learning at the bottom of the pyramid;
- Despite the accommodations in place, end-of-cycle examinations continue to marginalize learners with disabilities. Adapting accommodations to the type and severity of disability may be among the policy considerations to make;
- Disability is a key driver of learning at the “bottom”. Topics such as language deprivation and early cognitive development of deaf children might constitute the most urgent and key strategic choices for addressing learning at the bottom of the pyramid.
Objectives and key questions
This analysis adapts an exclusion in exclusion lens to understand learning outcomes in children with disabilities, focusing on three key questions:
- How do learning outcomes compare across learners with and without disabilities?
- Exclusion in exclusion―how do learning outcomes compare across different disability categories, and within the same disability category across age and gender?
- Which examination accommodations exist, and how adequate and effective are these in facilitating better outcomes for learners with disabilities?
Methodology
While factors such as disability, socioeconomic class, age, gender, and rural residence each affect learning independently, the combined effect becomes even more instructive. Indeed, many of these are not mutually exclusive in the way they affect education. Many studies on disability and education have just focused on disability categories, and have hardly scratched below the surface to unearth the interactions between disability and gender, or disability and age in the driving of learning outcomes.
This analysis adapts an exclusion in exclusion lens to analyze official examination data from the Kenya National Examinations Council (KNEC)1, looking at both the end-of-primary and end-of-secondary summative assessments, covering the period 2016 to 2019. Even though high-stakes examinations may not be an accurate measure of learning outcomes, the lack of recent and large-scale formative assessment data leaves few options. The analysis therefore adopts a narrow definition, by using examination results as a proxy for learning for children with disabilities. The Kenya examination data for the period only captures four disability categories, which were catered to with examination modifications―physical disability, low vision, blindness, and deafness―even though other disability categories are also known to exist.
Design, data, and analysis
The Kenya Certificate of Primary Education (KCPE) is a summative norm-referenced examination given at the end of Grade 8, or the last year of primary education. This examination test contains mostly multiple-choice items in five academic subjects―mathematics, English, Kiswahili, science, and social studies, as per the national curriculum. The Kenya Certificate of Secondary Education (KCSE) is a summative, criterion-referenced examination that marks the end of secondary education at Grade 12. This is a high-stakes examination that contains theoretical, project, and practical components in a wide range of academic subjects. Both the examinations are administered by the Kenya National Examinations Council (KNEC).
Quantitative data
This study utilizes KCPE and KCSE examination data for four cohorts (2016–2019). Different analyses are conducted to answer the research questions, including both descriptive (means and percentages) and inferential (regression) analyses. The main independent variables considered include age, gender, and disability classification. The dependent variable is the examination results across the four years.
Qualitative data
Over the last decade, several examination reforms have been passed for disability accommodation. Many of these accommodations are also described in the various policies governing education. This study analyzes these policies to understand the examination accommodations in each disability area, and is complemented by interview data on the key challenges constraining learning across the disability areas. The findings from these qualitative data are used to interpret examination results.
Sample
The study analyzes the results of all learners with and without disabilities who sat for the KCPE and KCSE in the four cycles―2016, 2017, 2018, and 2019. The study excludes learners with intellectual or cognitive disabilities, and includes only those with perceptive or physical disabilities in the four categories mentioned above. Combined, there were a total of 14,620 students in the four disability categories who sat for the two examinations over the four years, constituting less than 0.5 percent of all examination candidates. Around 60 percent of them (8,856) sat for KCPE, while 40 percent (5,764) sat for KCSE. In terms of disabilities, 813 of these were blind (6 percent), 3,602 had low vision (25 percent), 4,773 were deaf (33 percent) while 5,432 had physical disabilities (37 percent).
Findings
In 2019, a total of 2,398 learners with visual, hearing, or physical disabilities sat for the KCPE examination, accounting for 0.002 of the over one million candidates for that year. Though this number was lower than in 2018 (2,469), the completion figures have been on a general upward trend. At the primary-school level, the gender ratio has averaged at 55 percent of boys and 45 percent of girls, with notable variations across the disability categories. The findings in this paper include a total of 8,856 KCPE candidates over the four-year period (2016–2019), 4,863 male and 3,993 female. Among these are 404 blind children, 2,974 deaf children, 2,135 with low vision, and 3,343 with physical disabilities.
At the secondary-school level, a total of 1,672 candidates with the four disabilities sat for the KCSE examination in 2019 (0.002 of all candidates), up from 1,499 in 2018, which also shows a distinct upward trend. Contrary to the primary level, there are more female than male candidates at the secondary level, with an average gender ratio of 42 percent male and 58 percent female. The findings presented in this paper involve a total of 5,764 KCSE candidates over the four-year period, 2,426 male and 3,338 female. Among these are 409 blind and 1,799 deaf candidates, as well as 1,467 with low vision and 2,089 with physical disabilities.
Disability accommodation and documented modifications
Recognizing the barriers to learning with disabilities, governmental policy in Kenya recommends the provision of differentiated curricula, intervention programs, and curriculum support materials to suit these learners’ diverse needs, while strengthening the adaptation of assessment for learners and trainees with disabilities at all levels. In line with this, the Kenya National Examinations Council Act (Kenya, 2012) includes three key adaptations in the examination rules.
The KCPE examination Rule 12 provides for braille and large-print papers, provision of an alternative paper to English (Kenyan Sign Language―KSL) for learners with hearing impairments, and time extensions when appropriate. The KCSE examination Rule 19 provides for these three accommodations also, and goes further to add a fourth one―adapted question papers for candidates with hearing impairments. Further, prior assessment of learners with other diverse special needs is also undertaken before administration of both examinations to determine the specialized/individualized accommodations needed for each unique case.
While welcoming these adaptations, the report by the National Gender and Equalization Commission (NGEC) noted that only English and science subjects had been adapted for learners with hearing impairments by the year 2016 (NGEC, 2016). The report observed that even the extra time allowed (30 minutes) was not adequate to accommodate the slower pace of learning for children with disabilities.
Achievement for students with and without disabilities
The first question raised by this study was the difference between students with and without disabilities in learning attainment at the end of the primary and secondary school cycles. The primary examination (KCPE) performance is evaluated out of 100 for each of the five tested subjects, adding up to a total of 500. Scoring is different for the secondary-school examination (KCSE). Learners are graded using scores of the seven best performed subjects out of eight subjects taken. All the subjects are ranked on a scale, and an average is calculated across all the subjects. The results are presented in Tables 1 and 2 below:
Table 1. Overall means for learners with and without disabilities for primary-school examinations (KCPE).
|
Year |
National means |
Mean for learners with disabilities |
Difference (%) |
p-values (.05) in mean difference |
|
2019 |
249.1 |
200.7 |
19.4 |
0.038 |
|
2018 |
248.45 |
191.97 |
22.7 |
0.354 |
|
2017 |
248.32 |
196.23 |
21.0 |
0.496 |
|
2016 |
251.13 |
215.15 |
14.3 |
0.048 |
|
Average |
249.25 |
201.01 |
19.4 |
|
Table 2. Overall means for learners with and without disabilities for secondary-school examinations (KCSE).
|
Year |
National means |
Mean for learners with disabilities |
Difference (%) |
p-values (.05) in mean difference |
|
2019 |
4.26 |
3.1 |
27.2 |
0.084 |
|
2018 |
3.9 |
3.1 |
20.5 |
0.071 |
|
2017 |
3.68 |
3.06 |
16.8 |
0.088 |
|
2016 |
3.99 |
3.2 |
19.8 |
0.125 |
|
Average |
3.96 |
3.12 |
21.3 |
Overall, learners with disabilities scored an average of about 20 percentage points below their counterparts without disabilities for both primary and secondary levels. At the primary level, the difference was widest in 2018 (23 percentage points), while at secondary level, the difference was widest in 2019 (27 percentage points). However, statistical significance has only been established in three of the eight result areas. Lack of significance may be driven by the low numbers of students with disabilities compared to the total number of students, which was below 0.4 percent at both levels.
Achievement across the four disability categories
The analysis raised a second question: what are the learning attainment differences across the four categories of disability? To answer this, further analysis was undertaken to establish the differences in means at both KCPE and KCSE examinations. The results are provided in Tables 3 and 4 below.
Table 3. Examination means for the four disability categories at primary-school level (KCPE).
|
Year |
2019 |
2018 |
2017 |
2016 |
Average means |
Difference from average mean (%) |
|
Low vision |
227.21 |
229.51 |
227.85 |
261.39 |
236.5 |
14.5 |
|
Blind |
209.35 |
215.37 |
198.86 |
230.44 |
213.5 |
3.3 |
|
Physical disability |
211.66 |
192.81 |
203.97 |
227.94 |
209.1 |
1.2 |
|
Deaf |
165.71 |
159.88 |
164.33 |
178.61 |
167.1 |
-19.1 |
|
Average |
203.48 |
199.39 |
198.75 |
224.6 |
206.6 |
|
Table 4. Examination means for the four disability categories at secondary-school level (KCSE).
|
Year |
2019 |
2018 |
2017 |
2016 |
Average means |
Difference from mean (%) |
|
Blind |
3.92 |
4.24 |
3.66 |
4.39 |
4.05 |
22.4 |
|
Low vision |
3.94 |
3.56 |
3.47 |
3.87 |
3.71 |
12.1 |
|
Physical disability |
3.32 |
3.24 |
3.31 |
3.45 |
3.33 |
0.6 |
|
Deaf |
2.00 |
2.25 |
2.27 |
2.12 |
2.16 |
-34.7 |
|
Total |
3.3 |
3.32 |
3.18 |
3.46 |
3.31 |
|
These analyses reveal remarkable differences in learning attainment across the disability categories. The striking finding is that “deaf” is the only category that lies below the mean for learners with disability, and far below the mean. Overall, being deaf contributes to a drop in attainment of up to 19 percentage points at the primary level and nearly 35 percentage points at the secondary level. Candidates with physical disabilities lie just around the mean in both levels, while those with visual impairments lie a little above the disability mean. Dispersal from the mean is starker at secondary than primary level, extending to nearly 35 percentage points below the mean (deaf) and 22 percentage points above the mean (blind). Interestingly, the blind perform better on average than the learners with low vision at the secondary level, while the reverse is true for the primary level.
Achievement of different genders within the disability categories
The third question is whether gender impacts learning attainment across the four disability categories. KCPE and KCSE results were analyzed to establish the difference in the performance of male and female candidates overall, and in the performance of each gender within each disability category. Findings are presented in Tables 5 and 6 for the two levels.
Table 5. Means for various categories of disability by gender for primary examinations (KCPE).
|
Year |
Gender |
Blind |
Deaf |
Low vision |
Physical disability |
Average |
|
2019 |
M |
206.25 |
164.88 |
234.72 |
210.08 |
203.98 |
|
F |
214 |
166.63 |
218.53 |
213.78 |
203.24 |
|
|
2018 |
M |
219.68 |
160.16 |
233.74 |
192.06 |
201.41 |
|
F |
209.48 |
159.56 |
224.03 |
193.8 |
196.72 |
|
|
2017 |
M |
207.28 |
165.18 |
230.77 |
205.83 |
202.27 |
|
F |
188.98 |
163.48 |
224.16 |
201.24 |
194.47 |
|
|
2016 |
M |
229.36 |
180.72 |
267.65 |
227.39 |
226.28 |
|
F |
231.49 |
176.07 |
253.43 |
228.56 |
222.39 |
|
|
Overall mean |
213.3 |
167.1 |
235.9 |
209.1 |
206.3 |
|
|
Mean for male |
215.6 |
167.7 |
241.7 |
208.8 |
208.5 |
|
|
Mean for female |
211.0 |
166.4 |
230.0 |
209.3 |
204.2 |
|
|
Gender difference (male) |
4.7 |
1.3 |
11.7 |
-0.5 |
4.3 |
|
Table 6. Means for various categories of disability by gender for secondary examinations.
|
Year |
Gender |
Blind |
Deaf |
Low vision |
Physical disability |
Average |
|
2019 |
M |
3.0 |
2.0 |
3.7 |
3.1 |
3.0 |
|
F |
4.4 |
2.0 |
4.1 |
3.5 |
3.5 |
|
|
2018 |
M |
3.9 |
2.3 |
3.5 |
3.3 |
3.3 |
|
F |
4.5 |
2.2 |
3.6 |
3.2 |
3.4 |
|
|
2017 |
M |
3.2 |
2.1 |
3.2 |
3.1 |
2.9 |
|
F |
3.9 |
2.4 |
3.7 |
3.4 |
3.4 |
|
|
2016 |
M |
4.5 |
2.1 |
3.6 |
3.4 |
3.4 |
|
F |
4.3 |
2.2 |
4.1 |
3.5 |
3.5 |
|
|
Overall mean |
4.0 |
2.2 |
3.7 |
3.3 |
3.3 |
|
|
Mean for male |
3.7 |
2.1 |
3.5 |
3.2 |
3.1 |
|
|
Mean for female |
4.3 |
2.2 |
3.9 |
3.4 |
3.4 |
|
|
Gender difference (male) |
-0.6 |
-0.1 |
-0.4 |
-0.2 |
-0.3 |
|
The results establish differences in gender, though not as wide, among a class gender ratio of 55:45 (more male). These attainment differences are, however, inconsistent both across the school levels and disability categories. At the primary level, male candidates outperform their female peers by an average of 4.3 points across the four years. Within disability categories, male candidates who were blind, deaf, and with low vision outperformed their female counterparts, but female candidates with physical disabilities outperformed their male counterparts. The most consistent category across gender differences (in favor of males) is candidates with low vision, where male candidates performed better than female candidates by nearly 12 marks on average, and across all the years. This is the only category in which the differences reached statistical significance.
At the secondary level, by contrast, female candidates perform better than their male counterparts, consistent across both the four disability categories and across all four years. While the average difference is 0.3 points (or 2.5 percent in every paper), the difference is widest among the blind candidates (0.6 points or 5 percent in every paper), and narrowest among the deaf candidates (just 0.1 points, less than 1 percent per paper). The difference was widest in the years 2017 and 2019, with 0.5 points difference in each case, as compared to the 0.1 points difference in the two other years (2016 and 2018).
Though some differences are clearly visible, in only three instances were the differences statistically significant: among blind candidates in the KCPE of 2016, and among the deaf candidates in the KCPE of 2017 and KCSE of 2019.
Achievement and the age of learners with disability
The fourth question posed by the analysis was on the effect of age on learning for students with disabilities. To answer this, KCPE and KCSE candidates were grouped into three categories―right age, over-age, and under-age, and analysis of their learning achievement was conducted for the four-year period. We begin with a short overview of the distribution of the candidates and their ages.
Trends in age
In 2019, 76 percent of the candidates with disability who sat for KCPE were over-age (16 years old or above), while 24 percent were of the right age (13–15 years old). The under-age candidates (12 and below) constituted less than 1 percent of the population. Though the proportion of over-age candidates reduced over the four years (from 80 percent in 2016), the challenge persists. The analysis also reveals disturbing variation in the proportions of over-age candidates across the disability categories, ranging from 88 percent for blind candidates, 87 percent for the deaf, 75 percent among those with physical disabilities, and 67 percent among the candidates with low vision. Figure 1 summarizes these results (see Figure 1).

Fig. 1. Proportions of over-age, right-age, and under-age learners (KCPE 2016–2019).
At the secondary-school level, the proportion of candidates of the right age (17–20 years old) was higher than that of over-age candidates (21+ years old), across all four years. There were no under-age candidates (16 and under) recorded. Notably, the definition of the “right age” for the secondary level for students with disabilities has a somewhat generous bracket (17–20) compared to that of students without disabilities (14–17), pegged at three years above. The same applies to the definitions of over-age―19 years and above for students without disabilities and 21 years and above for students with disabilities.
Comparison of age and disability across the years reveals a story consistent with that of primary school. The highest proportions of over-age candidates are found among blind (55 percent) and deaf (52 percent) candidates, while this is significantly lower among learners with physical disabilities (33 percent) and those with low vision (27 percent) (see Figure 2).
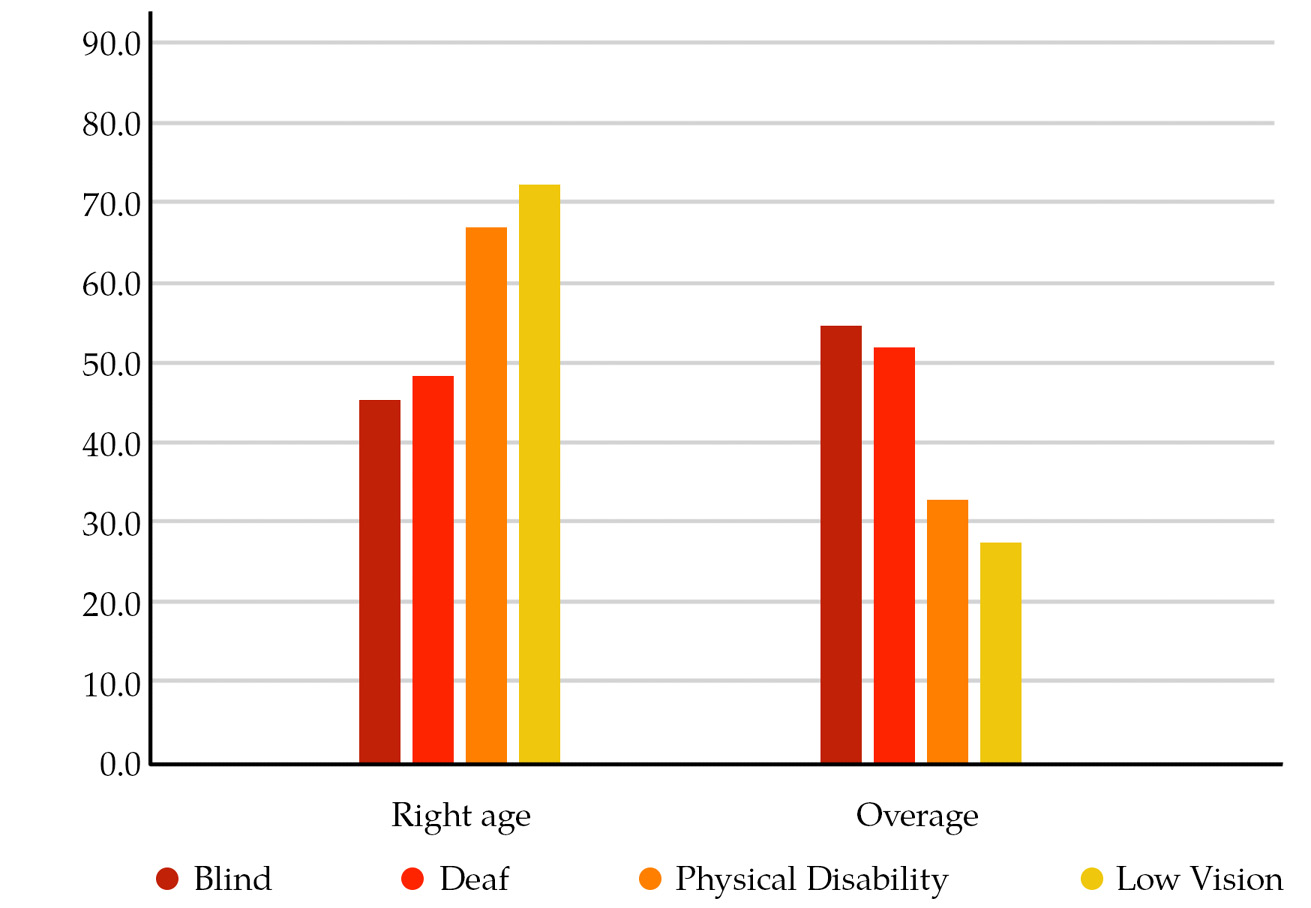
Fig. 2. Proportions of over-age, right-age, and under-age learners (KCSE 2016–2019).
Learning achievement among right-age, over-age, and under-age students
This analysis confirms that age is a good determinant for the examination performance of students with disabilities at both the primary- and secondary-school levels. Results are presented in Tables 7 and 8.
Table 7. Performance scores of right-age, over-age, and under-age candidates (2016–2019) at primary level (KCPE).
|
Age |
Total candidates |
% |
Mean |
|
16+ |
6879 |
77.7 |
198.4 |
|
13–15 |
1972 |
22.2 |
229.7 |
|
12 and below |
5 |
0.1 |
244.5 |
Table 8. Performance scores of right-age and over-age candidates (2016–2019) at secondary level (KCSE).
|
Age |
Total candidates |
% |
Mean |
|
21+ |
2232 |
38.7 |
2.81 |
|
17–20 |
3491 |
60.6 |
3.65 |
|
16 and below |
41 |
0.7 |
3.16 |
At the primary level, candidates who are under-age (12 years old and below) outperform their right-age and over-age peers by 14.6 and 46.1 points respectively. The widest gaps in learning attainment between right-age and over-age candidates was among those with physical disabilities (11 percent on every subject) and low vision (10 percent), with narrower gaps among the blind candidates (3 percent). The effect of age was lowest among the deaf students, accounting for an average of only 1 percent on every subject between right-age and over-age candidates.
At the secondary level, the candidates of the right age (17–20 years old) performed better than their over-age peers (21 years old and above) by 0.84 mean points, or an average of 7 percent on every subject, and by 0.49 mean points for their under-age counterparts (16 years old and below). Consistent with the primary level, the effect of age on achievement was lowest among deaf candidates, where on average, right-age candidates outperformed their over-age peers by only 1 percent on every subject. The gap in performance in every subject (average) was widest among the candidates with visual impairments (10 percent blind and 9 percent low vision), followed by those with physical disabilities at 7 percent.
An analysis revealed isolated statistical significance among the KCPE examination results of 2018 and 2016 for the deaf students, and only in 2017 for the blind students. All other results were not significant. However, the results of the secondary-school candidates revealed significance for the deaf candidates, but not for the other disability categories (save for KCSE 2017 for the low-vision category).
Combining all
A multi-level regression analysis was undertaken to establish if there was any cross-variable relationship across the learners’ disability, age, and gender for both primary and secondary exit examinations. The results are presented in Tables 9 and 10.
Table 9. Regression analysis of performance for learners with disabilities in primary (KCPE) examinations.
|
Variable |
Coef. |
Std. err. |
T |
P.t |
[95% conf. interval] |
|
|
Age group (13–15) |
||||||
|
12 and below |
13.6255 |
23.11 |
0.125 |
0.046 |
-66.24 |
38.46 |
|
16 and above |
-31.396 |
23.11 |
0.332 |
0.145 |
-94.51 |
1.456 |
|
ii) Gender (male) |
||||||
|
Female |
-4.28 |
4.73 |
-0.91 |
0.37 |
-13.99 |
5.42 |
|
iii) Disability type (LV) |
||||||
|
Blind |
-22.57 |
6.69 |
-3.37 |
0 |
-36.29 |
-8.85 |
|
Deaf |
-68.79 |
6.69 |
-10.29 |
0 |
-82.51 |
-55.07 |
|
Physical |
-26.79 |
6.69 |
-4.01 |
0 |
-40.51 |
-13.07 |
|
|
|
|
|
|
|
|
|
Constant |
236.04 |
4.79 |
43.62 |
0 |
224.5 |
251.2 |
The regression analysis further affirms that, at primary level, under-age learners (12 and below) are likely to perform better than right-age learners (aged 13–15) by 13.3 points. This was found to be significant at a p-value of 0.046. Though boys were likely to perform better than girls in KCPE examinations by 4.28 points, the result had no statistical significance.
Table 10. Regression analysis of performance for candidates with disabilities in secondary examinations (KCSE).
|
Variable |
Coef. |
Std. err. |
T |
P.t |
[95% conf. interval] |
|
|
i) Age group (17–20) |
||||||
|
16 and below |
-0.46 |
0.31 |
-1.23 |
0.056 |
-0.89 |
0.36 |
|
21 and above |
0.12 |
0.32 |
1.2 |
0.146 |
0.061 |
0.097 |
|
ii) Gender (male) |
||||||
|
Female |
-0.31 |
0.11 |
-2.87 |
0.01 |
-0.53 |
-0.09 |
|
iii) Disability type (LV) |
||||||
|
Blind |
0.29 |
0.15 |
1.9 |
0.07 |
-0.02 |
0.6 |
|
Deaf |
-1.54 |
0.15 |
-10.16 |
0 |
-1.85 |
-1.23 |
|
Physical |
-0.38 |
0.15 |
-2.53 |
0.02 |
-0.69 |
-0.07 |
|
Constant |
3.85 |
0.12 |
32.11 |
0 |
3.6 |
4.09 |
The candidates of the right age (17–20) are likely to score 0.46 more points than those 16 years old and below in KCSE examinations; however, this finding was not significant.
Discussion
Examination modifications and accommodations
Research on modifications and accommodations for students with disabilities has largely been based on students in the US. For example, a study by Zurcher and Bryant (2001) established that, when American college students with learning disabilities were provided with examination accommodations, their scores as a group were similar to those of examinees without learning disabilities taking the test under standard administration conditions, confirming that modifications are useful in equalizing examination opportunities. Further, Zuriff (2010) found that only students with learning disabilities benefit from extra examination time. He also questioned the validity of test scores under time extension, because students with non-learning disabilities already faced such other limitations. Similarly, Mandinach et al. (2005) determined that, while some extra time improves SAT examination performance for both students with and without disabilities, too much time may be detrimental.
In the present study in Kenya, students with disabilities performed well below their counterparts without disabilities, even though a time extension was provided. Though examination accommodations are useful to support students with disabilities generally, they may be insufficient for Kenyan students, for reasons we do not fully understand.
Disability, age, and learning
There seems to be scientific consensus in the evidence that learners of the right age perform better than over-age learners. Our results also indicate that the majority (76 percent) of candidates are over-age. A closer look at this points to either delayed school entry and/or delayed functional assessment and identification of the disabilities that yield to grade repetition. While little documentation is available on disability and grade repetition, Moyi (2017) found that many obstacles stand in the way for learners with disabilities in Kenya, and that most learners face delays in enrollment, grade progression, and course completion. Confirming this, one key informant argued that Kenya’s educational opportunities for learners with disabilities are still relegated to special, segregated schools, most of which are boarding schools. Parents are often uncomfortable sending their little children to far-away institutions, and often delay enrollment until ages 8–10.
While inclusive education may be the solution to this problem in Kenya, it could realistically take time before this could be achieved, given the conditions, capacities, and low learning outcomes in the regular schools. However, regular neighborhood schools might be able to accommodate children with disabilities in early grades, so that later on, children would transition to the special schools. At this time, they would be old enough to move away from home. To complete this curve, the special schools would also need to invent accelerated learning opportunities for such learners, so that they attain maximal age-grade-learning levels within a reasonable timeframe.
Disability type and learning
The study showed major achievement variations across the various disability types. Uniquely, students who were deaf performed much more poorly than their counterparts who were blind, or had low vision or physical disabilities. Close examination of this finding leads to a language-barrier discussion. One expert interviewed in our study argued that deaf students have equal learning potential to their hearing peers, but what makes a difference is language deprivation. Deaf learners in Kenya acquire language late, and when they do, they are proficient in Kenyan Sign Language, while subjects are typically examined in English.
Language deprivation among deaf children is a widely confirmed phenomenon (Mayberry & Squires, 2006; Olusanya & Newton, 2007), and occurs mainly in deaf children born to hearing parents (Cheng et al., 2019). While learning interventions should compensate for language deprivation, two other possibilities may also be feasible. The first is addressing early language acquisition through creating language-rich home environments, and the second is adapting the examinations into appropriate languages and formats. Recorded, signed responses over written responses might be one such adaptation.
Conclusion
Our study has confirmed that students with disabilities face myriad exclusions in the high-stakes examinations in Kenya. While no significant gender differences were found, the effect of age and disability type on performance is high, pointing to the need for targeted interventions. There is also the need to re-examine the accommodations that the Kenya National Examinations Council has put in place for examinations, to ensure that they are better adapted to disability types and severity, and go beyond the simple time extension. It is important to note, however, that more focus is being given to learners with special needs and disabilities in the ongoing education reforms in Kenya, including the incoming Competency-Based Curriculum and Assessment (CBC and CBA). Clearly, we need greater investment and support for the specific needs of students with disabilities in Kenya, as a key part of improving learning at the bottom of the pyramid.
References
Cheng, Q., Roth, A., Halgren, E., & Mayberry, R. I. (2019). Effects of early language deprivation on brain connectivity: Language pathways in deaf native and late first-language learners of American Sign Language. Frontiers in Human Neuroscience, 13. https://doi.org/10.3389/fnhum.2019.00320
Kenya. (2003). Persons with Disabilities Act, No. 14, 2003. Nairobi: Government Printers.
Kenya. (1964). Kenya Education Commission report. Nairobi: Government Printers.
Klingner, J. K., Vaughn, S., Schumm, J. S., Cohen, P., & Forgan, J. W. (1998). Inclusion or pull-out: Which do students prefer? Journal of Learning Disabilities, 31(2).
Mayberry, R. I., & Squires, B. (2006). Sign language acquisition. In K. Brown (Ed.), Encyclopedia of language and linguistics (pp. 291–296). Amsterdam: Elsevier.
Mandinach, E. B., Bridgeman, B., Cahalan-Laitusis, C., & Trapani, C. (2005). The impact of extended time on SAT® test performance (Report to College Board, New York, Research Report No. 2005–8). http://www.ets.org/Media/Research/pdf/RR-05-20.pdf
Ministry of Education. (2018). Sector policy for learners and trainees with disabilities. Nairobi: Kenya.
Mizunoya, S., Mitra, S., & Yamasaki, I. (2016). Towards inclusive education: The impact of disability on school attendance in developing countries. SSRN Electronic Journal. https://doi.org/10.2139/ssrn.2782430
Montoya, S. (2018). What is the bottom of the pyramid in the case of low-income countries? In D. A. Wagner et al. (Eds.), Learning at the bottom of the pyramid: Science, measurement, and policy in low-income countries (pp. 31–56). Paris: UNESCO-IIEP.
Moyi, P. (2017). School participation for children with disabilities in Kenya. Research in Comparative and International Education, 12(4).
National Gender and Equality Commission (NGEC). (2016). Access to basic education by children with disability in Kenya (Commission’s Report).
Olusanya, B., & Newton, V. (2007). Global burden of childhood hearing impairment and disease control priorities for developing countries. The Lancet, 369, 1314–1317.
Pitionak, M. J., & Royer, J. M. (2001). Testing accommodations for students with disabilities: A review of psychometric, legal, and social policy issues. Review of Educational Research, 71(1).
UN. (2006). Convention on the Rights of Persons with Disabilities (CRPD).
WHO. (2011). World Report on Disability.
World Bank. (2019). Every learner matters: Unpacking the learning crisis for children with disabilities. https://www.leonardcheshire.org/sites/default/files/2019-10/Every-Learner-Matters.pdf#page=56&zoom=auto,87,434
Zurcher, R., & Brant, D. P. (2001). The validity and comparability of entrance examination scores after accommodations are made for students with LD. Journal of Learning Disabilities, 34(5). http://citeseerx.ist.psu.edu/viewdoc/download?doi=10.1.1.819.4498&rep=rep1&type=pdf
Zuriff, G. E. (2010). Extra examination time for students with learning disabilities: An examination of the maximum potential thesis. Applied Measurement in Education, 13(1), 99–117. https://doi.org/10.1207/s15324818ame1301_5
1 Data in the tables in this chapter are drawn from the KNEC, https://www.knec-portal.ac.ke.