8. Mexico: Education and Learning at the Bottom of the Pyramid
© 2022 Chapter Authors, CC BY-NC 4.0 https://doi.org/10.11647/OBP.0256.08
Introduction1
Mexico has gradually established the right to free and compulsory education at all stages. The right to education is not limited to children’s access to schools with well-trained teachers and adequate teaching materials and infrastructure, nor is it only about ensuring their graduation from compulsory education levels. It also includes, explicitly in the constitutional reform of 2019, the right to learn through “constant integral improvement that promotes the maximum learning achievement of students” (CPEUM, 2019, May 15, Art. 31).2
This chapter addresses the populations of children at the bottom of the learning pyramid at the preschool (three grades), primary (six grades), and secondary (three grades) levels of education. The typical ages for these three levels are 3–5, 6–11, and 12–14 respectively.3
Various sources of information and studies are used to describe the subpopulations of children as thoroughly as possible and with the latest data available. School data are from the 2018–2019 school year.
As of 2018, there are estimated to be 26.7 million children aged 3–14 in Mexico, just over a fifth (21.3 percent) of the total population of 125 million people. Of the total number of children aged 3–14, a quarter of them are aged 3–5 (6.6 million), half are aged 6–11 (13.3 million), and the remaining quarter (6.7 million) are aged 12–14 (CONAPO, 2019).
So far, the Mexican State has not managed to guarantee either universal access to schools, universal completion of compulsory education levels, or, for most who graduate from primary and secondary education, the basic levels of learning that will allow them to develop further. This implies a social debt, especially to children in conditions of social vulnerability. They have the lowest levels of learning, but also the lowest rates of access to schools, of progress between grades and school levels, and of completion of compulsory basic education when compared to their peers in better social conditions (INEE, 2007; 2014a; 2018a; and 2019a; Galeana, 2016).
In this section, we introduce two approaches to the definition of the population of children at the bottom of the learning pyramid. The first criterion is demographic and describes children in conditions of social vulnerability. The second criterion focuses on subpopulations of primary and secondary school students with insufficient achievement levels in comparison with standardized testing outcomes. The two perspectives are complementary. On the one hand, by considering only student information, especially educational achievement, children who are not in school are left out. On the other hand, the Mexican Education System (MES) generally lacks personal and family information about its students that correlate with educational performance. Thus, identifying subpopulations of children in conditions of social vulnerability makes it possible to identify those who are the most disadvantaged in terms of learning.
There are children who are part of several dimensions of vulnerability at the same time (for example, indigenous children may live in highly marginalized areas, work long hours, and live in extreme poverty). Because these children are in multiple situations of vulnerability, and the information available is generally not sufficient, the subsets of the population in conditions of vulnerability are generally defined by considering only one condition of social exclusion and, therefore, the subpopulations thus defined have members in common because there is considerable overlap between the categories.
The demographic approach
The subpopulations of children in conditions of social vulnerability are determined by place of residence, poverty, ethnic and linguistic affiliation, and disability. They also include street-children, child laborers, and children in continuous migration as part of agricultural day-laborer households. In what follows, the main subpopulations are described.
Children in rural areas
In 2015, there were 119.5 million people in Mexico, 23 percent of whom lived in rural localities—that is, towns with fewer than 2,500 inhabitants. Almost a quarter of the rural population (7 million people) consisted of children aged 3–14. The number of rural children aged 3–5 and 12–14 years was very similar (1.8 million in each), while the population of 6-to-11-year-olds amounted to 3.5 million. These figures add up to just over a quarter of all Mexican children in each age group.
Rural localities range from hamlets with a couple of homes and very few inhabitants to towns of up to 2,500 people. In 2010, the entire population of Mexico was distributed in 192,247 localities, 98 percent of which were rural. Almost three-quarters of rural localities (139,158) have fewer than 100 inhabitants, are distributed sparsely, and together account for only 9.2 percent of the rural population. That same year, the population census counted 627,350 children aged 3–14 in these small localities, which also amounts to 9 percent of the total rural population of the same age group. The fragmentation and dispersion of the population may be even more acute, given that 15 percent of the rural population of children aged 3–14 lived in localities with fewer than three houses and fewer than 100 inhabitants.
Children in extreme and moderate poverty
In Mexico, the measurement of multidimensional poverty considers factors such as education, health, social security, nutritional food, housing, and its services in addition to income. The population in extreme poverty is defined as those whose income is so low that, even if they were to devote it entirely to the acquisition of food, they would not be able to nourish themselves adequately for a healthy life. Moreover, they are deprived of at least three of the six social rights mentioned above. The population in moderate poverty consists of those whose income does not allow them to acquire the goods and services they require to satisfy their needs (both food- and non-food-related) and who suffer at least one social deprivation, but are not in a situation of extreme poverty. The union of these subpopulations constitutes the population in multidimensional poverty or, briefly, in poverty (CONEVAL, 2019a).
According to these measures, in 2018, 34.5 percent of the population in Mexico (43.1 million people) lived in moderate poverty and 7.4 percent (9.3 million people) in extreme poverty. If both types of poverty are considered, 52.4 million people were in a situation of multidimensional poverty (CONEVAL, 2019b).
Poverty in general, and extreme poverty, is greater in younger children. In 2016, 20.7 million children aged 0–17 lived in poverty; this figure represented almost two-fifths (38.8 percent) of the total number of people living in poverty that year. When considering the incidence of poverty among children in age groups 0–5, 6–11, and 12–14, we can see that 52.5 percent of those aged 0–5 were living in poverty, as well as 52.2 percent of those aged 6–11, and 48.8 percent of those aged 12–17 (see Table 1).
Table 1. Percentage of children in poverty in Mexico (2018).
|
Age |
Moderate poverty |
Extreme poverty |
Multidimensional poverty |
|
0–5 |
42.2 |
10.2 |
52.5 |
|
6–11 |
43 |
9.2 |
52.2 |
|
12–17 |
41 |
7.8 |
48.8 |
Note: Data obtained from “Pobreza infantil y adolescente en México 2008–2016” by Coneval & UNICEF (s/f), p. 6 (https://www.coneval.org.mx/Medicion/Documents/UNICEF_CONEVAL_POBREZA_INFANTIL.pdf).
Poverty affects children in rural areas disproportionately more than their urban peers. In 2016, 63.9 percent of children aged 0–17 living in rural areas were living in poverty, as compared to 46.5 percent of their urban peers (CONEVAL, undated).
Indigenous children
The great cultural heritage and diversity of Mexico comes in part from its native populations, whose languages can be organized into 68 linguistic groups and 364 variants integrated into 11 Indo-American linguistic families (INALI, 2008). In 2018, with data from the National Household Income and Expenditure Survey (ENIGH), 9.6 percent of the population resided in a household where any head of household or any of their ascendant relatives spoke an indigenous language. According to this criterion, out of a total of 125 million people, approximately 12 million were indigenous. Of these, 7 million people (5.9 percent of the population aged 3+) spoke an indigenous language. Of the total number of speakers, 9.2 percent (652,000) exclusively spoke an indigenous language. There were 3.7 million indigenous children aged 3–17, equivalent to 10.9 percent of the total number of children in this age group. 1.6 million children, amounting to 43.7 percent of all indigenous people in this age group, spoke an indigenous language.
If self-identification is considered a criterion of cultural and ethnic affiliation, then 36.5 million people—that is, 30.5 percent of the total population—self-identify as indigenous. For the 3–17 age group, the figure increases to 43.7 percent, amounting to 1.6 million children (INEE-UNICEF, 2019).
In 2018, the places of residence of indigenous populations were almost equally distributed between rural and urban localities, with 49.8 percent residing in localities with fewer than 2,500 inhabitants. It is to be expected that the proportion of speakers living in rural locations will be higher than their urban counterparts. In 2015, 55.4 percent of the indigenous population and 76.7 percent of speakers aged 3–17 resided in rural areas (INEE, 2018b).
Poverty among indigenous people is greater in rural areas, affects younger children disproportionately, and increases among speakers of indigenous languages. In 2014, 31.8 percent of the indigenous population lived in extreme poverty and 41.4 percent in moderate poverty, while for the non-indigenous population, the figures were 7.1 percent and 36.1 percent, respectively. Among the indigenous population living in rural areas, extreme poverty affects 42.2 percent and moderate poverty 38.5 percent of the population; for indigenous people in urban areas with more than 100,000 inhabitants, these figures were 6.9 percent and 44.3 percent, respectively (INEE-UNICEF, 2015).
Among indigenous children aged 3–17, more than one-third (35.5 percent) lived in extreme poverty and 43.2 percent in moderate poverty; among their non-indigenous peers, these figures were 8.4 percent and 42.3 percent, respectively. If the children are speakers of an indigenous language, more than half (54 percent) are in extreme poverty and 36.8 percent in moderate poverty. Thus, 78.7 percent of indigenous children between the ages 3–17, and 90.8 percent of those who speak an indigenous language, live in conditions of poverty (INEE-UNICEF, 2015).
Children with disabilities
In Mexico, disability is measured mostly in the areas of impairments and limitations. In 2016, it was estimated that 2.6 percent of the population aged 3–14 experienced difficulty with walking, moving, climbing, or descending; seeing, even with the use of glasses; speaking, communicating, or conversing; hearing, even with the use of a hearing aid; dressing, bathing, or eating; paying attention or learning simple things; or experiencing a mental impairment. This figure amounted to nearly 700,000 children, 16.8 percent of whom were aged 3–5, 56.5 percent were aged 6–11, and 26.8 percent were 12–14 years old (INEE, 2018b).
Children of internal migrant workers
The migration of day laborers from poor rural areas to developed agricultural regions, following the different production cycles of crops, is a complex structural phenomenon (Rojas, 2017). In this seasonal rural-rural migration, some children migrate alongside their parents, giving rise to a subpopulation of migrant children in conditions of great social vulnerability.
Migrant children often face barriers in access to education, school retention, grade advancement, and school-level progression in order to complete compulsory basic education in a timely manner. These children are in fact excluded from the learning provided by schooling (INEE, 2014b). According to official estimates using the results of the 2009 National Day Laborers’ Survey (ENJO, 2009), the migrant day-laborer population amounts to 2,071,483 people. More than a third of this population (36.6 percent) are children aged 0–15, amounting to 758,163 people. In 2014, the INEE reported that only 10 percent of the children of migrant-worker families attended school.4
Child laborers
In 2017—excluding all forms of labor that seriously undermine the wellbeing of children, like slavery, forced labor, human trafficking, paramilitary recruitment, commercial sex or pornography, or other illicit activities—one in 10 children aged 5–17 (11 percent), that is, 3.2 million children, worked in unauthorized economic activities or in domestic work under unsuitable conditions. Considering 20 hours a week as the lower limit for defining a long or extended working day, it is estimated that, in 2015, 2.1 percent of children aged 6–11 worked long hours, a figure that rises to 9.3 percent among those aged 12–14. In absolute terms, over 83,000 and 637,000 children in these age ranges, respectively, worked long hours that could put their school attendance, learning, and due rest at risk.5
The schooling and testing approach
In this section, we consider primary and secondary schooling attendance as well as students’ learning outcomes according to standardized tests.
Size and structure of preschool, primary, and secondary education in Mexico
The Mexican Educational System (MES) is the third largest in the American Continent (INEE, 2019a). At the beginning of the 2018–2019 school year, the preschool, primary, and secondary education system contained approximately 25 million students served by 1.2 million teachers in 227,000 schools (see Table 2).
Table 2. Students, teachers, and schools in preschool, primary, and secondary education (2018–2019).
|
Educational service |
Students |
Teachers |
Schools |
|||
|
Number |
% |
Number |
% |
Number |
% |
|
|
Preschool |
4 780 787 |
19.0 |
236 509 |
19.5 |
90 446 |
39.9 |
|
Primary school |
13 972 269 |
55.4 |
572 104 |
47.1 |
96 508 |
42.5 |
|
Secondary school |
6 473 608 |
25.7 |
406 084 |
33.4 |
39 967 |
17.6 |
|
Total |
25 226 664 |
100.0 |
1 214 697 |
100.0 |
226 921 |
100.0 |
Note: Calculations based on the Continuous Statistics from Formato 911 (school year 2018–2019), SEP-DGPPyEE.
The MES has devised different types of educational services aimed at different subpopulations of children. Preschool and primary education is provided through three types of service: general, indigenous, and community education. Secondary education is provided in general, technical, community, and telesecondary schools, as well as in schools for workers.
Children from indigenous communities, settled in rural areas, are assigned to indigenous preschools and primary schools. Ideally, teachers should speak the same language as their students, but this is not the case in one-tenth of schools (INEE-UNICEF, 2019). Indigenous children who attend school in cities do not have teachers who speak their mother-tongue.
Children living in rural localities, particularly in smaller ones, are served through the community service provided by the National Council for the Promotion of Education (CONAFE), which offers the three levels of basic education. Community schools must operate in locations where there is no other type of service and where there is a minimum of 5 and a maximum of 29 students (DOF, 2017). They also serve indigenous children, children of farmworkers and circus performers, and migrant children. Unlike in other educational services, community schools’ teachers are not education professionals; they are young people who have completed their high-school studies and have been qualified and trained to implement a multigrade pedagogical model with educational materials designed expressly for their situation. At each educational level, these young people teach students of different ages, learning rates, and educational grades.
General (public) schools serve urban areas or rural localities with more than 30 students. Such schools, typical of urbanized areas, usually have one teacher per grade for preschool and primary education. However, the small number of students makes it impossible for rural schools to follow this system. Educational authorities have allowed the emergence of multigrade general schools, where instructors simultaneously teach students in more than one grade without accompanying the multigrade organization of their work with an appropriate pedagogical model or teaching materials (INEE, 2018a). In the 2017–2018 school year, almost one-third of general schools were multigrade (32.5 percent). Two-thirds (65.8 percent) of indigenous primary schools are in a similar situation.
In secondary education, there are five types of schools: general, technical, telesecondary, community schools, and schools for workers. The first two are mainly intended for urban localities; their organization requires that each subject should be taught by a specialized teacher. Telesecondary schools, conceived to expand secondary education to rural areas, differ in their teaching organization and pedagogical model, as students watch lessons on a television set and are supported by a single teacher per grade who is responsible for answering questions and guiding their learning in all subjects. As in previous levels of education, children from smaller rural locations are assigned to community-based secondary schools.
At the beginning of the 2018–2019 school year, there were about 6 million students enrolled in 124,000 preschools (25.2 percent), primary (24.6 percent), and secondary (20.7 percent) schools in rural areas. In relative terms, rural schools accounted for 23.7 percent of total preschool, primary, and secondary education enrollment, but for more than half of all schools in Mexico (54.5 percent) (see Table 3 below). This means that rural schools are considerably smaller than urban schools. Indigenous preschools and primary schools target rural children subpopulations in localities with a high presence of indigenous populations, and community schools target children in small localities, but the greatest educational coverage in rural areas is provided by general schools (see Table 3 below).
For indigenous and rural children, and more generally for those in poverty, public intervention is necessary to ensure their access to education. In Mexico, 85 percent of preschool students and 90 percent of primary- and secondary-school students go to public schools; almost 100 percent of indigenous, community, and telesecondary schools are public (INEE, 2019b).
Primary- and secondary-school students at the bottom of the learning pyramid according to standardized tests
The National Institute for the Evaluation of Education (INEE), which was in charge of evaluating the quality of the MES until April 2019, administered standardized tests to samples of students in the final grades of preschool, primary, secondary, and upper-secondary education to assess their degree of mastery of key learning objectives in the national curriculum. This section will use the results of the PLANEA tests administered in 2018 to sixth-grade primary-school students and in 2017 to third-grade secondary-school students. The subjects evaluated were language and communication and mathematics.
The results are presented according to the students’ distribution in four levels of achievement. In general, at Level I, students are found to have insufficient mastery of key learning objectives, making it difficult for them to continue learning. Students in Level II have a basic mastery of such learning, while students in Levels III and IV show satisfactory and outstanding mastery, respectively (INEE, 2019a). We identify students in Level I as the bottom of the learning pyramid in Mexico. In the description of the results on the PLANEA test, Levels III and IV are grouped together because of the small number of students at the outstanding level in community and indigenous schools (see Table 3).
Table 3. Preschool, primary, and secondary education students and schools by type of service at national level and in rural localities (2018–2019).
In 2018, at the national level, almost half of sixth-grade primary-school students (49.1 percent) had insufficient achievement in language and communication (see Table 4 below); among those who study in an indigenous or community primary school, the percentages increase to 79 percent and 70.7 percent, respectively. Being at the insufficient level means, for example, that one cannot relate explicit information segments to each other and establish the meaning of implicit elements in narrative and expository texts. Nor can one use conjunctions and causal links in complex sentences. It is difficult for children at this level to understand the information and recognize the general structure of some expository texts (INEE, 2019a). In math, six out of 10 sixth-grade students (59.1 percent) were found to have insufficient achievement (see Table 4 below), which means, for example, that they cannot solve arithmetic problems with decimal numbers, calculate the perimeter of irregular polygons, or use percentages. More than three-quarters of those who study in indigenous or community primary schools, and 60.9 percent of general school students, experience these same difficulties (INEE, 2019a).
Table 4. Percentage of sixth-grade students by school type and level of educational attainment achieved in the domains evaluated in the PLANEA-SEN tests (2018).
|
School type |
|
|||||
|
I |
II |
III and IV |
||||
|
% |
(se) |
% |
(se) |
% |
(se) |
|
|
Language and communication |
||||||
|
Public general |
50.7 |
(0.6) |
33.9 |
(0.5) |
15.4 |
(0.3) |
|
Indigenous1 |
79.0 |
(3.7) |
17.0* |
(2.9) |
4.0** |
(1.4) |
|
Community |
70.7* |
(2.6) |
24.4* |
(2.5) |
4.8** |
(1.2) |
|
Private |
14.9 |
(0.8) |
35.0 |
(0.9) |
50.1 |
(1.1) |
|
National |
49.1* |
(0.6) |
32.9 |
(0.4) |
17.9 |
(0.3) |
|
Mathematics |
||||||
|
Public general |
60.9 |
(0.6) |
17.8 |
(0.4) |
21.3 |
(0.4) |
|
Indigenous1 |
77.5* |
(3.1) |
11.8* |
(1.9) |
10.7* |
(1.7) |
|
Community |
76.6* |
(2.4) |
14.7 |
(1.9) |
8.7* |
(1.7) |
|
Private |
30.9* |
(1.2) |
22.3* |
(0.9) |
46.9 * |
(1.2) |
|
National |
59.1* |
(0.5) |
17.9 |
(0.3) |
23.0* |
(0.4) |
1 These estimates do not meet the participation rate criterion.
* Statistically different from public general schools in each grade, using the t-test.
** Estimate with a coefficient of variation greater than 20 percent.
se. Standard error. Data obtained from “Panorama Educativo de México. Indicadores del Sistema Educativo Nacional 2018” (INEE, 2019).
In 2017, the PLANEA test was administered to third-grade secondary-school students. In Table 5 below we can see that one-third (33.8 percent) of students in Mexican schools had insufficient mastery of language and communication skills, which means that they “fail to recognize the plot and conflict in a story or interpret the figurative language of a poem, or to organize relevant and non-relevant information for the purpose of a survey, or to identify the purpose, theme, opinion and evidence of argumentative texts” (INEE, 2018a).
In math, the results are more discouraging, since about two-thirds of the students (64.5 percent) were in Level I and only 13.7 percent reached satisfactory or outstanding levels. Those in Level I are unable to solve problems with rational numbers or those that go beyond arithmetic, such as problems involving square roots, the common divisor, and linear equations; nor do they recognize and express relationships of direct or inverse proportionality.
Secondary schools located in rural areas, which serve a greater proportion of children in conditions of social vulnerability than urban schools, have higher percentages of students with insufficient mastery of key learning objectives in the two subjects under discussion. In language and communication, six out of every 10 community secondary students (60.2 percent) and about half of those studying in a telesecondary school (48.8 percent) are at Level I of achievement (see Table 5).
Table 5. Percentage of third-grade secondary students by level of educational attainment attained in domains as assessed on Plan-ELSEN Tests by type of school (2017).
|
I (Insufficient) |
II |
III and IV (Satisfactory and outstanding) |
||||
|
% |
(se) |
% |
(se) |
% |
(se) |
|
|
Language and communication |
||||||
|
General public |
31.6 |
(0.9) |
42.8 |
(0.5) |
25.6 |
(0.8) |
|
Technical public |
32.2 |
(0.7) |
41.8 |
(0.6) |
25.9 |
(0.6) |
|
Telesecondary |
48.8* |
(1.2) |
36.6* |
(0.8) |
14.6* |
(0.6) |
|
Community |
60.2* |
(2.6) |
31.3* |
(2.2) |
8.5* |
(1.2) |
|
Private |
10.6* |
(0.7) |
32.2* |
(0.7) |
57.3* |
(1.1) |
|
National |
33.8* |
(0.6) |
40.1* |
(0.3) |
26.1 |
(0.5) |
|
mathematics |
||||||
|
General public |
66.2 |
(0.9) |
21.7 |
(0.5) |
12.1 |
(0.6) |
|
Technical public |
66.8 |
(0.7) |
21.2 |
(0.4) |
12.0 |
(0.5) |
|
Telesecondary |
69.9* |
(1.1) |
19.6* |
(0.7) |
10.4* |
(0.6) |
|
Community |
86.7* |
(1.5) |
10.9* |
(1.3) |
2.4** |
(0.5) |
|
Private |
37.0* |
(1.3) |
29.1* |
(0.6) |
33.9* |
(1.1) |
|
National |
64.5 |
(0.6) |
21.7 |
(0.3) |
13.7* |
(0.3) |
Note: * Statistically different from public general schools in each grade, using the t-test.
** Estimate with a coefficient of variation greater than 20 percent. se. Standard error
Data obtained from “Panorama Educativo de México. Indicadores del Sistema Educativo Nacional 2017”, INEE (2018).
In math, the figures for insufficient achievement were 86.7 percent of community secondary students, 69.9 percent of telesecondary students, 66.8 percent of technical secondary students, 66.2 percent of general school students, and 37 percent of private school students (see Table 5 above).
Main educational challenges faced by children at the bottom of the pyramid
Children in conditions of social vulnerability have difficulty accessing quality education, as can be seen in the assessment of key learnings. In addition, the schools they attend generally have more deficiencies in infrastructure, educational materials, and equipment, as well as in educational and organizational processes. This section shows the extent to which vulnerable children are accessing and completing preschool, primary, and secondary education, and the barriers to learning that these children face.
Access to and progress in compulsory education: Analysis by age group
Table 6 below displays for different subpopulations of children (by age group): (i) the school attendance rate; (ii) the attendance rate at the educational level corresponding to the typical age; and (iii) the percentage of the population by age group that completes each educational level following an uninterrupted schooling path. These are estimates using data from ENIGH (INEGI, 2018).
All children in the age groups 3–5, 6–11, and 12–14 must attend preschool, primary, and secondary school, respectively. At the national level, only children aged 6–11 are very close to achieving universal school attendance (98.8 percent), whereas 93.5 percent of the 12–14 age group and only three-quarters (76 percent) of children aged 3–5 attend school. Children with social vulnerability attend school less than those in better conditions (see Table 6 below).
It is desirable that students enter school at a certain age and follow uninterrupted paths, as this is associated with a greater probability of completing compulsory education. In secondary education and following levels, there are significant proportions of children who study at older than typical ages (over-age students). This situation may be due to temporary dropout or grade repetition, which is usually associated with poor school performance. When this occurs, a vicious circle is created, since rarely does the school resolve the learning deficits of its students to ensure their full inclusion in the educational process. This means that over-age children are more likely to fail and drop out again.
The attendance rate indicator at the education level that typically corresponds to age roughly measures an uninterrupted school progression—that is, timely school attendance. Only 84.5 percent of 12–14-year-olds attend secondary school and almost 10 percent still attend primary school (see Table 6 below). Uninterrupted school progressions are less common among vulnerable children than among their non-vulnerable peers.
The social mandate that establishes that all children must complete the compulsory educational levels can be partially monitored with the percentage of students that complete a certain level following an uninterrupted path. Thus, if a child is in the first grade when he or she is six years old and continues to make uninterrupted progress in school—without failing or repeating grades or temporarily dropping out—then by the age of 12 this child should have completed primary education. This would be the case if the MES were effective in guaranteeing universal access to schooling for all children, and in reducing school dropout and grade repetition.
By 2018, 88.9 percent of children aged 12–14 had completed primary education, and 81.6 percent of those aged 15–17 had completed secondary education. There are no statistically significant differences by gender for children aged 12–14 with completed primary education, but in the age group 15–17, more girls (83.8 percent) than boys (79.3 percent) complete their secondary education in time (see Table 6 below). Given that late entry to school, dropout, and grade repetition are more frequent among children in vulnerable conditions, lower rates of completion in primary and secondary education are observed in these children (see Table 6).
Table 6. School attendance rate, percentage of population with complete education levels, and school attendance rate at educational level typically corresponding to age by selected subpopulation (2018).
|
|
School attendance rate by age group |
Attendance rate at educational level typically corresponding to age |
Percentage of children with complete primary or secondary education by age group |
|||||
|
Secondary school |
High school |
Primary education |
Secondary education |
|||||
|
3–5 |
6–11 |
12–14 |
15–17 |
12–14 |
15–17 |
12–14 |
15–17 |
|
|
Total population |
76.0 |
98.8 |
93.5 |
74.2 |
84.5 |
66.4 |
88.9 |
81.6 |
|
Sex |
||||||||
|
Male |
75.9 |
98.7 |
92.8 |
73.1 |
84.1 |
64.6 |
89.0 |
79.3 |
|
Female |
76.2 |
98.8 |
94.2* |
75.4* |
85.0* |
68.2 |
88.7* |
83.8* |
|
Type of community |
||||||||
|
Rural |
75.7 |
98.4 |
90.3 |
60.9 |
81.3 |
53.9 |
88.0 |
76.1 |
|
Semi-urban |
75.7 |
98.9 |
92.7* |
75.5* |
83.1* |
69.1* |
87.6* |
82.9* |
|
Urban |
76.3 |
98.9 |
95.2* |
80.1* |
86.4 |
71.5 |
89.6 |
83.7 |
|
Ethnic status |
||||||||
|
Indigenous population |
73.0 |
97.8 |
88.0 |
64.0 |
78.4 |
54.6 |
85.7 |
71.1 |
|
Non-indigenous population |
76.4 |
98.9* |
94.1* |
75.5* |
85.3* |
67.8* |
89.2* |
82.8* |
|
Disability status |
||||||||
|
With disabilities |
71.7 |
89.3 |
73.4 |
54.0 |
56.4 |
43.5 |
66.3 |
58.4 |
|
Without disabilities |
76.1 |
99.0* |
94.1* |
74.8* |
85.4* |
67.1 |
89.5* |
82.2* |
|
Education level of head of household |
||||||||
|
No education |
64.6 |
94.0 |
84.3 |
50.5 |
72.6 |
40.7 |
81.2 |
63.0 |
|
Incomplete basic |
71.5* |
98.2* |
89.1* |
61.4* |
79.9 |
53.3* |
87.7* |
74.6* |
|
Complete basic |
75.4* |
99.4* |
95.6* |
77.4* |
86.7* |
69.9* |
89.3* |
85.6* |
|
Complete high school |
81.6* |
99.6 |
98.2* |
90.3* |
89.6* |
83.5* |
91.0* |
89.7* |
|
Complete higher education |
89.1* |
99.8 |
99.4* |
95.7* |
91.8* |
87.2* |
92.1* |
90.0 |
|
Income quintile |
||||||||
|
I |
71.8 |
97.7 |
88.9 |
63.9 |
79.5 |
54.5 |
86.5 |
73.9 |
|
II |
73.7 |
98.9* |
93.1* |
71.7* |
83.6* |
63.8* |
88.4* |
79.7* |
|
III |
75.5 |
99.0 |
94.5 |
73.3 |
86.4* |
66.5 |
89.9* |
84.1* |
|
IV |
79.6* |
99.4 |
96.2* |
79.7* |
88.3 |
71.7* |
91.2* |
84.1 |
|
V |
85.9* |
99.6 |
97.2 |
86.7* |
87.2 |
80.0* |
89.2 |
88.2* |
|
Work status |
||||||||
|
Extra-domestic work ≥ 20 h |
n.d. |
n.a. |
37.9~ |
26.5~ |
33.5~ |
16.5~ |
80.0 |
56.2 |
|
Mixed work ≥ 20 h |
n.d. |
100.0 |
59.9* |
40.0* |
49.6 * ~ |
30.4* |
80.3 |
63.1* |
|
Domestic work ≥ 20 h |
n.d. |
93.5* |
71.7* |
39.5 |
59.1* |
29.4 |
79.0 |
61.5 |
|
No work or < 20 h |
n.d. |
99.1* |
97.0* |
90.6* |
73.5* |
63.6* |
75.5 |
68.4* |
|
Poverty status2 |
||||||||
|
Poverty |
69.3** |
98.0** |
90.3** |
66.6** |
80.9** |
58.0** |
87.3** |
76.7** |
|
Extreme poverty |
54.9** |
94.7** |
77.2** |
44.9** |
66.7** |
32.7** |
81.5** |
52.6** |
|
Moderate poverty |
73.5** |
98.8** |
93.2** |
70.9** |
84.0** |
63.0** |
88.5** |
81.4** |
|
Not poor or vulnerable |
100.0 |
100.0 |
99.6 |
95.2 |
90.8 |
88.8 |
90.8* |
93.2* |
Note: ~ Adjusted Coefficient of Variation greater than 10 percent. See technical note “Criterio de precisión” in Panorama Educativo de México 2017 (INEE, 2018, p. 171).
1 See technical note “Subpoblaciones, nivel de escolaridad y población atendible” in Panorama Educativo de México 2017 (INEE, 2018, pp. 167–170).
2 These categories are not entirely exclusive. Poverty comprises extreme poverty and moderate poverty.
* Statistically significant difference at a 95 percent confidence interval from the previous category.
** Statistically significant difference at a 95 percent confidence with respect to the “not poor or vulnerable” category.
n.d. Not available. n.a. Not applicable.
Calculations based on the Encuesta Nacional de Ingresos y Gastos de los Hogares 2018 (INEGI, 2019), for total population and the following subpopulations: sex, type of community, ethnic status, educational level of head of household; on Medición de la Pobreza en México 2018 (Coneval, 2019) for the income variables, income quintile, and poverty variables, and Encuesta Nacional de Ocupación y Empleo, 2nd trimester 2019 (INEGI, 2019) and Encuesta Nacional de Ocupación y Empleo, Módulo de Trabajo Infantil, 4th trimester 2017 (INEGI, 2017), for the work condition variable.
Barriers to learning
Children and young people at the bottom of the pyramid have, for all the reasons described above, fewer opportunities to learn, which is the ultimate purpose of the right to education. In addition to the difficulties described in having access to and remaining in school long enough to achieve the necessary skills to meet the demands of society, these population groups face special challenges in language, teacher preparation, and limited infrastructure.
In the case of indigenous children, in addition to poverty, a fundamental challenge is the language of instruction. Indigenous students who attend school almost always receive instruction in Spanish, although in some cases teachers who speak the same language, about half of them, use it to teach. Working materials, textbooks, and the school environment in general are all in Spanish. In these circumstances, children take much longer to learn to read and write (many succeed only at the age of 10), and their mastery of the content included in the curriculum is consequently much lower. This helps explain their low achievement on the learning tests described above.
In small and/or dispersed rural communities, where schools do not have one teacher per grade, there is a lack of teaching methodologies that take advantage of grade and age diversity. Teachers who have not been trained to deal with multigrade groups tend to divide time between grades, which places students at a disadvantage compared to schools with one teacher per grade (Schmelkes & Aguila, 2018).
Children and young people living in poverty attend schools that have suboptimal infrastructure, equipment, and resources for learning more frequently than their peers not in poverty. Teachers are less experienced, have less access to in-service training opportunities and, in general, their classroom practice is teacher-centered, based on rote learning, non-inclusive, and does not integrate learning with the students’ contexts, making the school experience alien to them. This also partly explains why students at the bottom of the pyramid achieve lower scores on school tests. In schools in indigenous and rural areas, and in some cases in marginal urban areas, teacher absences tend to be more frequent, and less time is spent in school for instructional purposes (see Anzures Tapía, 2020, for preschool). When culturally and linguistically diverse populations are present in schools, such as in urban areas or migrant agricultural camps, discrimination often occurs, making the school environment more difficult and causing students to drop out.
These situations combine to prevent those at the bottom of the pyramid from learning: they have more difficulty accessing school; they have more difficulty remaining and progressing through the school system; and they face poorer material conditions, teachers with less training, pedagogical practices that constitute barriers to learning, and non-inclusive—sometimes even discriminatory and hostile—school environments. The result of this perverse synergy of hostile conditions for those who are most disadvantaged is early school abandonment, truncated or incomplete compulsory schooling, and, most distressingly, the absence of the necessary learning to live a dignified life. The education system, not designed with an equity perspective, fails to break the intergenerational transmission of poverty.
Education policies currently in place to serve the bottom of the pyramid6
In this section, we briefly describe the pro-equity programs promoted by the administration of President López Obrador and report on the budget assigned to them in the year 2020, on the understanding that the expenditure allocated to their implementation is a fundamental indicator of the priority given to them. It is highly probable that these programs have experienced important budget cuts due to the austerity measures implemented by the federal government in 2020, and further affected by the COVID-19 pandemic. When this chapter was written there was no information available on the size of these cuts.7 Nevertheless, we consider it important to show the changes in educational expenditure that the present administration has carried out until now.
Federal spending on basic education is carried out through budgetary programs (BP) that can be divided into federalized spending programs (FSP) and federal programs (FP). Through the FSPs, resources are transferred to the federal entities for specific purposes, mainly to maintain the regular operation of school services (LCF, 2018, January 30). In general, this spending is inflexible. The FPs, on the other hand, are based on agreements between the federal and state governments, and their purpose is to finance actions to promote integral education. These programs are subject to change. For the purposes of this section, FPs are explicitly labeled to distinguish them from programs for the general student or teacher populations. 8 It is worth mentioning that, in the year 2020, about 89 percent of federal spending on basic education will go to federalized spending programs, and the rest to federal programs (see Table 7 below). This information comes from the Federal Expenditure Budget 2019 and 2020 (DOF, 2018; 2019h), which is the only available resource that reveals the structure of federal education spending. This chapter reviews the operating rules of such pro-equity programs (see Table 7).
Table 7. Federal spending on basic education by budget program (millions of pesos) (spent in 2018; planned for 2019 and 2020).
|
Type of program |
Target population |
Nominal (% of total) |
In 2018 prices2 |
Diff. |
|||||||
|
2018 |
(%) |
2019e |
(%) |
2020e |
(%) |
2018 |
2019e |
2020e |
2018–2020 |
||
|
Federalized spending program |
General |
418,933.4 |
91.1 |
428,241.0 |
88.1 |
443,135.3 |
89.2 |
418,933.4 |
413,216.6 |
413,128.8 |
-5,804.6 |
|
Federal program |
General |
4,896.3 |
1.1 |
4,768.5 |
1.0 |
5,385.8 |
1.1 |
4,896.3 |
4,601.2 |
5,021.1 |
124.8 |
|
In vulnerability conditions |
35,968.0 |
7.8 |
52,996.4 |
10.9 |
48,167.6 |
9.7 |
35,968.0 |
51,137.0 |
44,905.9 |
8,937.9 |
|
|
40,864.4 |
8.9 |
57,764.9 |
11.9 |
53,553.3 |
10.8 |
40,864.4 |
55,738.3 |
49,927.0 |
9,062.7 |
||
|
Total in federalized spending programs and federal programs |
459,797.7 |
100.0 |
486,005.9 |
100.0 |
496,688.6 |
100.0 |
459,797.7 |
468,954.9 |
463,055.8 |
3,258.1 |
|
|
(Real percentage change compared to 2018) |
2.0 |
0.7 |
|||||||||
1 The target population was determined based on the Rules of Operation or Guidelines of each budget program.
2 Nominal values were deflated by the National Consumer Price Index (INPC). The monthly INPC was annualized and the 2018 average was taken as a reference. For 2020, we used the expected inflation according to the Encuesta sobre las Expectativas de los Especialistas en Economía del Sector Privado: Enero de 2020 (Banxico, 2020, February 4), which was 3.5%.
e Estimations, according to the approved budget in the Presupuesto de Egresos de la Federación for 2019 and 2020.Source: Calculations based on Cuenta de la Hacienda Pública Federal 2018 (SHCP, 2019); Presupuesto de Egresos de Federación 2019 and 2020 (SHCP, 2020); and Índice Nacional de Precios al Consumidor (INEGI, 2020).
In 2020, there were 11 ongoing federal programs that were designed to promote equity, six of which were new initiatives. The three most important initiatives continuing from previous administrations include:
- Benito Juárez Basic Education Scholarship Program for Welfare, which replaced the Prospera program launched in 1997.9 This program seeks to promote attendance, permanence, and graduation from compulsory education for children and young students enrolled in basic education institutions, whose families: (i) are located in priority localities and/or with children under five years of age residing in those localities, or (ii) have an estimated monthly per-capita income below the Coneval Income Poverty Line (LPI)10 (DOF, 2019a). In 2020, the planned budgetary allocation for this cash transfer program is $1,348.5 million (30,475.111 million pesos), an amount that is 50 percent higher, in real terms, than what Prospera spent in 2018, a share of 63.3 percent in the total planned spending for federal programs on basic education for vulnerable populations. It is expected that each beneficiary family will be granted a scholarship consisting of 800 pesos ($36.34) per month during 10 months of the year.
- The Full-Time Schools Program,12 in effect since 2007, aims to establish full-time schools in basic education, with 6–8-hour-long days, to better promote the well-rounded education of their students. Eligible schools are single-shift public basic education institutions that meet at least one of the following criteria: (a) they are indigenous or multigrade schools; (b) they offer primary or telesecondary education; (c) they serve a population in a situation of vulnerability or in contexts of social risk; or (d) their students have low levels of educational achievement or high dropout rates. In 2020, this program was allocated a budget of $231.7 million USD (5,100 million pesos), which amounts to 10.6 percent of the federal government’s pro-equity spending, much lower than the 29.9 percent share it received in 2018.
- The Early Childhood and Community Education Program is aimed at subpopulations in localities with high and very high levels of marginalization and social backwardness that should be served by the CONAFE system, especially the indigenous population. In early childhood education, the target population comprises pregnant women, and children aged 0–3 and their mothers, fathers, and caregivers. In basic community education, the target population is children and youth aged 3–16. This program intends to ensure the completion of the basic education provided by CONAFE (DOF, 2019b). In 2020, the planned expenditure for this program is $204.6 million (4,503.1 million pesos), which is less than the budget allocated in previous years (in 2018, $210.6 million or 4,634.6 million pesos).
There are six pro-equity FPs in basic education created between 2019 and 2020 by the current federal administration. In 2020, the aggregate expenditure allocation of the six new programs is $349.65 million (7,696.4 million pesos). Key examples are:
- This School Is Our School, created in 2020, aims to improve the infrastructure and equipment conditions of public basic education facilities, giving priority to those located in areas with the greatest backwardness, preferably in localities with high or very high levels of marginalization and a high concentration of indigenous people (DOF, 2019c). This is the second most important program of the current federal government, as it receives 15.1 percent of federal spending for vulnerable populations, amounting to $330.7 million (7,280.3 million pesos), equivalent to just under a quarter of what is allocated to the Benito Juárez Scholarship Program (23.9 percent). The amount defined for each school is given to the PTA to administer, and is a major innovation supporting previous school infrastructure programs.
- The Program for the Development of Meaningful Learning in Basic Education seeks to contribute to the improvement of the academic achievement of students in public basic education schools that concentrate the greatest number of students with the lowest academic achievement levels on the PLANEA standardized tests. It is designed to prioritize schools located in communities with high rates of extreme poverty and violence or a high concentration of indigenous population (DOF, 2019d). In 2020 it was allocated $7.4 million (163.9 million pesos), which represents less than one-third of a percentage point of federal pro-equity spending on basic education.
- The Support for Diversity in Indigenous Education Program aims to improve education in indigenous schools. It will give priority to schools in localities with high and very high levels of marginalization, those with lower levels of educational achievement according to PLANEA, and those with greater needs for educational materials (DOF, 2019e). However, in 2020 it will receive only $4.2 million (92.5 million pesos), one-fifth of a percentage point of federal pro-equity spending.
In closing, it can be seen that the expenditure planned by the new federal administration represents an important change in the public spending policy, but it is also clear that such spending is only a fraction of what is needed to support educational equity. The economic crisis due to the COVID-19 pandemic will likely lead to significant reductions in the pro-equity education expenditure.
Education programs that have proven effective, and their challenges
This section reports on the most important elements of three federally-driven programs that have sought to improve educational opportunities for children and youth at the bottom of the pyramid and have achieved good results. The three programs bear little similarity to each other in terms of their specific objectives, operational strategies, and timing. Fortunately, there is evidence on the achievements of each of these three programs, as described below.
Progresa-Oportunidades-Prospera, 1997–201913
The Education, Health, and Nutrition Program (Progresa) was launched in August 1997, under President Zedillo’s administration, with two objectives: 1) to improve the welfare of families by increasing their purchasing power, and 2) to develop the human capital of its members, mainly children and young people, in order to improve their future welfare and income. Underlying the design of Progresa was the conviction that investment in human capital (education, health, and food) was the best way to break the cycle of poverty (Rodríguez, 2019; Yaschine, 2019).
To address the education component, cash scholarships were provided to mothers for each child that attended school, from third grade of primary school to third grade of secondary school. The scholarship was conditional on school attendance and the amount was higher for girls and children in secondary school, in order to discourage the early entry of children into the workforce. The health component involved access to a preventive health package, health education, and the provision of food supplements for young children and pregnant or breastfeeding women, since malnutrition was proven to have long-term effects on school and work performance. The food component was addressed by providing cash transfers to families, subject to attendance to health consultations and educational sessions. These transfers represented one-third of the average monetary income of families living in extreme poverty (Yaschine, 2019).
The original beneficiaries were families living in rural areas where poverty was much more acute than in the urban environment. In 1997, 300,000 families living in extreme poverty were assisted. A few years later, coverage was extended to semi-urban and urban localities.
In 2002, educational scholarships were extended to high-school students in order to encourage secondary-school graduates to continue their studies. As of 2012, support was extended to children in rural areas in the first two grades of primary school to avoid lagging behind and encourage them to stay in school. Starting in 2017, students who were entering public universities were given scholarships and transportation aid.
The program remained a nodal part of the poverty reduction strategy for three additional administrations. During President Peña Nieto’s administration (2012–2018), the name changed to Prospera, Social Inclusion Program. By the end of Zedillo’s administration, the program was reaching 2.5 million predominantly rural households. In 2004 it reached 5 million rural, semi-urban, and urban families; in 2010 the figure rose to 6 million; and in 2017 to 6.6 million, amounting to a total of 27 million people distributed in 114 thousand localities. According to CONEVAL (Yaschine, 2019), this figure only covers 63 percent of the potential target population, since the number of people in poverty has been increasing during the last few decades.
An important contributor to the success of Progresa-Oportunidades-Prospera (POP) was its built-in robust evaluation system to describe its results and give feedback on its design and operation. All evaluation databases are public so that anyone can replicate the measurements or carry out their own analyses (Rodríguez, 2019). Thanks to this system, we know that POP did have significant positive impacts on the human capital of the beneficiary families. In spite of these results, the evidence does not show results in improving school-based learning of the beneficiaries, as measured by standardized tests (Yaschine, 2019).
Program for the Improvement of Educational Achievement, 2009–2012
The Program for the Improvement of Educational Achievement (PMLE) was created in 2009 to improve school achievement in the public primary and secondary schools with the lowest scores. The central strategy of the program consisted of developing training and personalized support networks based on tutoring relationships, taking advantage of the human resources available in the education system (SEP, 2010).
The PMLE focused mainly on the development of independent text-based learning through tutoring relationships. At the federal level—as well as in states, school zones, and schools—collegial work teams (nodes) were created to study the topics in which students performed the poorest in the ENLACE test.14 The focus on this curriculum content was complemented by the establishment of mentoring relationships within and across the nodes, allowing for the modeling and practice of the type of instruction teachers were expected to develop in their classrooms (Rincón-Gallardo, 2016).
Between 2010 and 2012, 9,072 schools were supported with training networks and personalized accompaniment based on tutoring relationships (SEP, 2012). Although only some of these schools were visited regularly by an advisor, it is possible to say that their teachers were directly exposed to the practice of tutoring networks. In those same years, more than 200 exchanges were carried out between schools, regions, and states in order to show, practice, consolidate, and disseminate the methodology of tutorial relationships (Rincón-Gallardo, 2016).
An analysis of the results obtained in ENLACE in 11,500 secondary schools was carried out, including 4,101 schools that participated in the PMLE (UPEPE, 2012). The study assumed that progress in the adoption of the tutoring-relationship methodology in each school would be strongly associated with the number of advisory visits that their teachers received: the more visits, the higher the quality of the tutoring competence in the classrooms. The program consists of three phases. In Phase 1, participants have some knowledge of the tutoring relationship methodology, but their experience is limited and they have received no counseling visits; in Phase 2, teacher networks have been established and counseling visits to schools are carried out sporadically (a maximum of five visits); in Phase 3, networks of students as well as parents have been established and regular counseling visits to the school (six or more) have taken place. As shown in Figures 1 and 2, PMLE secondary schools, in any phase, show greater increases in the percentage of students in the good and excellent levels than in non-participating schools. In addition, the progress of secondary schools whose teachers received five or more advisory visits is greater than the rest of the schools, some of which even show declines. Improvements are greater in mathematics than in Spanish.
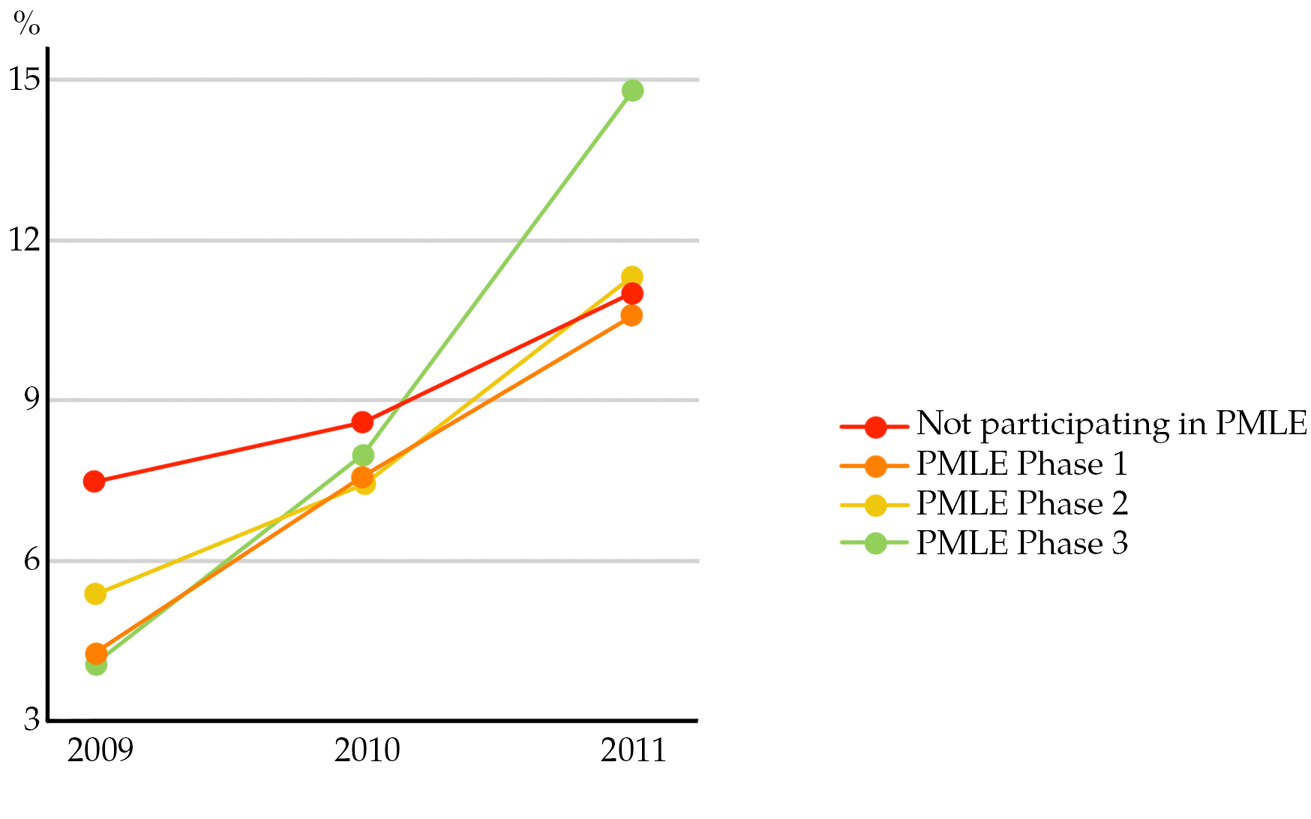
Fig. 1. Percentage of general secondary school students at “good” and “excellent” levels in mathematics, by degree of involvement in the PMLE. Source: Data obtained from UPEPE (2012).
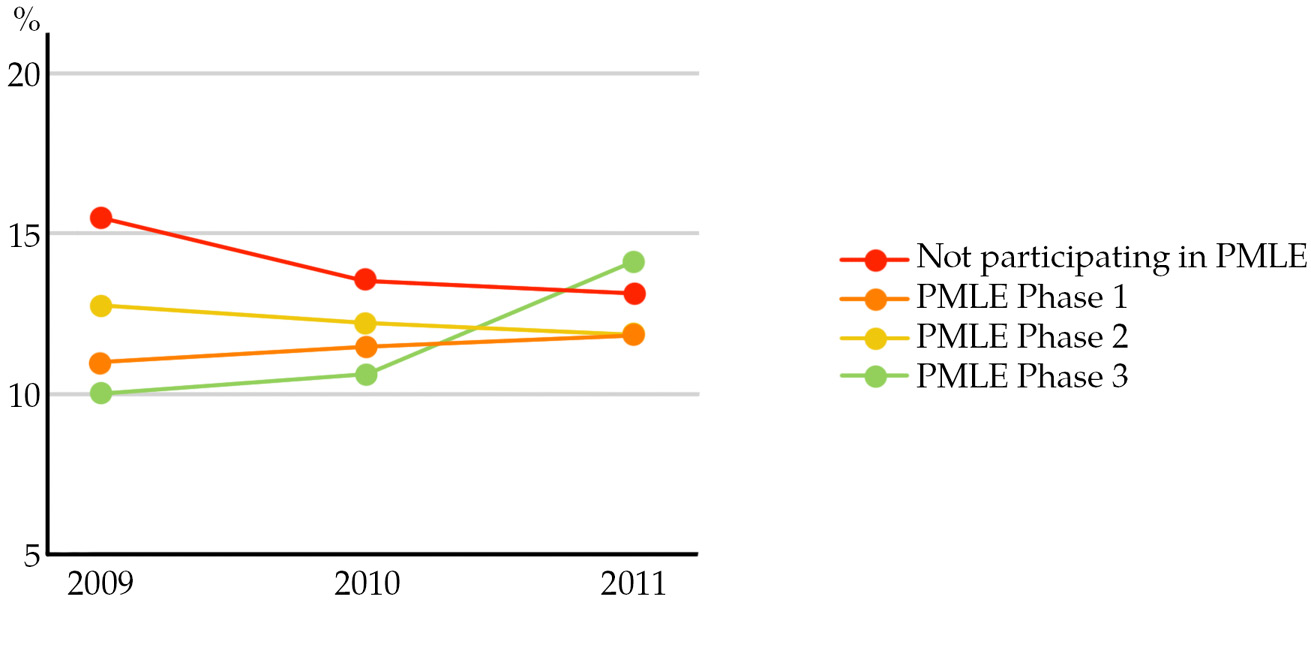
Fig. 2. Percentage of general secondary students at “good” and “excellent” levels in Spanish, by degree of involvement in the PMLE. Source: Data obtained from UPEPE (2012).
In the case of telesecondary schools (Figures 3 and 4), PMLE schools also achieved greater increases than those that did not participate in the program. In both topic areas evaluated (mathematics and Spanish), it is the schools located in Phase 1—teachers who have been exposed to the practice through workshops, but have not received advisory visits to help them with implementation in their classrooms—that show the most progress, even more so than the schools that received more visits. One hypothesis for this result is that contact with a new methodology enhances motivation for teaching change and creates a motivational feedback loop.
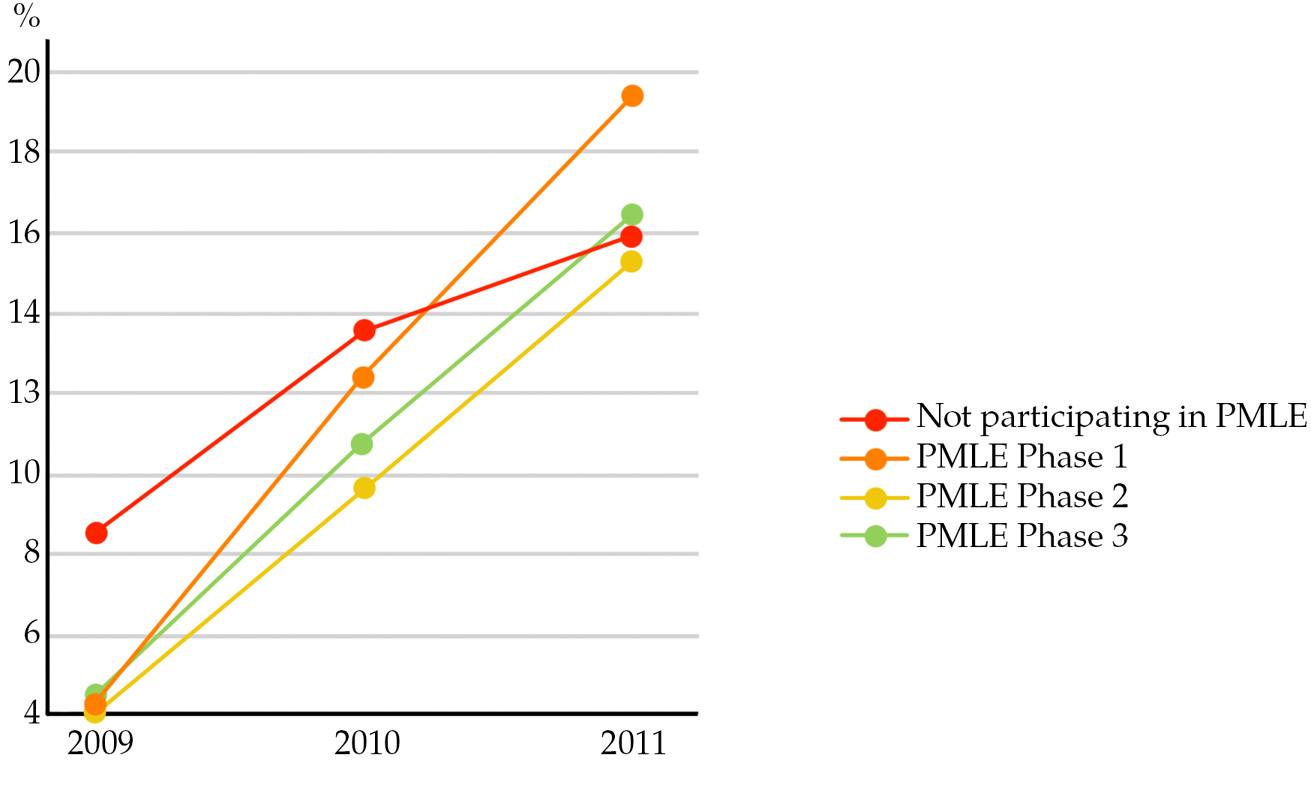
Fig. 3. Percentage of telesecondary students at “good” and “excellent” levels in mathematics, by degree of involvement in the PMLE. Source: Data obtained from UPEPE (2012).
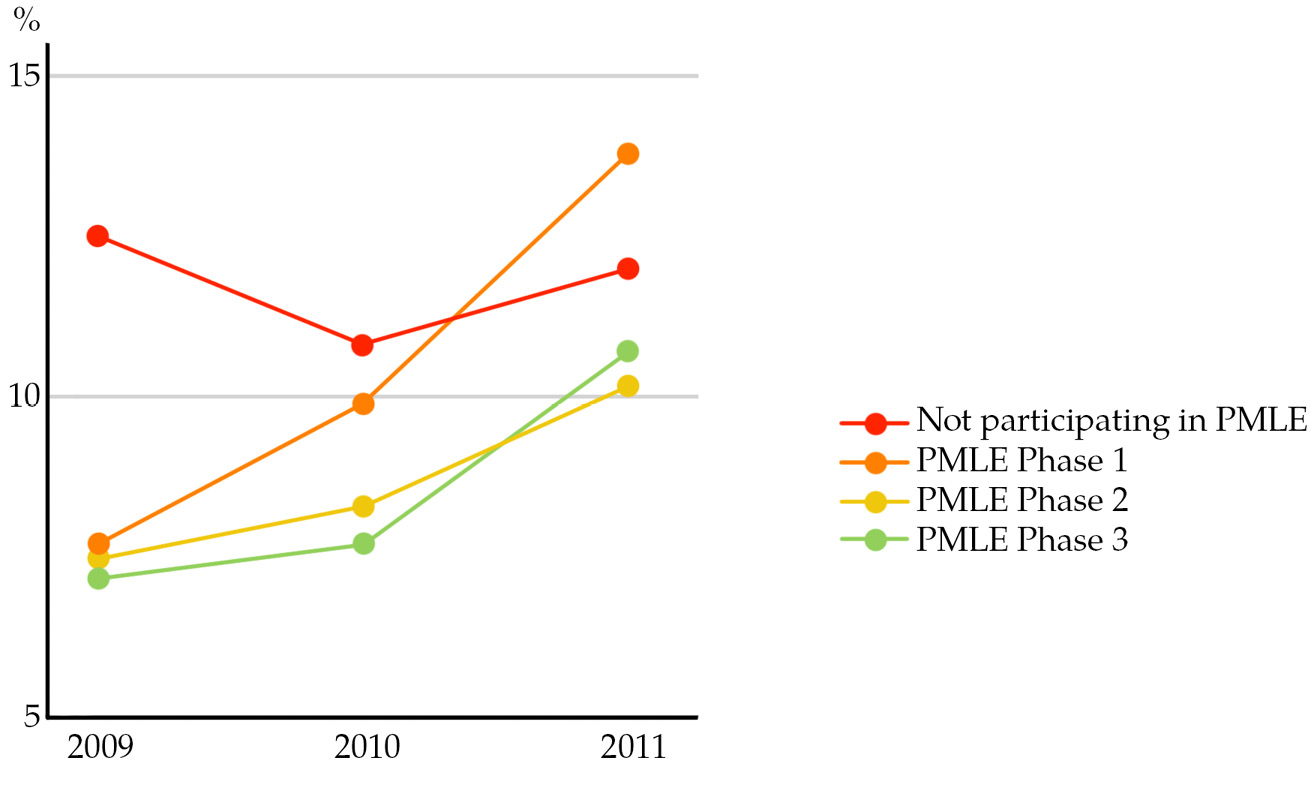
Fig. 4. Percentage of telesecondary students at “good” and “excellent” levels in Spanish, by degree of involvement in the PMLE. Source: Data obtained from UPEPE (2012).
The PMLE ended abruptly in December 2012 when a new federal administration took office.
Full-Time Schools Program, 2007 to date
The Full-Time Schools Program (PETC) is the only federal intervention targeting public basic education schools that has remained in place over the past three presidential six-year terms. It was launched in the 2007–2008 school year as a pilot initiative intended to improve learning opportunities for girls and boys by increasing the time they spend in school each day, on the assumption that this additional time would be devoted to strengthening the teaching of curricular content. Over the years, this mandate has been expanded to include other objectives beyond strengthening the curriculum, and additional actions have been taken to tackle malnutrition and improve social harmony (Luna & Velázquez, 2019).
For the year 2020, the general objective of the PETC is: “To establish, gradually, progressively, and in accordance with budgetary sufficiency, schools with a full schedule in basic education, with six-to-eight-hour-long days, to promote better use of available time, improve academic performance and encourage participation in activities related to the knowledge of civics, humanities, science and technology, the arts―especially music―physical education and environmental protection” (DOF, 2019j).
Like all schools in Mexico, full-time schools operate for 200 school days a year, but extend their hours from 4–4.5 to 6–8,15 depending on whether they are primary or secondary schools and whether they offer food service or not. Full-Time Schools (FTS) can decide how to use the additional hours to work on their School Improvement Program, taking into consideration the seven Educational Lines of Work defined by SEP.16
In its early days, the PETC was aimed at public basic education schools that served populations in unfavorable conditions in urban contexts with poor educational results (Luna & Velázquez, 2019). As the program has expanded, its target population has been extended to cover rural populations; by 2020, the target population comprises single-shift public basic education schools that meet at least one of the following criteria: a) are indigenous or multigrade education schools; b) offer primary or telesecondary education; c) cater to populations in vulnerable situations or in contexts of social risk; and, d) have low levels of educational achievement or high dropout rates (DOF, 2019j).
During the administration of President Enrique Peña Nieto (2006–2012), the number of FTS increased considerably. As can be seen in Figure 5, in 2013, the number of schools incorporated into the program grew 129 percent to 15,349 schools and, in 2014, it grew a further 50 percent to a total of 23,182 schools. From 2015 to date, the number of schools has stabilized, as growth rates have not exceeded 2.5 percent since then. The figure reported for 2019 is 25,697 primary and secondary schools.
In the current school year (2019–2020), half of all FTS offer food service. This figure rises to 75 percent for indigenous primary schools, 62 percent for indigenous preschools, and 56 percent for telesecondary schools—the three types of schools that serve populations at the bottom of the pyramid (see Figure 5).
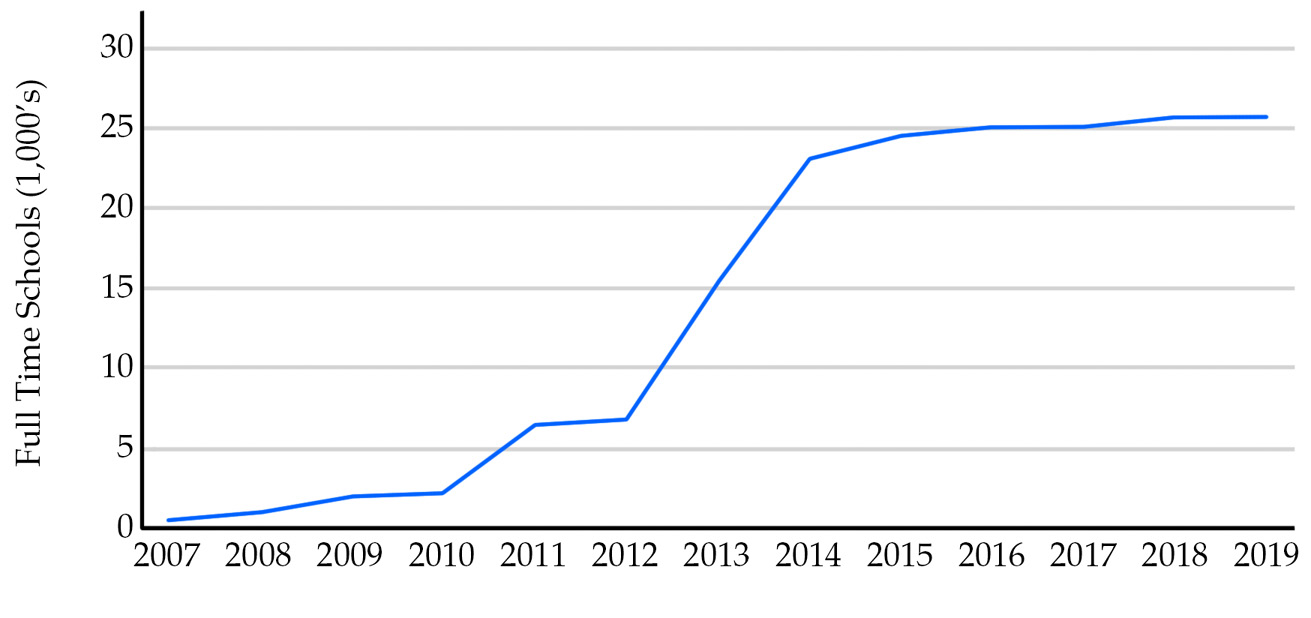
Fig. 5. Full-time schools, 2017–2019. Source: Prepared by the authors using varied sources.
The results of the PETC, SEP (2017) include two independent investigations that show evidence of its impact. Both Andrade (2014) and Cabrera (2014) observed a positive effect on student performance in reading and math—as measured by the ENLACE test—and found cumulative effects. Another study, conducted by Padilla (2016), found that during the first year of implementation of PETC, the extension of the day does not affect Spanish and math scores, but during the second year, increases are observed in both subjects. Padilla also states that the effects are greater for students from schools located in highly marginalized areas and for those in the lower grades.
Sylveira and colleagues (2018) report that “participation in PETC reduces the proportion of students at the lowest level of performance on standardized tests by about 4.6% in Mathematics and 1.77% in Language. On the other hand, there is an increase in students at the highest performance level” (1.62 percent in mathematics and 0.63 percent in language). The results of the study revealed that the schools with the most marginalization participating in the PETC showed “greater reductions in the proportion of students at the lowest level of achievement in Mathematics and Language, and with severe educational lag” (p. 8).
From the results of these evaluations, it can be stated that the PETC has contributed to improving the school performance of students, especially the least advantaged among them. However, it cannot be concluded that the improvements are due to better use of time for teaching, as the program does not provide teacher training support. Among the hypotheses to explain the improvements in test outcomes is, of course, the feeding of children in poverty. However, it seems even more plausible that the gains are due to the increased time that children spend away from activities that do not promote learning (Cabrera, 2018).
Initiatives that address educational challenges at the bottom of the pyramid
There are several pilot projects at different scales that are aimed at improving learning among those at the bottom of the pyramid. Unfortunately, they have not been evaluated and there is not enough evidence that they actually improve learning. We have chosen to describe two of these initiatives because of their wide acceptance and their potential for impact.
Tutoring Networks
When the PMLE (discussed above) ended in December 2012, several of its promoters formed a civil society organization17 that continues working to promote the adoption of this alternative methodology in primary schools, secondary schools, and high schools, both in Mexico and abroad.18
Tutoring Networks (TN) is based on two fundamental pedagogical purposes: 1) to generate collaboration and dialogue between those who want to learn and those who are able and willing to share what they have previously learned, and 2) to achieve in each student the commitment and capacity to learn autonomously, through the development of reading, writing, oral expression, and mathematical reasoning skills. Both purposes involve placing at the center of interactions between tutors and learners their confidence and ability to become aware of their own personal learning process while recognizing that of others.
Tutoring begins when the student chooses the topic of study from a variety of options offered by the tutor, over which the tutor has already acquired mastery. Once the learner has chosen the topic he or she is interested in learning about, the individual process of inquiry and study begins. The student works at his or her own pace, puts learning strategies into play, and decides what to do. The tutor keeps an eye on this process and offers support when the learner has a need, encouraging him or her to identify and overcome his or her difficulties. Errors are key to the learning process; the learner has the opportunity to analyze the logical sequence followed to construct a statement and cannot continue until he/she understands how he/she reached an incorrect or a correct answer. The tutor must help the learner to identify the specific elements of success in the topic at hand (Lopez, 2016).
As the tutoring progresses, the learner records, in writing, the learning process. Writing helps organize ideas, express doubts, identify findings, and clarify how the learner has managed to understand the chosen topic—that is, to reconstruct the mental process by which the learner synthesized the known with the unknown in order to achieve an understanding of the new topic.
The written record of the learning process functions as evidence of achievement and as support for preparing the public demonstration, which must be made in front of the group (and sometimes also family members and the community) to share with others what has been studied and how it has been learned. This public “demonstration” is also evidence of learning; in addition, it allows the tutor to know if a learner is able to provide tutoring on the subject to another person. By demonstrating a topic, the learner becomes a tutor.
The possibility for each apprentice to become a tutor after learning a subject in-depth is a core part of TN. No one learns something as well as when teaching it (Cámara, 2014; Rincón-Gallardo, 2012). When tutoring occurs among peers, it contributes to the formation of a support network in which personalized attention does not depend on the teacher or the number of members in a group. Everyone learns from everyone else and, therefore, the roles of teacher and students are reconfigured by the creation of a community that is willing to learn and share (López, 2016; Rincón-Gallardo, 2016).
TN is a highly portable methodology and, once it is learned, few seem to wish to return to conventional practices; it only requires the will to learn and textual resources in various formats. It has been easily rooted in marginalized schools, where needs are greater, while institutional controls and resistance to disrupting conventional school culture are weaker. In these contexts, it has been possible to attempt to transform the core of instruction—the relationship between teachers and students—in large part because this change makes improvements in learning more visible (Rincón-Gallardo, 2014).
While no formal studies have assessed the impact of TNs so far, there are testimonies from students, teachers, supervisors, and graduates,19 as well as some writings from leading education scholars that remark on their promising benefits for learning.20 The results of the PEMLE, described above, give credibility to the potential of this approach for learners at the bottom of the pyramid.
Attendance, Permanence, and Learning model
The Attendance, Permanence, and Learning (Asistencia, Permanencia, Aprendizaje or APA) model was designed21 to support state governments as they converged their education policy decisions around three fundamental objectives: student attendance, retention, and learning in compulsory education. The APA model was first implemented in the state of Puebla22 during the 2011–2017 administration. The state education authorities sought to address problems of quality and equity through an accessible, high-impact model of education policy that could be easily communicated and understood by all stakeholders, so that they could integrate and work towards common goals (INEE, 2018c). The objectives proposed by the APA model are:
- Attendance. All girls and boys aged 3–17 should attend school.
- Permanence. All students should complete high school (Grade 12).
- Learning. Each student should acquire at least the basic knowledge established in the curricula.
These objectives would be achieved by promoting an education policy centered on four management strategies:
- Focalization. Since the available resources (human, budgetary, material) are insufficient, all actions must be targeted so as to achieve greater equity and reduce inequality gaps, which means giving priority to those most in need of support. Resources should target schools in a number small enough to guarantee a significant impact.
- Articulation. Good coordination between state and federal programs, educational levels, and agencies within the education sector and outside of it is essential to ensuring the complementarity of the actions.
- Implementation. Coordinated action by the education system requires communication that ensures that everyone involved agrees on the various efforts and its objectives, and understands their powers and responsibilities. A good part of the success of the model lies in the ease of understanding and sharing these objectives.
- Accompaniment. The articulated implementation must be accompanied so that the actions developed and the perception of the different actors can be monitored in order to identify risks and opportunities at the right time.
In the case of Puebla, the model was applied to 500 schools—200 primary schools and 200 secondary schools selected for their low results in the ENLACE test—as well as 100 preschools whose graduates were mostly served by the targeted primary schools. Although academic performance was the only criterion used to choose these schools, the high correlation with socioeconomic level meant that the selected schools were located in the lowest income deciles. Participation was voluntary, so that schools that did not wish to be included were replaced.
Multiple actions were promoted to serve each of the four levels of compulsory education, seeking to involve all actors (students, teachers, principals, supervisors, and parents). Supervisors (950) were trained in leadership skills and the Puebla Supervisors’ Academy was created. An APA report was generated for each at-risk student in each of the state’s schools.23
The results of the implementation of the APA model in academic performance were very positive, as reflected in the national evaluations (Figure 6)24 that shows the annual rank occupied by Puebla in standardized tests as compared to the other 31 states.25
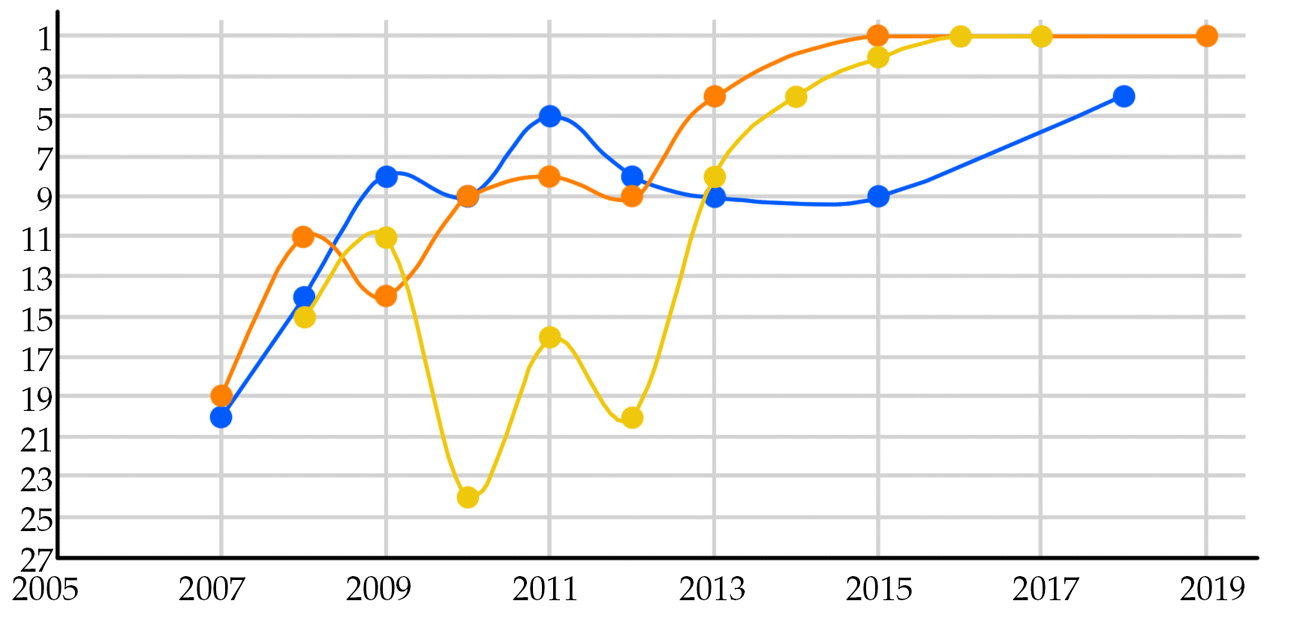
Fig. 6. Puebla’s ranking relative to both rich and poor states. Source: Data from SEP, ENLACE 2006 to 2013, and PLANEA 2015.
Although all schools increased their achievement scores (de Hoyos, in press), Puebla’s 200 targeted secondary schools, between 2013 and 2015, not only ceased to be in the last quartile of performance in language and mathematics, but in both subjects exceeded the national average recorded in the PLANEA test. In 2015, for the very first time, Puebla’s secondary schools achieved first place nationally in mathematics and third place in language and communication. These results also reflect progress in equity. Puebla has managed to remain in first place nationwide in terms of academic achievement, despite being one of the five most marginalized states in Mexico.
To some extent, the scalability of the APA Model is demonstrated by the fact that it has been implemented in a state that has a compulsory education enrollment (K-12) that is twice as large as Finland’s. Other important attributes are its sustainability and its transferability to other locations. In Proyecto Educativo’s opinion, the fact that Puebla has remained at the top of the national tests for five consecutive years seems to be due to the work of the supervisors and the creation of collegial bodies in which teachers participate. It is worth mentioning that other Mexican states—Sonora and Coahuila—have already replicated it with some local changes, demonstrating that the APA model can be adapted to other national regions and beyond.
Improving educational policies for the poor
Historically, education policy in Mexico has been successful in improving access to school, as well as permanence. Since the creation of the Secretariat of Education in 1921, Mexico has achieved almost universal primary education, it has expanded preschool to three years, it has made lower- and higher-secondary education compulsory, and it has diminished dropout rates at the primary- and lower-secondary levels.
Even so, the expansion of the Mexican Educational System has been constant but unequal, benefiting those in urban and more developed regions first, and leaving small rural and indigenous communities to the last. This trickle-down model is still in operation with the educational levels that are still expanding, as is the case with preschool and higher-secondary education. Thus, it is the students in these conditions that find it more difficult to attend school and complete their compulsory education. Being in school is a condition for school-based learning, and thus it is a matter of concern that 4.8 million children and adolescents aged 3 to 17 are not in school. So even though the Mexican Educational System has shown a steady expansion of educational opportunities, around 15 percent of school-aged children and adolescents are not even enrolled at the different levels of education. They are at the bottom of the learning pyramid.
But what is really alarming is the number of children and adolescents who are in school but are not learning. We have shown that between one- and two-thirds of students enrolled in the Mexican Educational System is achieving below Level 2 in the standardized tests based on the national curriculum. PISA (OECD, 2019) and LLECE (UNESCO, 2015) assessments show similar results. Those that have been situated at the bottom of the learning pyramid are children and adolescents living in small rural communities, indigenous students, children that work, those living in highly marginalized areas, internal migrants, and disabled students. There is a strong correlation between all of these characteristics and learning results in standardized tests. Those that are located at the bottom of the learning pyramid according to standardized tests represent at least 50 percent of children and adolescents in school. This amount is alarming and does not correspond to what one would expect of a middle-income country. Mexico has not been successful in achieving the learning what standardized tests measure. Neither has it been successful in improving these results (Backhoff et al., 2017).
It is important to analyze the causes of this reality. An external cause is, of course, poverty and its consequences, such as the need to work, malnutrition, migration, as well as the fact that those in poverty tend to have parents with less schooling who are less able to help in school-related activities. But there are also at least three very important factors that can improve educational policy for the poor in Mexico.
The first is the training of teachers. In Mexico, teacher training was a technical career (three years after lower secondary) until 1984, when it became a tertiary-level education, lasting four years after higher secondary. Nevertheless, little changed in the way teachers were taught, because those training future teachers were the same as before. It has taken a long time for teacher-training institutions to evolve towards improved quality teaching. Teacher training does not take place in universities, but in normal schools, of which there are 464 in Mexico. Most of these normal (teacher-training) schools are very small and have no capacity for carrying out research. Normal schools in general have very few experts in the disciplines as professors; they are mainly people who have been trained as teachers themselves and who reproduce the way they were taught. The result is low-quality teaching of graduates who, once in the classroom, receive inadequate in-service training and little pedagogically oriented supervision. In many classrooms, and particularly in those in the poorer regions, teachers teach by rote instruction and have no training in inclusive pedagogy. Forty-six percent of primary schools in Mexico are multigrade (one teacher teaching more than one grade, sometimes even the six grades in small communities), and teachers receive no training in multigrade methodology.
The second is the curriculum and the language of instruction. When the modern school system was installed at the beginning of the last century, schools were conceived as the route towards integration into the mainstream culture. At that time, about 25 percent of the population were indigenous language speakers, but indigenous children attended schools where they were taught in Spanish. As a consequence, indigenous children learned very little and took a long time to become literate. Though things have changed somewhat over the years—and, at least in theory, indigenous primary schools teach their students to be fully bilingual—the force of the original momentum explains why even teachers themselves believe that using Indigenous languages is a sign of backwardness. Curriculum in Mexico has been national and uniform since the inception of the present system, and for non-mainstream children and youth, what they learn in school remains foreign to their context and interests. Thus, lack of relevance of school-based education for a large percentage of the population is another important cause, to which we must add the small degree of parent and community participation in schools, which helps to explain the likelihood of low educational aspirations.
The third cause is the fact that equity in education, and particularly equity in learning, has never really been a priority in the Mexican Educational System. The priority a country gives to equity in education is reflected in the way resources—financial, physical, pedagogical, and human—are distributed among the different sectors of the population. In Mexico, those who are dispossessed receive the least and poorest resources or all types. Traditionally, resources have been distributed according to political motives more than to equity-related criteria.
Conclusions
The learning problem of more than half of the Mexican school-aged population that is described in this chapter is based on information that is available but still incomplete. Further, and more detailed, information is needed in order to be able to carry out an in-depth analysis of those children who are not in school or not learning in school. Standardized achievement tests are partial because they only consistently measure the school-based areas of language and mathematics.26
Policies and programs have been put into place to mitigate the effects of poverty on education, but they continue to privilege access and permanence in education, rather than learning. Some have shown an ability to mitigate inequality, and some have been evaluated as to their impact (the case of Prospera or Full-Time Schools). Civil society organizations have developed interesting initiatives for improving learning at the bottom of the pyramid, which have shown signs of being successful on a smaller scale and should be looked into more deeply.
The government that came into office in December of 2018 modified the Constitution in 2019, and established educational equity as a priority. It also defined education in Mexico—in addition to the historical definition of free and lay—as inclusive and intercultural. Unfortunately, the programs that have been put in place to date are still oriented towards improving access and permanence, not learning that is both inclusive and intercultural. Hopefully, we can expect future changes that can bring about learning equity among those at the bottom of the pyramid.
Appendix
Information and knowledge gaps
Information is necessary in order to be able to identify educational problems and to design adequate policies to face them. The information that we have used to identify vulnerable and marginalized populations with respect to education gives us a clear idea of both the size and the location of the problems. Educational research uses this information to further explore causes and possible solutions.
However, in spite of continuous efforts to improve the information available, in Mexico we still have serious information gaps that prevent us from achieving these ends.
Information on teachers of compulsory education
Historically, information on teachers in the national education system has been very limited. It has not been in the interest of the National Union of Education Workers to make this information accessible to the public. In 2014, a Census of Students, Teachers, and Schools of Basic Education (CEMABE) was carried out for the first―and, to date, the only―time. It yielded school-by-school information on enrolled students, teachers assigned to them, and some information on their working conditions. From this census we know, in broad terms, that the number of basic education workers that year was 1,949,105. Of them, 88.1 percent worked in basic and special education schools, 2 percent in special-education-support work centers, and 9.9 percent in other work centers. The number of people working as classroom teachers was 978,118.
In 2015, the National Institute for Educational Evaluation (INEE) published in its annual report for 2015 (INEE, 2015) a systematization of the information available on the teaching staff in the educational system, including the information derived from the results of the first two entrance examinations for teachers. Among the findings, it is worth noting that teaching as a career is losing its attractiveness since during the two school years prior to the publication of this report, the demand for teacher training had declined and 27.4 percent of the available positions had remained vacant.
Regarding teacher training in the 484 teacher training colleges, information was available on the results of mid-training and final examinations up to 2013, in which almost half the students had insufficient achievement. The year 2014 was the first year in which examinations were applied to start teaching, and only 40.4 percent of prospective teachers reached the level of sufficient achievement. It should be noted, however, that in the following years this figure increased, indicating that teacher-training colleges were striving to achieve better learning outcomes among their students in order to achieve better results in teacher entrance examinations.
The payroll for teachers used to be handled by the states, but in 2017, the lack of reliable information and the states’ debts to the social security system and the treasury led to the centralization of the payroll. For transparency reasons, this payroll is now in a public database, and it is possible to know how many active teachers there are, by state and level, as well as their income levels. With time, studies can be made of teacher mobility.
The available information about teachers, their training, background, and performance is therefore partial at best and not yet entirely reliable.
Information on groups requiring special attention
In addition to information on teachers, which is fundamental for improving the initial and in-service training of teachers and for guiding their placement in schools according to the specific needs of their populations, in Mexico, as in many other countries, we lack the necessary information to be able to serve special population groups that would require special attention. Some of the data is structurally unavailable. For instance, we do not know how many children of migrant farmworkers there are, and the data on how many of them are in school and their background and performance are unreliable. It is estimated that around 350,000 children and young people aged 5–17 are in this condition. It is also estimated that only 10 percent of them are in school (INEE, 2016).
We do not have any information about their learning. We also lack information on the number of indigenous students and speakers of an indigenous language enrolled in schools that are not indigenous. Even in indigenous schools, some students are not indigenous but are nevertheless counted as such. Indigenous schools only exist at the preschool and primary levels and only 53 percent of indigenous students attend these schools (INEE, 2017).
Information about people with disabilities is scarce and incomplete, and we know even less about their access to education, their permanence in school, and their learning achievement (INEE, 2017). This incomplete and unreliable information is a reality that we have carried with us since the creation of the SEP in 1921 and its absence has not been addressed.
There are also emerging situations. There is a complete lack of information about students displaced by violence, as well as about schools that shut down because it’s too dangerous for teachers to travel to their localities. Faced with an emerging reality of significant migration on the northern border, due to the deportation of undocumented Mexican people from the United States, and on the southern border, due to the migration of Central Americans and others who manage to cross this border to transit through Mexico and reach the United States, we lack timely and reliable information and cannot assume that this population is fulfilling its human right to education.
Information on learning
Since 2000 we have information about the learning of children and young people in school in Mexico. The INEE, founded in 2002, was responsible for the administration of the PISA test as well as the Latin American LLECE test. Beginning in 2005, it administered the EXCALE test to a sample of students in different grades of primary and secondary school, and as of 2015 EXCALE was substituted by the PLANEA ELSEN test (based on a representative sample of schools in each of the 32 states) to students at all levels of compulsory education.
There have also been evaluation efforts by the Secretariat of Public Education with tests applied to all students (ENLACE) or schools (PLANEA ELCE) since 2005. These tests measure students’ reading ability and their level of achievement in Mathematics in a consistent manner. The INEE attempted to also measure achievement in natural sciences and civic and ethical education. This information, however, was not able to be measured consistently, and the picture that emerges from its results is incomplete. Other areas of learning, including social-emotional skills, have not been successfully measured, and the situation of the national population in this regard is still unknown.
Information on inequalities in compulsory education
Information on the ways in which different sectors of the population are served and on the differential results of their education is fundamental to adequately serve the bottom of the pyramid. The INEE made a systematic effort to record the gaps in educational achievement among various populations, types of school, places of residence and even the condition of speaking an indigenous language. As developed in the first two sections of this chapter, we are able to observe the profoundly unequal reality of the national education system, to assess the difficulty of reducing the identified gaps, and to identify the population groups that face special difficulties in learning at school. Over the years, recommendations were generated for equity to become a public policy priority and for specific population groups to be served with equity. Unfortunately, we must say that equity in the quality of educational inputs and materials, pedagogical processes in schools and, consequently, learning outcomes, has not visibly become a priority of education policy to date. The modification of Article 3 of the Constitution makes equity a priority for the first time in history.
Information on early childhood education
We know from recent research in the learning sciences that the first three years of life are essential to the development and learning over the life span. Changes in Article 3 of the Constitution in 2019 make early childhood education (0–3) part of compulsory and free education in the country for the first time. However, the information available on these first three years of life and the efforts to serve these children is still precarious and unreliable, and it will be necessary to strengthen data collection efforts in this area if the aim is to substantially expand and strengthen the care for children in this age group.
Concerns about the future of information on education
On 15 May 2019, Article 3 of the Constitution was amended and the National Institute for the Evaluation of Education ceased to exist. In 2013 the INEE became the autonomous institution responsible for evaluating the national education system. It was replaced by the Commission for the Continuous Improvement of Education (MEJOREDU) which, since its foundation, has not carried out any evaluation at the national level.
The INEE conducted an evaluation of teaching and learning conditions based on a representative sample of all school types. In only four years it managed to evaluate all levels of compulsory education. This evaluation was very important, as it showed the degree of compliance with the state’s obligation to provide the minimum conditions for each school to fulfil the right to education. With the disappearance of the INEE, this evaluation will no longer be carried out, so we will not have reliable data on the degree to which the infrastructure, equipment, teaching materials, and management and living conditions in schools are adequate, nor will we know if the gaps discovered in these evaluations between types of school are diminishing.
Over the course of 15 years, the National Education Panorama systematically reported on key indicators regarding the structure and size of the national education system, the agents and resources of this system, the access to and achievement within the education system at a national level, educational processes, and school management, and the results of education, both in terms of learning and economic and social performance. Although the System for the Continuous Improvement of Education is expected to generate indicators on the results of educational improvement, and although educational equity is a declared priority of the new administration, there is still little progress in this regard by the new National Commission for the Improvement of Education, nor has it announced what it plans to do in terms of generating indicators. However, what we do know is that they will no longer be generated independently of the Secretariat of Public Education.
At the time of writing, nothing is known about whether MEJOREDU will continue to administer the PLANEA ELSEN test of student learning on a representative sample of schools through statistically controlled administration. The Secretariat of Public Education will probably continue to administer the PLANEA ELCE test, but without the counterweight of the equivalent controlled test, it risks presenting—as the ENLACE test did in the past—unexplained results inflation. With this, the learning data we have so far collected based on our own curriculum will be lost or become unreliable.
References
Andrade, G. (2014). Improving academic achievement through extended school-days: Evidence from Escuelas de Tiempo Completo in Mexico (Thesis). Graduate School of Education, Stanford University.
Anzures Tapia, A. (2020). The promise of language planning in indigenous early childhood education in Mexico (Doctoral thesis). University of Pennsylvania, Philadelphia.
Backhoff, R., et al. (2017). Cambios y tendencias del aprendizaje en México 2000–2015. Mexico: INEE. https://www.inee.edu.mx/publicaciones/cambios- y-tendencias-del-aprendizaje-en-mexico-2000-2015/
Banxico. (2020, February 4). Encuesta sobre las Expectativas de los Especialistas en Economía del Sector Privado: enero de 2020. https://www.banxico.org.mx/publicaciones-y-prensa/encuestas-sobre-las-expectativas-de-los-especialis/ %7B7C6AD83D-D7F8-9C8F-A1F9-4460DD0A78D3%7D.pdf
Cabrera, F. (2014). Impact evaluation of the full-time schools program in Mexican primary education. Department of Economics, University of Sussex.
Cabrera, F. (2018). Escuelas de Tiempo Completo: claroscuro en Distancia por Tiempos. Blog de Nexos. https://www.nexos.com.mx/?p=39515
Cámara, G. (2014). El entramado conceptual de la relación tutora. https://redesdetutoria.com/el-entramado-conceptual/
Cámara, G. (2020). Pedagogía que aprende de su práctica. Mexico.
Consejo Nacional de Población (CONAPO). (2019). Población a mitad de año (tabla de datos). https://datos.gob.mx/busca/dataset/proyecciones-de-la-poblacion-de-México-y-de-las-entidades-federativas-2016-2050
Consejo Nacional de Evaluación de la Política de Desarrollo Social (CONEVAL). (2019a) Metodología para la medición multidimensional de la pobreza en México (tercera edición). México City: CONEVAL. https://www.coneval.org.mx/InformesPublicaciones/InformesPublicaciones/Documents/Metodologia-medicion-multidimensional-3er-edicion.pdf
Consejo Nacional de Evaluación de la Política de Desarrollo Social (CONEVAL) (2019b). Diez años de medición de la pobreza multidimensional en México: avances y desafíos en política social (Medición de la pobreza serie 2008–2018, presentation). https://www.coneval.org.mx/Medicion/MP/Documents/Pobreza_18/Pobreza_2018_CONEVAL.pdf
CONEVAL and UNICEF (2018). Pobreza infantil y adolescente en México 2008–2016. https://www.coneval.org.mx/Medicion/Documents/UNICEF_CONEVAL_POBREZA_INFANTIL.pdf
CPEUM. (2019). Constitución Política de los Estados Unidos Mexicanos. http://www.diputados.gob.mx/LeyesBiblio/htm/1.htm
De Hoyos, R., & Naranjo, B. Uno de los sistemas educativos más exitosos en América Latina. El caso de Puebla en el contexto internacional. In Nexos, México (in press).
Diario Oficial de la Federación (DOF) (2002). DECRETO por el que se aprueba el diverso por el que se adiciona el artículo 3º, en su párrafo primero, fracciones III, V y VI, y el artículo 31 en su fracción I, de la Constitución Política de los Estados Unidos Mexicanos. México. http://www.dof.gob.mx/nota_detalle.php?codigo=718015&fecha=12/11/2002
Diario Oficial de la Federación (DOF). (2004). Ley General de Desarrollo Social. México. http://www.diputados.gob.mx/LeyesBiblio/ref/lgds/LGDS_orig_20ene04.pdf
Diario Oficial de la Federación (DOF). (2017). ACUERDO número 29/12/17 por el que se emiten las Reglas de Operación del Programa Educación Inicial y Básica Comunitaria para el ejercicio fiscal 2018. México. https://www.gob.mx/cms/uploads/attachment/file/399680/ROP_2018_E066.pdf
Diario Oficial de la Federación (DOF). (2018). Presupuesto de Egresos de la Federación para el año fiscal 2019. México. https://dof.gob.mx/nota_detalle.php?codigo=5547479&fecha=28/12/2018
Diario Oficial de la Federación (DOF). (2019a). Decreto por el que se crea la Coordinación Nacional de Becas para el Bienestar Benito Juárez. México. https://dof.gob.mx/nota_detalle.php?codigo=5561693&fecha=31/05/2019
Diario Oficial de la Federación (DOF). (2019b). Acuerdo Número 06/02/2019 por el que se emiten las Reglas de Operación del Programa Educación Inicial y Básica Comunitaria para el ejercicio fiscal 2020. México. https://www.gob.mx/cms/uploads/attachment/file/524299/2019_12_29_RO__CONAFE.pdf
Diario Oficial de la Federación (DOF). (2019c). Acuerdo por el que se emiten los Lineamientos de Operación del Programa La Escuela es Nuestra. México. https://dof.gob.mx/nota_detalle.php?codigo=5574403&fecha=03/10/2019
Diario Oficial de la Federación (DOF). (2019d). Acuerdo número 24/12/19 por el que se emiten las Reglas de Operación del Programa Desarrollo de Aprendizajes significativos de Educación Básica para el ejercicio fiscal 2020. México. http://dof.gob.mx/nota_detalle.php?codigo=5583046&fecha=29/12/2019
Diario Oficial de la Federación (DOF). (2019e). Acuerdo número 26/12/19 por el que se emiten las Reglas de Operación del Programa Atención a la Diversidad de la Educación Indígena (PADEI) para el ejercicio fiscal 2020. México. https://dof.gob.mx/nota_detalle.php?codigo=5583048&fecha=29/12/2019
Diario Oficial de la Federación (DOF). (2019f). Acuerdo número 27/12/19 por el que se emiten las Reglas de Operación del Programa Atención Educativa de la Población Escolar Migrante (PAEPEM) para el ejercicio fiscal 2020. México. https://dof.gob.mx/nota_detalle.php?codigo=5583049&fecha=29/12/2019
Diario Oficial de la Federación (DOF). (2019g). Acuerdo número 25/12/19 por el que se emiten las Reglas de Operación del Programa Fortalecimiento de los Servicios de Educación Especial (PFSEE) para el ejercicio fiscal 2020. México. https://www.dof.gob.mx/nota_detalle.php?codigo=5583047&fecha=29/12/2019
Diario Oficial de la Federación (DOF). (2019h). Presupuesto de Egresos de la Federación para el ejercicio fiscal 2020. México. https://www.dof.gob.mx/nota_detalle.php?codigo=5581629&fecha=11/12/2019
Diario Oficial de la Federación (DOF). (2019i). Ley General de Educación. México. http://www.diputados.gob.mx/LeyesBiblio/index.htm
Diario Oficial de la Federación (DOF). (2019j). Acuerdo número 21/12/19 por el que se emiten las Reglas de Operación del Programa Escuelas de Tiempo Completo para el ejercicio fiscal 2020. México. https://dof.gob.mx/nota_detalle.php?codigo=5583043&fecha=29/12/2019
Encuesta Nacional de Jornaleros (ENJO). (2009). Módulo de consulta de resultados. Estimaciones ENJO. http://www.cipet.gob.mx/jornaleros/
Galeana, C. R. (2016). Identificación de subpoblaciones de niños que no asisten a la escuela y caracterización de los factores asociados a la problemática. Conformando un marco inicial para la construcción de indicadores. Mexico: Instituto Nacional para la Evaluación de la Educación. https://www.inee.edu.mx/wp-content/uploads/2019/01/P3B105.pdf
Gobierno de Puebla. (2015). 5o Informe de Labores. Puebla: Secretaría de Educación Pública.
Instituto Nacional de las Lenguas Indígenas (INALI). (2009). Catálogo de las Lenguas Indígenas Nacionales: Variantes Lingüísticas de México con sus autodenominaciones y referencias geoestadísticas. México: Instituto Nacional de las Lenguas Indígenas. https://site.inali.gob.mx/pdf/catalogo_lenguas_indigenas.pdf
Instituto Nacional para la Evaluación de la Educación (INEE). (2007). La educación para poblaciones en contextos vulnerables (Informe anual 2007). Mexico: Instituto Nacional para la Evaluación de la Educación. https://www.inee.edu.mx/publicaciones/la-educacion-para-poblaciones-en-contextos-vulnerables-informe-anual-2007/
Instituto Nacional para la Evaluación de la Educación (INEE). (2010). El derecho a la educación en México *Informe 2009). Mexico: Instituto Nacional para la Evaluación de la Educación. https://www.inee.edu.mx/publicaciones/el-derecho-a-la-educacion-en-mexico-informe-2009-2a-edicion/
Instituto Nacional para la Evaluación de la Educación (INEE). (2014a). El derecho a una educación de calidad (Informe 2014). Mexico: Instituto Nacional para la Evaluación de la Educación. https://www.inee.edu.mx/publicaciones/el-derecho-a-una-educacion-de-calidad-informe-2014-resumen-ejecutivo/
Instituto Nacional para la Evaluación de la Educación (INEE). (2014b). Evaluación externa de los servicios educativos dirigidos a los niños de familias de jornaleros migrantes. Mexico: Instituto Nacional para la Evaluación de la Educación/UNPE. https://www.inee.edu.mx/portalweb/suplemento12/evaluacion-servicios-educativos-jornaleros-agricolas-migrantes.pdf
Instituto Nacional para la Evaluación de la Educación (INEE). (2015). Los Docentes en México (Informe 2015). Mexico: Instituto Nacional para la Evaluación de la Educación. https://www.inee.edu.mx/publicaciones/los-docentes-en-mexico-informe-2015/
Instituto Nacional para la Evaluación de la Educación (INEE). (2016). Directrices para mejorar la atención educativa de niñas, niños y adolescentes de familias de jornaleros agrícolas migrantes. Mexico: Instituto Nacional para la Evaluación de la Educación. https://www.inee.edu.mx/publicaciones/directrices-para-mejorar-la-atencion-educativa-de-ninas-ninos-y-adolescentes-de-familias-de-jornaleros-agricolas-migrantes/
Instituto Nacional para la Evaluación de la Educación (INEE). (2017). La educación obligatoria en México (Informe 2017). Mexico: Instituto Nacional para la Evaluación de la Educación. https://www.inee.edu.mx/publicaciones/la-educacion-obligatoria-en-mexico-informe-2017/
Instituto Nacional para la Evaluación de la Educación (INEE). (2018a). Panorama Educativo de México. Indicadores del Sistema Educativo Nacional 2017. Mexico: Instituto Nacional para la Evaluación de la Educación. https://www.inee.edu.mx/publicaciones/panorama-educativo-de-mexico-indicadores-del-sistema-educativo-nacional-2017-educacion-basica-y-media-superior/
Instituto Nacional para la Evaluación de la Educación (INEE). (2018b). La educación obligatoria en México (Informe 2018). Mexico: Instituto Nacional para la Evaluación de la Educación. https://www.inee.edu.mx/publicaciones/la-educacion-obligatoria-en-mexico-informe-2018/
Instituto Nacional para la Evaluación de la Educación (INEE). (2018c). Origen, recorrido y logros del Modelo Educativo Poblano Asistencia, Permanencia y Aprendizaje (Entrevista a Patricia Vázquez, Gaceta INEE). https://www.inee.edu.mx/origen-recorrido-y-logros-del-modelo-educativo-poblano-asistencia-permanencia-y-aprendizaje/
Instituto Nacional para la Evaluación de la Educación (INEE). (2019a). Panorama Educativo de México. Indicadores del Sistema Educativo Nacional 2018. Mexico: Instituto Nacional para la Evaluación de la Educación. https://www.inee.edu.mx/publicaciones/panorama-educativo-de- mexico-2018-educacion-basica-y-media-superior/
Instituto Nacional para la Evaluación de la Educación (INEE). (2019b). La educación obligatoria en México (Informe 2019). Mexico: Instituto Nacional para la Evaluación de la Educación. https://www.inee.edu.mx/publicaciones/la-educacion-obligatoria-en-mexico-informe-2019/
INEE-UNICEF. (2015). Panorama Educativo de la Población Indígena. Mexico: Instituto Nacional para la Evaluación de la Educación and Fondo de Población de las Naciones Unidas (UNICEF). https://www.inee.edu.mx/publicaciones/panorama-educativo-de-la-poblacion-indigena-y-afrodescendiente-2017/
INEE-UNICEF. (2018). Panorama Educativo de la Población Indígena y Afrodescendiente. Mexico: Instituto Nacional para la Evaluación de la Educación y Fondo de Población de las Naciones Unidas (UNICEF). https://www.inee.edu.mx/publicaciones/panorama-educativo-de-la-poblacion- indigena-y-afrodescendiente-2017/
INEE-UNICEF. (2019). Panorama Educativo Estatal de la Población Indígena: Entorno Nacional. Mexico: Instituto Nacional para la Evaluación de la Educación y Fondo de Población de las Naciones Unidas (UNICEF). https://www.inee.edu.mx/wp-content/uploads/2019/08/P3B112.pdf
Instituto Nacional de Estadística y Geografía (INEGI). (2014). Censo de Escuelas, Maestros y Alumnos de Educación Básica y Especial (CEMABE). Atlas Educativo. Instituto Nacional de Estadística y Geografía. https://www.inegi.org.mx/sistemas/mapa/atlas/
Instituto Nacional de Estadística y Geografía (INEGI). (2018). Encuesta Nacional de Ingresos y Gastos de los Hogares 2018. Instituto Nacional de Estadística y Geografía. https://www.inegi.org.mx/programas/enigh/nc/2018/
Instituto Nacional de Estadística y Geografía (INEGI). (2020). Índice Nacional de Precios al Consumidor (Año base 2018). Instituto Nacional de Estadística y Geografía. https://www.inegi.org.mx/temas/inpc/#:~:text=El%20%C3%8 Dndice%20Nacional%20de%20Precios%20al%20Consumidor%20(INPC)%2C%20es,consumen%20las%20familias%20en%20M%C3%A9xico
Instituto Nacional de Estadística y Geografía (INEGI). (2017). Módulo de Trabajo Infantil: (MTI) 2017. Principales resultados. INEGI-México. https://www.inegi.org.mx/contenidos/programas/mti/2017/doc/mti2017_resultados.pdf
Ley de Coordinación Fiscal (LCF). (2018). Diario Oficial de la Federación. México. http://www.diputados.gob.mx/LeyesBiblio/pdf/31_300118.pdf
López, D. (2016). La relación tutora y la mejora del aprendizaje. Revista RED, 3(1). https://www.inee.edu.mx/wp-content/uploads/2019/01/Red03-1PDF.pdf
López, D., & Rincón-Gallardo, S. (2003) La capacitación artesanal y la profesionalización de la labor docente en Posprimaria. Conafe, Mexico.
Luna, D., & Velázquez, P. (2019). Evaluación del impacto del Programa de Escuelas de Tiempo Completo en medidas de logro académico de centros escolares en México, Revista Latinoamericana de Estudios Educativos—Nueva Época, XLIX(2), 87–120. https://rlee.ibero.mx/index.php/rlee/article/view/19
Naranjo, B. (2019). Puebla. Innovation and improvement for students’ attendance, graduation and learning (Presentation to the Bill & Melinda Gates Foundation).
Organization for Economic Co-Operation and Development (OECD). (2019). Pisa results 2018, Vol. 1: What students know and can do. https://www.oecd-ilibrary.org/education/pisa-2018-results-volume-i_5f07c754-en
Padilla, M. (2016). The short and long run effects of full-time schools on academic performance. Texas A&M University. https://sites.google.com/site/maria spadillaromo/research
Proyecto Educativo. (2020). Política educativa y el modelo APA. https://proyectoeducativo.org/Hacemos/modelo_apa
Rincón-Gallardo, S. (2012). Redes de tutoría académica. Orientaciones para su gestión en las regiones y escuelas. Dirección General de Desarrollo de la Gestión e Innovación Educativa, Subsecretaría de Educación Básica, Secretaría de Educación Pública, Mexico.
Rincón-Gallardo, S. (2013a). Educational change as a social, political, and instructional movement: Learning and expanding a countercultural practice in Mexican public middle-schools (Doctoral thesis). Harvard University.
Rincón-Gallardo, S. (2013b). La tutoría para el aprendizaje independiente como práctica y principio rector del cambio educativo en escuelas públicas mexicanas. Didac, 61, 58–64. http://revistas.ibero.mx/didac/articulo_detalle.php?id_volumen=14&id_articulo=171
Rincón-Gallardo, S. (2014). Innovación pedagógica en gran escala: ¿lujo o imperativo moral? Didac, 65, 11–18. http://revistas.ibero.mx/didac/articulo_detalle.php?id_volumen=19&id_articulo=227
Rincón-Gallardo, S. (2016) Large scale pedagogical transformation as widespread cultural change in Mexican public schools. Journal of Educational Change, 17, 411–436. https://doi.org/10.1007/s10833-016-9286-4
Rincón-Gallardo, S., & Fullan, M. (2016). Essential features of effective networks in education. Journal of Professional Capital and Community, 1(1), 5–22. https://doi.org/10.1108/JPCC-09-2015-0007
Rives, R. (2010). Texto original de la Constitución de 1917 y de las reformas publicadas en el Diario Oficial de la Federación del 5 de febrero de 1917 al 1º. de junio de 2009 en LA REFORMA CONSTITUCIONAL EN MÉXICO. UNAM-México. https://archivos.juridicas.unam.mx/www/bjv/libros/6/2802/2.pdf and https://archivos.juridicas.unam.mx/www/bjv/libros/6/2802/8.pdf
Rodríguez, E. (2019). Progresa y su contexto, veinte años después. In Hernández Licona, G., De la Garza, T., Zamudio, J., & Yaschine, I. (Eds.). (2019). El Progresa-Oportunidades-Prospera, a 20 años de su creación. Mexico City: CONEVAL. https://www.coneval.org.mx/Evaluacion/IEPSM/Documents/Libro_POP_20.pdf
Rojas, T. J. (2017). Migración rural jornalera en México: la circularidad de la pobreza. Revista de Ciencias Sociales de la Universidad Iberoamericana, XII(23), 1–35. https://www.redalyc.org/articulo.oa?id=211053027001
Schmelkes, S., & Aguila, G. (Eds.) (2019). La educación multigrado en México. INEE-México. https://www.inee.edu.mx/publicaciones/la-educacion-multigrado- en-mexico/
Secretaria de Educación Pública (SEP). (2010). Documento Base del Programa Emergente para Mejorar el Logro Educativo. Mexico: Secretaría de Educación Pública.
Secretaria de Educación Pública (SEP). (2012). Memoria documental de la Estrategia Integral para Mejorar el Logro Educativo. Mexico: Subsecretaría de Educación Básica.
Secretaria de Educación Pública (SEP). (2017) Evaluación de Consistencia y Resultados. Escuelas de Tiempo Completo. Resultados 2017. Mexico: Instancia Evaluadora: N.I.K. BETA S.C.
SHCP. (2019). Cuenta de la Hacienda Pública Federal 2018. México. https://www.cuentapublica.hacienda.gob.mx/es/CP/2018
Silveyra, M., Yañez, M., & Bedoya, J. (2018). ¿Qué impacto tiene el Programa Escuelas de Tiempo Completo en los estudiantes de educación básica? (Evaluación del programa en México 2007–2016). Washington, DC: World Bank.
United Nations Educational, Scientific and Cultural Organization (UNESCO). (2015). Informe de resultados TERCE. Ofina de Santiago. https://unesdoc.unesco.org/ark:/48223/pf0000243532
United Nations Population Fund (UNFPA). (2019). SWOP Data 2019. https://www.unfpa.org/sites/default/files/SWOP-Data-2019.xlsx
Unidad de Planeación y Evaluación de Políticas (UPEPE). (2012). Documento de trabajo: Análisis del impacto del Programa para la Mejora del Logro Educativo (PEMLE) en las escuelas secundarias. Mexico: Unidad de Planeación y Evaluación de Políticas, Secretaría de Educación Pública.
Yaschine, I. (2019). Progresa-Oportunidades-Prospera, veinte años de historia. In Hernández Licona, G., De la Garza, T., Zamudio, J., & Yaschine, I. (Eds.). (2019). El Progresa-Oportunidades-Prospera, a 20 años de su creación. Mexico City: CONEVAL. https://www.coneval.org.mx/Evaluacion/IEPSM/Documents/Libro_POP_20.pdf
1 The authors would like to thank Luis Degante and Raúl René Rojas for their contributions to this section.
2 The Mexican Constitution (CPEUM) mandated compulsory primary education in 1934, secondary education in 1993, and preschool education in 2002 (Rives Sánchez, 2010). In 2012, upper-secondary education was made compulsory and its gradual universalization will theoretically end in 2021. Recently, in May 2019, initial education and higher education (the latter with conditions) were also made compulsory. Initial education was also added to the category of basic education (CPEUM, 2019, May 15, Art. 3).
3 These age ranges relate to the ages for each school level, assuming uninterrupted school progress, one grade per school cycle, and starting at three years of age in the first grade of preschool education (DOF, 12 November 2002).
4 The only specialized survey on migrant day-laborers in Mexico for which public information is available is the ENJO 2009. The post-2009 estimates of the number of agricultural day-laborers are indirect. They use the ENJO results in combination with the results of household surveys (not specialized in migrant day-laborers). ENJO data are reported here rather than indirect estimates that may underestimate the number of children in migrant worker families.
5 Calculations derived from INEE (2018b).
6 The authors wish to thank Raúl Guadalupe Antonio for his contribution to this section.
7 In September 2020, Congress received the federal proposal budget for 2021 with important planned reductions for some equity programs described here. The approval of the final budget will occur at the end of the year.
8 FPs that benefit the general population, without targeting any population group or type of service, also include programs with administrative activities, educational policy design, and production and distribution of educational materials. FPs with a specific target population target subpopulations of children in vulnerable conditions such as children in poverty, in highly marginalized localities, indigenous, with some disability, in a situation of violence, or with low results in learning tests.
9 This program is described in greater detail in Section 5 of this document.
10 In 2019, the average rural and urban LPIs monthly per capita were equal to $104.55 and $161.36, respectively. In Mexican pesos these figures were 2,011.27 and 3,104.30 pesos, respectively.
11 Nominal budget is translated into dollars at the exchange rate of 22.012 pesos to 1 US dollar. Rate of exchange is unstable now in Mexico. This rate of exchange corresponds to July 29, 2020 (Banxico, 2020).
12 This program is described in greater detail in the next section.
13 The main source of information for this section is the book published by the CONEVAL in 2019 to commemorate the 20 years of Progresa-Oportunidades-Prospera, especially the chapter written by Iliana Yaschine (2019) on the history of the program.
14 The ENLACE test was used from 2006 to 2013 and was replaced by PLANEA starting in 2015.
15 Mexican public-school days are four to four-and-a-half hours long in primary education and six hours long in secondary education.
16 A description of the seven Lines of Work and their educational materials is available at: https://educacionbasica.sep.gob.mx/site/proetc#PP_PETC_Basica.
17 Tutoring Networks, in Spanish, is Redes de Tutoría.
18 TN has been taken to rural and urban schools in Chile through the Education 2020 Foundation, as well as to schools in Thailand, Singapore, Indonesia, and Argentina.
19 The testimonies can be read on the webpage redestutoria.com.
20 See El aprendizaje bajo la lupa published by UNICEF in 2015 and authored by Inés Aguerrondo y Denisse Vaillant.
21 Proyecto Educativo, S.C. was responsible for the design. According to its webpage (https://www.proyectoeducativo.org/), the APA model adapts the logic of a model used in the province of Ontario, Canada, which had similar objectives.
22 In 2018, Puebla had a population of 6.3 million people. That same year it ranked fifth (out of 32) in poverty with 58.9 percent of its population in poverty and 8.6 percent in extreme poverty, according to CONEVAL figures.
23 To learn more about the actions implemented at each level, see the interview published in the Gaceta del INEE (2018) and the 5th Report of the Secretariat of Education in the State of Puebla.
24 The graph is taken from the presentation “Puebla. Innovation and improvement for students’ attendance, graduation and learning”, made by Bernardo Naranjo (member of Proyecto Educativo, S.C.) and presented to the Bill & Melinda Gates Foundation in December 2019.
25 The ENLACE test was used from 2006 to 2013 and was replaced by PLANEA starting in 2015. The use of relative rank allows us to eliminate biases derived from comparability between both tests.
26 Context questionnaires that accompany the tests allow for the testing of hypotheses on different learning behaviors of different populations and their possible causes. In the Appendix, we provide an additional analysis what information is lacking.