1. Public Investment in the Pandemic—Europe at a Glance
© Chapter Authors, CC BY 4.0 https://doi.org/10.11647/OBP.0280.01
Introduction
Wide investment gaps have opened in Europe after a long period of subdued government investment and increasingly ambitious targets for the digital and green economic transition. By 2016, EU government investment had declined to a twenty-five-year low of 2.8% of GDP. Since then, it has recovered only marginally. Without large public and private investments, the economy cannot reap the benefits of digitalisation nor adapt to climate change. According to the EU Commission, about €350 bn of additional investment is needed annually during 2021–30 relative to the previous decade if 2030 climate and energy targets are to be met.1 Survey data also confirm sizable investment gaps. In the European Investment Bank’s (EIB) Municipality Survey, two thirds of respondents see gaps in climate change mitigation and adaptation, 47% in digitalisation, and 46% in transport.2
As the pandemic adds to existing challenges, it also offers the opportunity to rebuild better. To accompany the recovery, member states’ Stability and Convergence Programmes and the EU’s Recovery and Resilience Facility emphasise public investment. The slogan is to “rebuild better” with investments that support digitalisation and more sustainable production. If well-managed, such an emphasis on public investment would be a welcome novelty. It benefits from the monetary policy environment, in which central banks lowered refinancing costs by setting ultra-low interest rates and by purchasing large amounts of government bonds and other financial assets. However, history tells us that such a window of opportunity, created by the need and ability to spend, might close fast. Hence the urgency to make best use of the available resources to strengthen economic growth sustainably.
To be successful, investment programmes need to be properly operationalised, monitored, and evaluated. In the current environment, access to finance to fund public investments is not an issue for most member states. The challenge lies in operationalising investment plans and in executing, monitoring, and evaluating them. Public investment should be catalytic, crowding in private investment. As such, any investment program needs to be well-coordinated and should be complemented by structural reforms that lower barriers to private sector investment.
1.1 Government Investment Since the Global Financial Crisis
Despite a recent uptick, government investment in the European Union has been subdued since the Global Financial Crisis (GFC). EU government investment had fallen to 2.8% of GDP in 2016, the lowest level in twenty-five years. This trend was reversed only very recently: relative to GDP, government investment recovered to 3.3% of GDP in 2020 (Figure 1).3,4
Southern Europe is in the spotlight. Following the GFC, investment fell in all countries that had experienced some sort of investment boom in the previous decade but especially in Southern Europe following the European sovereign debt crisis. As markets questioned countries’ ability to roll over debt, their borrowing costs rose. Government investment rates in Southern Europe fell 1.2 pp of GDP in the years following the sovereign debt crisis relative to the average before GFC, a 34% decline. While the recent uptick in Southern Europe by 0.4 pp of GDP is magnified by the sharp decline in GDP due to the pandemic, real government investment in Southern Europe in 2020 rose 6.7% relative to 2019.
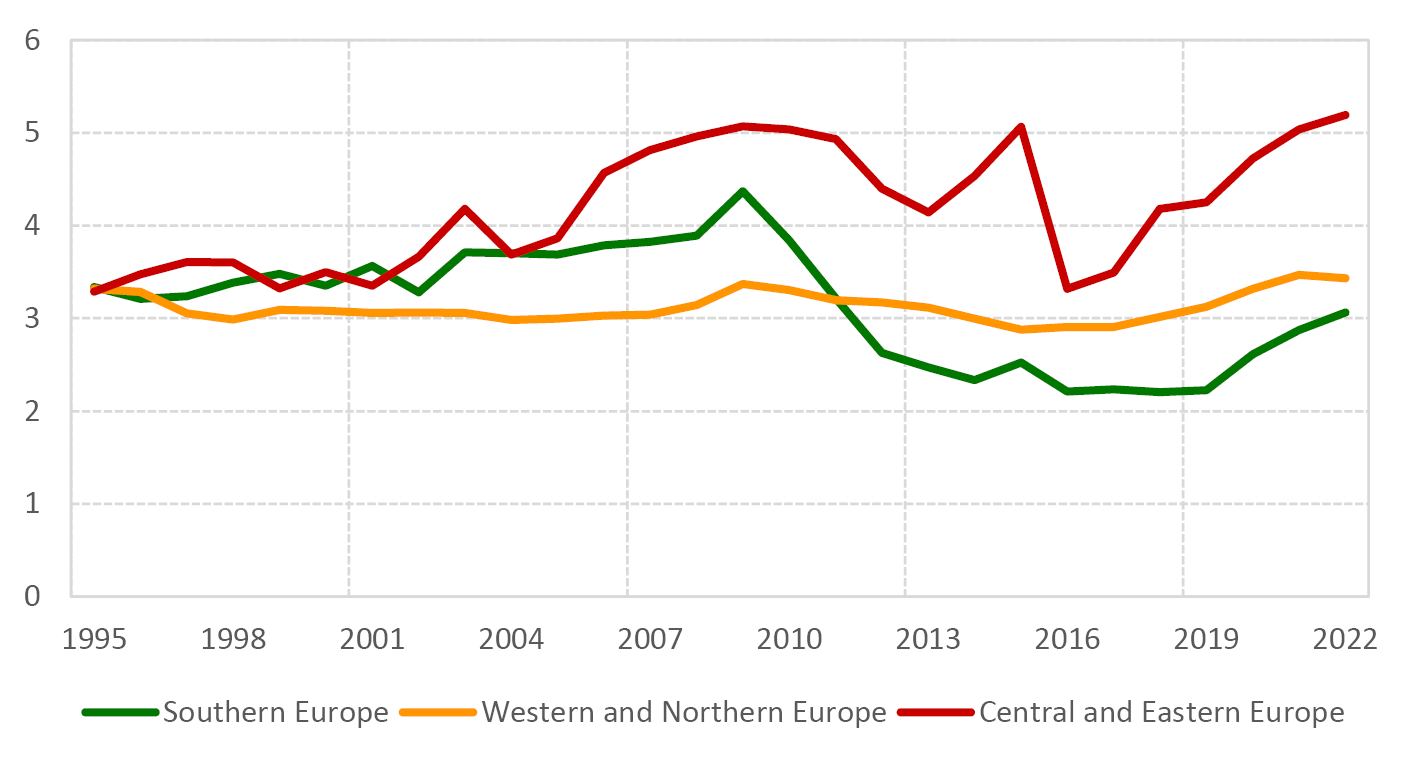
Fig. 1 Gross Fixed Capital Formation (GFCF) of the General Government, % GDP.5
Source of data: EC Macroeconomic Database (AMECO), and authors’ calculations.
During the fiscal consolidations following the sovereign debt crisis, government investment accounted for the lion’s share of the cut in government expenditures in the EU, even though it only comprised 5% of total expenditures. In 2016, six years after the start of the fiscal consolidation, the share of capital expenditures in total expenditures was about 5 pp lower than the average share over 2000–07 in Southern Europe (Figure 2). By 2020, it reached -2 pp below the pre-GFC average. This decline occurred despite falling interest expenditures. The mirror image of these declines is the increase in total primary expenditures, which remained more than 5 pp above their pre-GFC average. While not as large, this expenditure shift was present in most of the other EU member states.
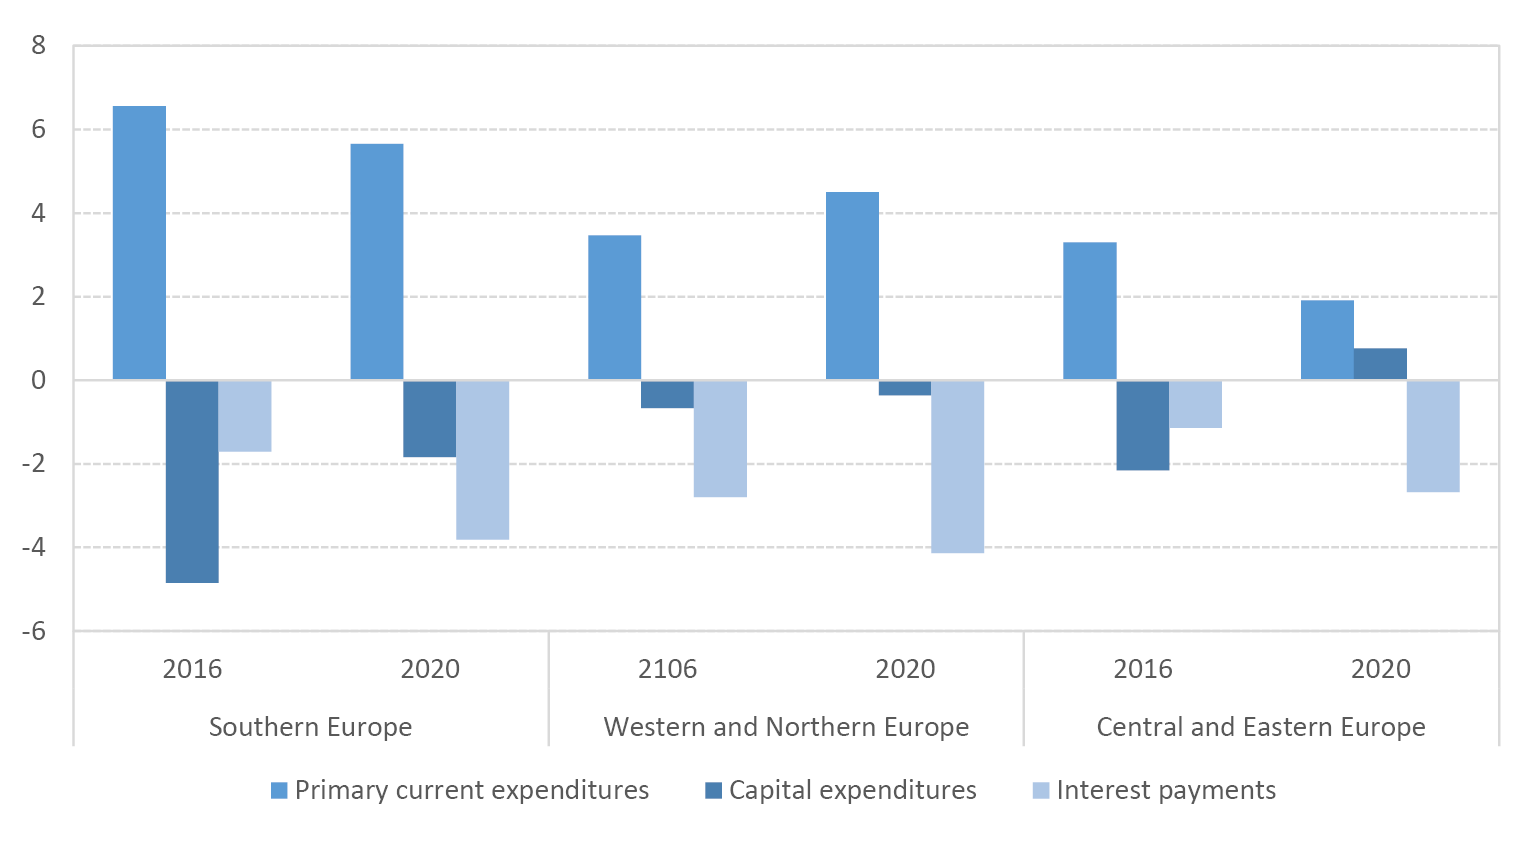
Fig. 2 Change in the Composition of Total Expenditures of the General Government Relative to the Average, 2000–07.
Source of data: EC Macroeconomic Database (AMECO), and authors’ calculations.
Government gross fixed capital formation fell more where fiscal consolidations were larger. In western and northern countries, despite fiscal consolidation efforts, gross fixed capital formation of the government remained broadly stable, as a share of GDP. In Central and Eastern Europe, the fiscal consolidation started later, lasted for a shorter time, and was much more abrupt: government investment fell by 14% in just two years (2012–13). In the two years that followed, however, it rebounded, increasing by 12%. These large swings can be mostly explained by the importance of European Structural and Investment Funds for government investment in this group of countries. Southern Europe, in turn, experienced the largest decline in real government GFCF in the EU: in the six years between 2010 and 2016, it fell by 46%.
Investment of subnational governments fell disproportionately more after the GFC. Averaging over member states with a centralised and a federal institutional structure, local government investment accounts for about half the investment of the general government in the EU. State government investment, which comprises the remaining subnational investment, accounts for about 11%. The remaining 42% is for central governments. In the years following the GFC, investment of subnational governments fell disproportionately more. In the EU, the decline of subnational government investment accounted for about 77% of the decline of the investment of the general government (Figure 3).
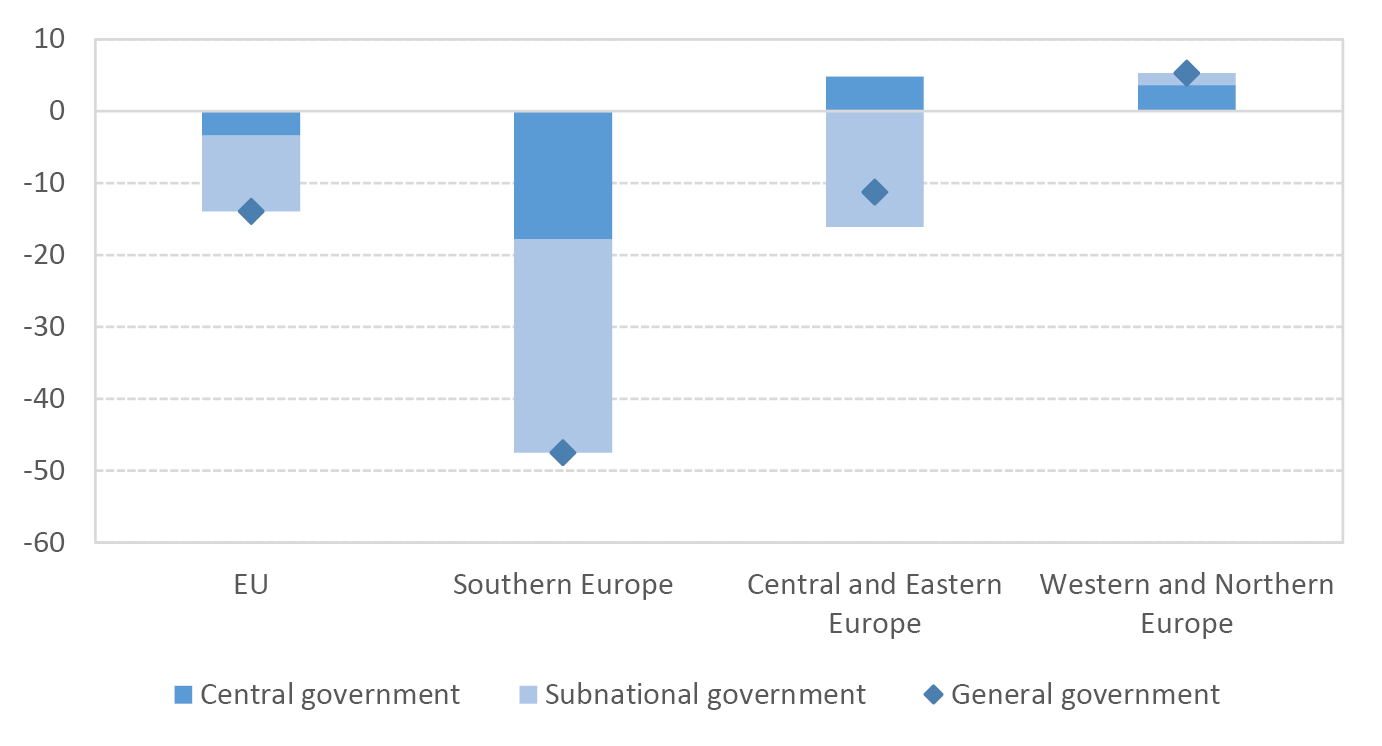
Fig. 3 Total Change in GFCF of the General Government and Contributions by Levels of Government, 2009–16, %.
Source of data: Eurostat Government finance statistics and authors’ calculations.
The quality of infrastructure suffered. Infrastructure investment fell in lockstep with government investment across the EU (Figure 4a), driven by the decline in subnational investment spending. The deterioration and lower availability of infrastructure services led, in turn, to dissatisfaction with infrastructure provision (Figure 4b). Declining government investment reinforced the negative effect on the economy exerted by private sector deleveraging after the GFC.
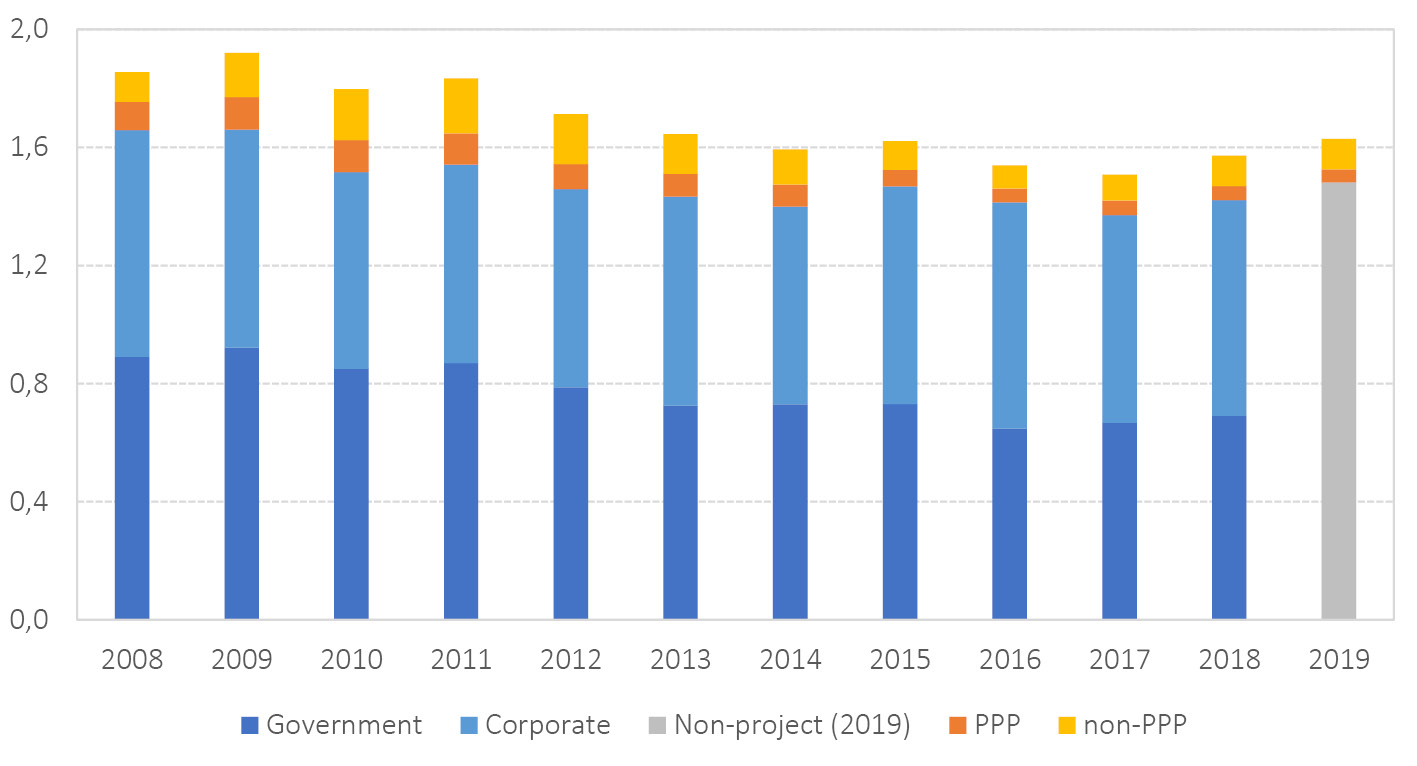
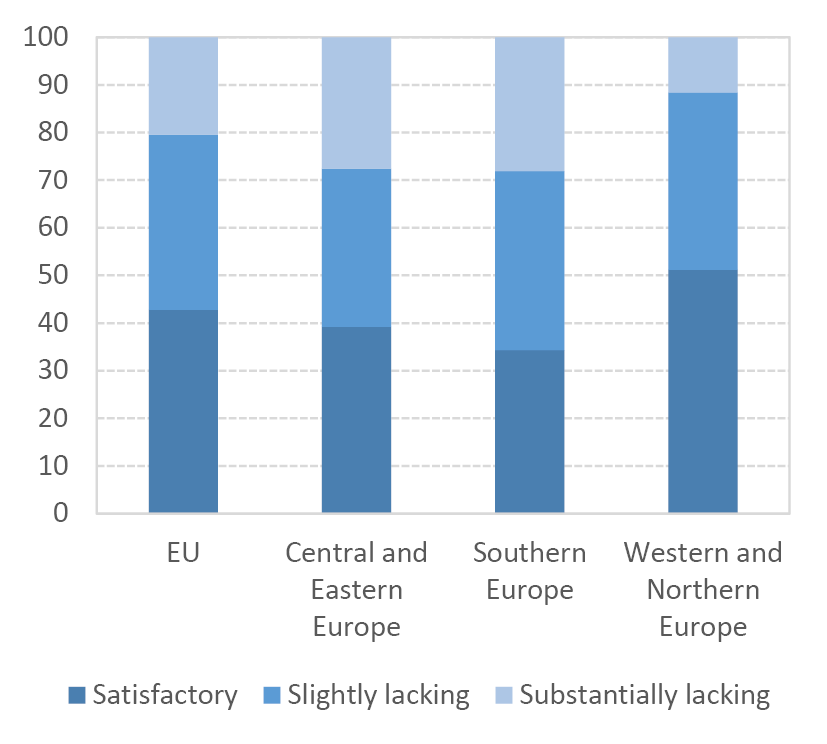
Fig. 4 Infrastructure Investment in the EU, % GDP (Panel a) and Adequacy of Infrastructure Stock of Transport Infrastructure (Panel b).
Source of data: Eurostat, European PPP Expertise Centre (EPEC), IJ Global, and EIB staff calculations (Panel a); EIB Municipality Survey 2020 (Panel b).
Such declines in government investment during fiscal consolidations are common. Governments are pressed to reduce deficits typically in periods of economic hardship or immediately after such periods, when unemployment levels are high and many people still feel the negative consequences. In such periods, reducing investment expenditures instead of entitlements and social expenditures remains the politically easier choice despite the negative future consequences of reduced investment.
These declines are typically large and protracted. We estimate the effects of fiscal consolidations on the government investment rate using local projection methods (Jordà, 2005). To identify fiscal consolidations, we use a narrative approach based on over 3500 fiscal measures for sixteen OECD countries following Alesina et al. (2017). Our analysis shows that fiscal consolidations result in large and persistent declines in the ratio of government investment to GDP (Figure 5). Results illustrate the substantial and persistent effects of fiscal consolidation on government investment. Seven years after the start of a fiscal consolidation, government investment remains 0.5 pp of GDP lower, which represents a 14% decline from an average government investment of 3.6% of GDP.
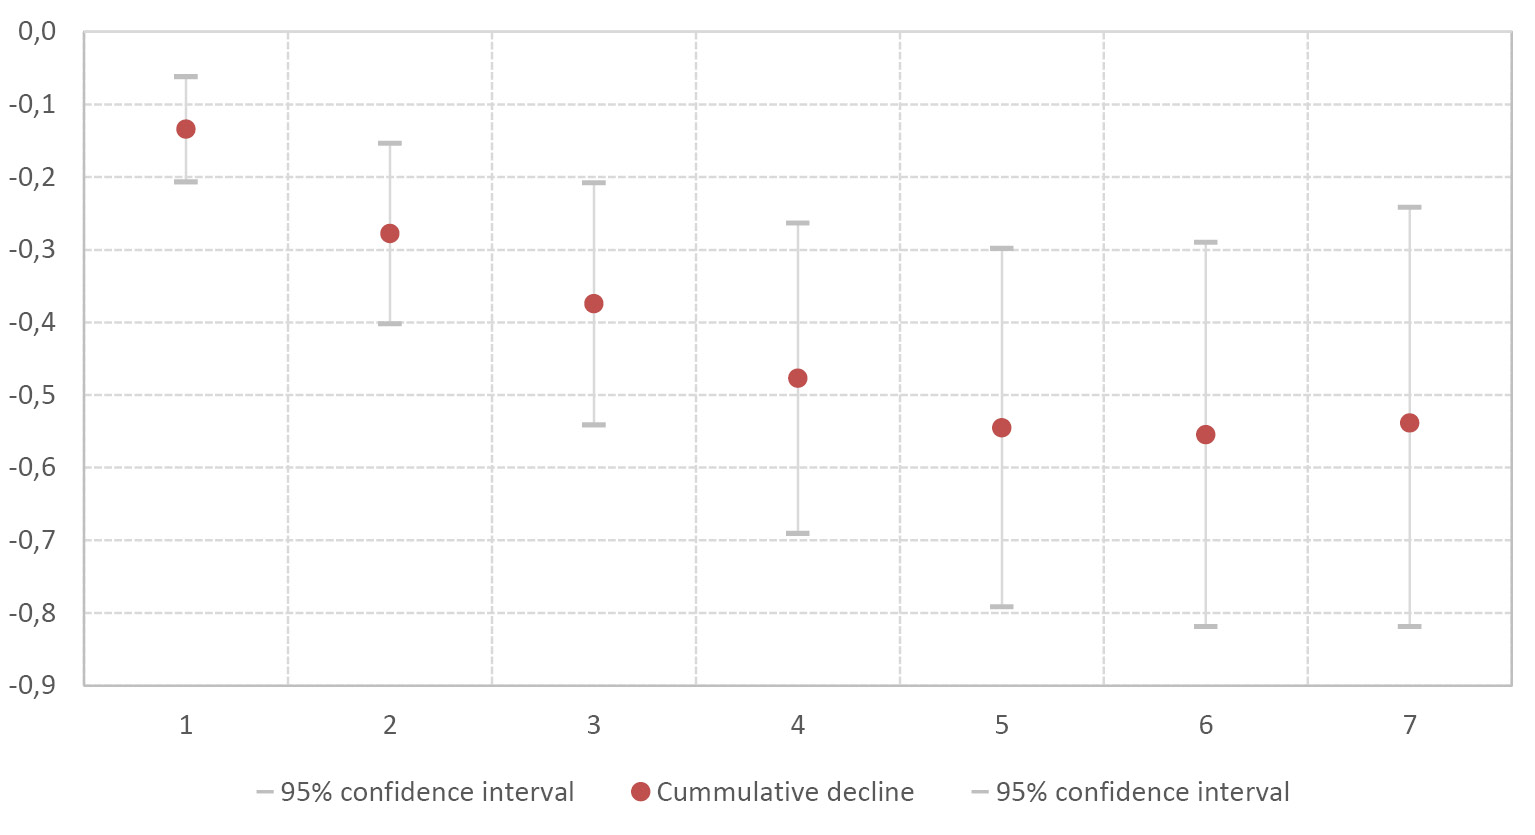
Fig. 5 Response of Government Investment Following a Fiscal Consolidation, Cumulative pp of GDP.
Source of data: Authors’ calculations.
Years of underinvestment and increasingly ambitious climate targets created wide investment gaps. According to the EU Commission, about €350 bn of additional investment is needed annually during 2021–30 relative to the previous decade if 2030 climate and energy targets are to be met. At the same time, most EU municipalities report investment gaps in the EIB’s Municipality Survey. Two thirds see gaps in climate change mitigation and adaptation, 47% in digitalisation, and 46% in transport.
1.2 Rebuilding Better: The Response to the Pandemic and the Outlook for Public Investment
EU fiscal policy responded to the pandemic in two phases: dealing with the emergency and laying the foundation for a sustainable recovery. During the emergency phase, starting in March 2020, member states increased fiscal spending and postponed revenues. The resulting deficits were financed by debt issuance. The EU backed their actions by suspending state aid rules and borrowing limits.6 In the following weeks, various EU institutions complemented member states’ policies by offering their own support schemes. The ESM extended a safety net for sovereign borrowers via the Pandemic Support Scheme. The European Commission created a support scheme for workers in its SURE programme, while the EIB provided liquidity support for SMEs by creating a €25 bn Pan-European Guarantee Fund (EGF).
Having dealt with the emergency, the EU Commission presented its proposal for a recovery plan, Next Generation EU (NGEU), at the end of May 2020. This plan became the core of the EU’s fiscal strategy during the recovery phase.7 The centrepiece of NGEU is the Recovery and Resilience Facility (RRF), under which member states have access to grants and loans worth about €672.5 bn. The RRF is funded through the issuance of debt by the European Commission. Member states with lower per capita GDP and higher pandemic-related economic damages will receive a larger share of the funds.
The aim of the recovery plan is to “rebuild better”. The idea was to stimulate aggregate demand with measures targeted at increasing the economy’s supply capacity―to “rebuild better”―by fostering digital and other infrastructure and by tackling climate change. While the Commission set out the themes for this recovery package, including minimum investment thresholds for climate (37%) and digital (20%) investments, it was up to member states to set out how they intended to spend the funds in their Recovery and Resilience Plans. The European Commission’s role also included approving the plans and monitoring their implementation. Finally, the European Commission tried to ensure that the various EU member states’ fiscal policies were coordinated. It required that RRF-funded spending should not replace but add to existing public investment, and that it should be accompanied by the reforms proposed as part of the European Semester.
As a result of national and EU-wide fiscal policy measures, public investment is forecast to rise, in particular during 2021–23. Relative to GDP, the intended level of spending―around 3.5% of GDP in 2021–2023―is about €80 bn larger than the 2.9% average for 2016–19 (Figure 6). The countercyclical nature of the RRF is visible in the concentration of GFCF spending during the first three years of the RRF’s life span. As allocations under the RRF are tilted towards member states that have a lower per capita GDP, and suffered more from the crisis, the increase in spending is more pronounced in Southern and Eastern Europe. In Southern European countries, GFCF is expected to rise from an average 2.2% in 2016–19 to 3.0–3.1% of GDP in 2021–23. In Central and Eastern European countries, the increase in GFCF could be as large as 1.9 pp, from 3.8% to 5.7% of GDP.
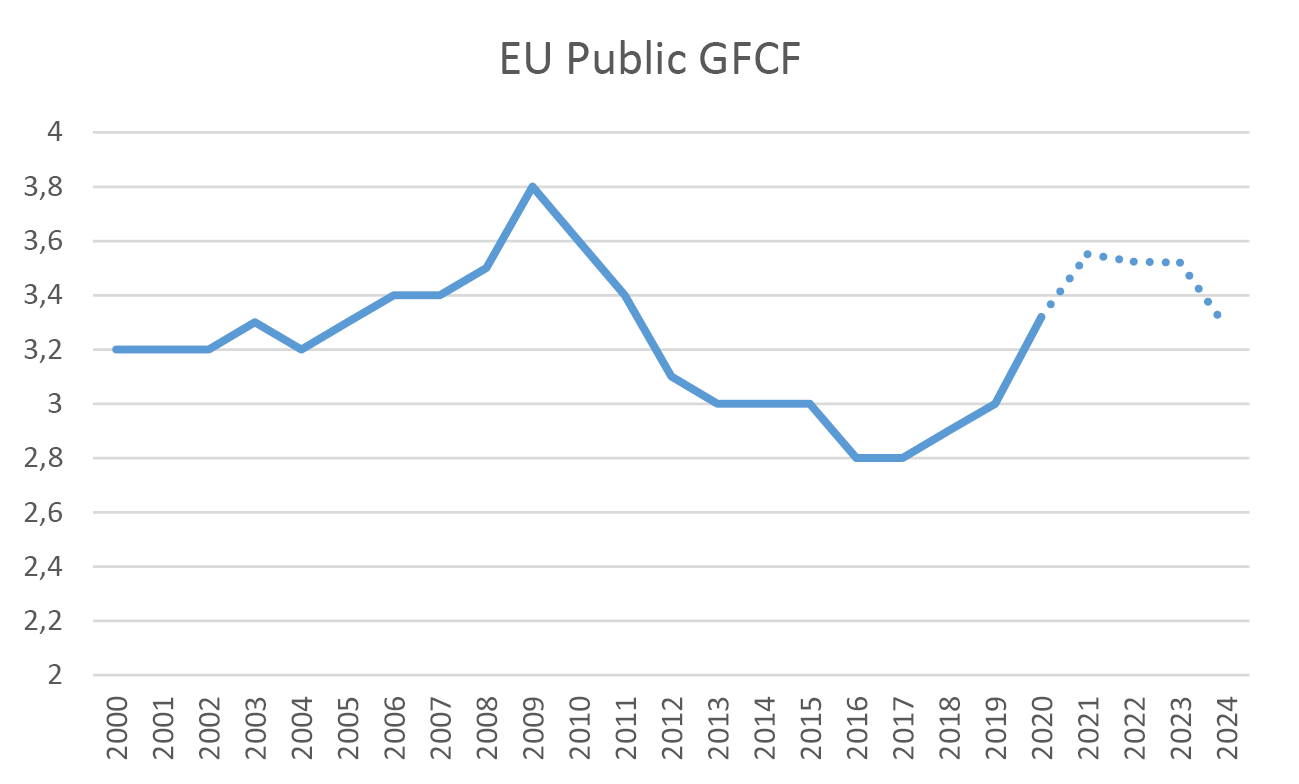
Source of data: EU Member States’ Stability and Convergence Plans (April 2021) and authors’ calculations.
As part of public investment, capital transfers are set to rise. Capital transfers include recapitalisations and incentive schemes for investments in the private sector. National governments tend to require co-financing for investment incentives by the private sector, enabling RRF funds to generate investment in excess of the support provided. A preliminary analysis of member states’ Recovery and Resilience Plans (RRPs) suggests that RRF-financed capital transfers are set to be largest relative to GDP in Southern Europe (Table 1). Most of these capital transfers are investment incentives. As a result, capital transfers are projected to increase, close to the levels hit in the aftermath of the Global Financial Crisis and the subsequent European sovereign debt crisis (Figure 7). In those years, the increase was mainly linked to the public acquisition of domestic ailing banks (the lion’s share of the increase was in fact due to Ireland and Germany in 2010, and to Greece, Spain, Cyprus, and Portugal in 2012–14). Just as public GFCF, capital transfers are set to rise over the next couple of years to 1.6% of GDP in 2022. On average over 2021–23, capital transfers are expected to be 1.4% of GDP, around €60 bn per year more than the 2016–19 average.
Table 1 RRF-Funded Public Investments and Expenditures (% of 2020 GDP)
|
Region |
GFCF |
Capital transfers: Investment incentives |
Capital transfers: Recapitalisations |
Current expenditure |
|
EU |
1.9 |
1.2 |
0.1 |
1.0 |
|
North and West |
0.4 |
0.4 |
0.0 |
0.2 |
|
East |
5.4 |
2.0 |
0.9 |
|
|
South |
3.9 |
2.6 |
0.8 |
2.9 |
Source of data: EIB preliminary evaluation of EU member states’ RRPs as of end of June 2021.
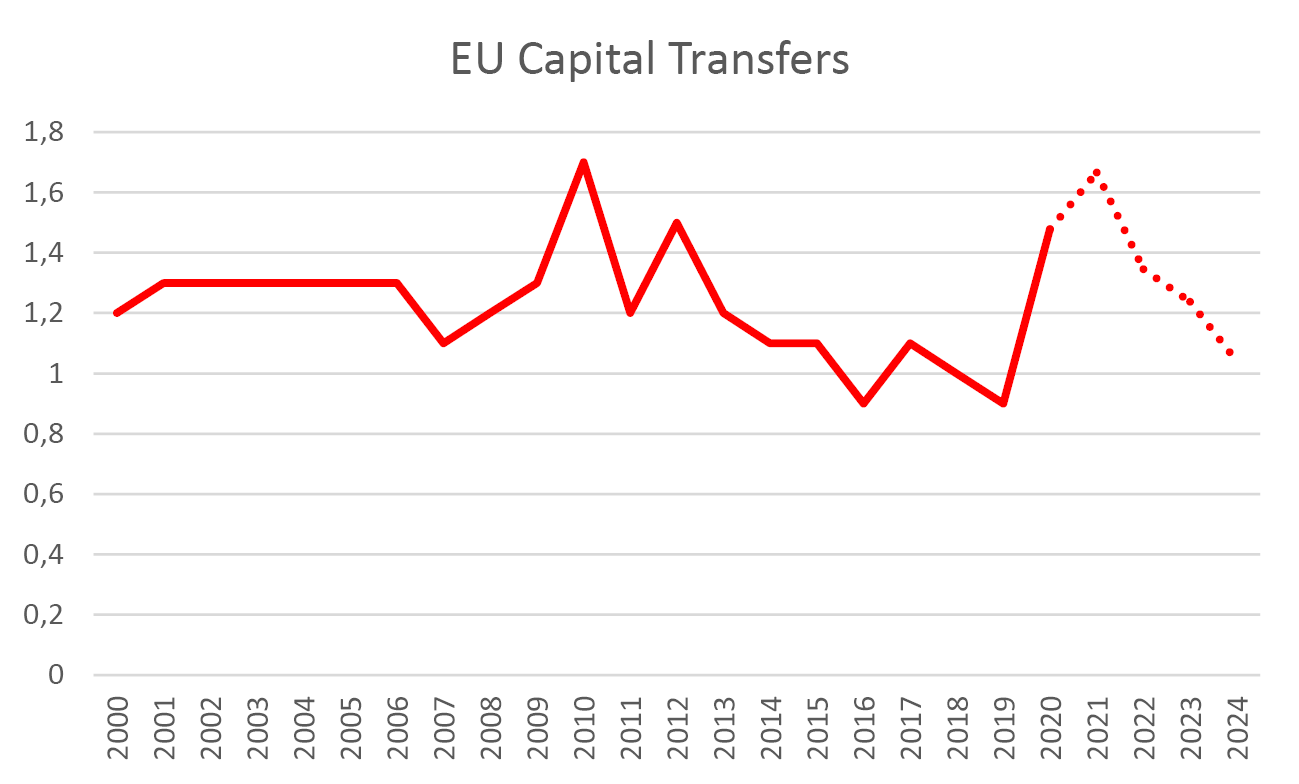
Fig. 7 EU Capital Transfers, % GDP.
Source of data: EU member states’ Stability and Convergence Plans (April 2021) and authors’ calculations.
A large share of RRF spending will be directed towards climate mitigation and digitalisation. RRPs generally describe investment projects in much detail and place them into the context of European and national policy. Three aspects stand out. The first is the priority of spending on climate mitigation and digitalisation. Member states plan to exceed the Commission’s targets: 41% of spending will help mitigate climate change, while 28% is related to digitalisation (Figure 8). In particular, Northern and Western European countries allocate a large share of their RRF funds to climate mitigation (Luxemburg, Denmark, Belgium, Finland, and France are at or above 50% of the resources). Southern countries, hit more severely by the pandemic, allocate somewhat more to other areas.
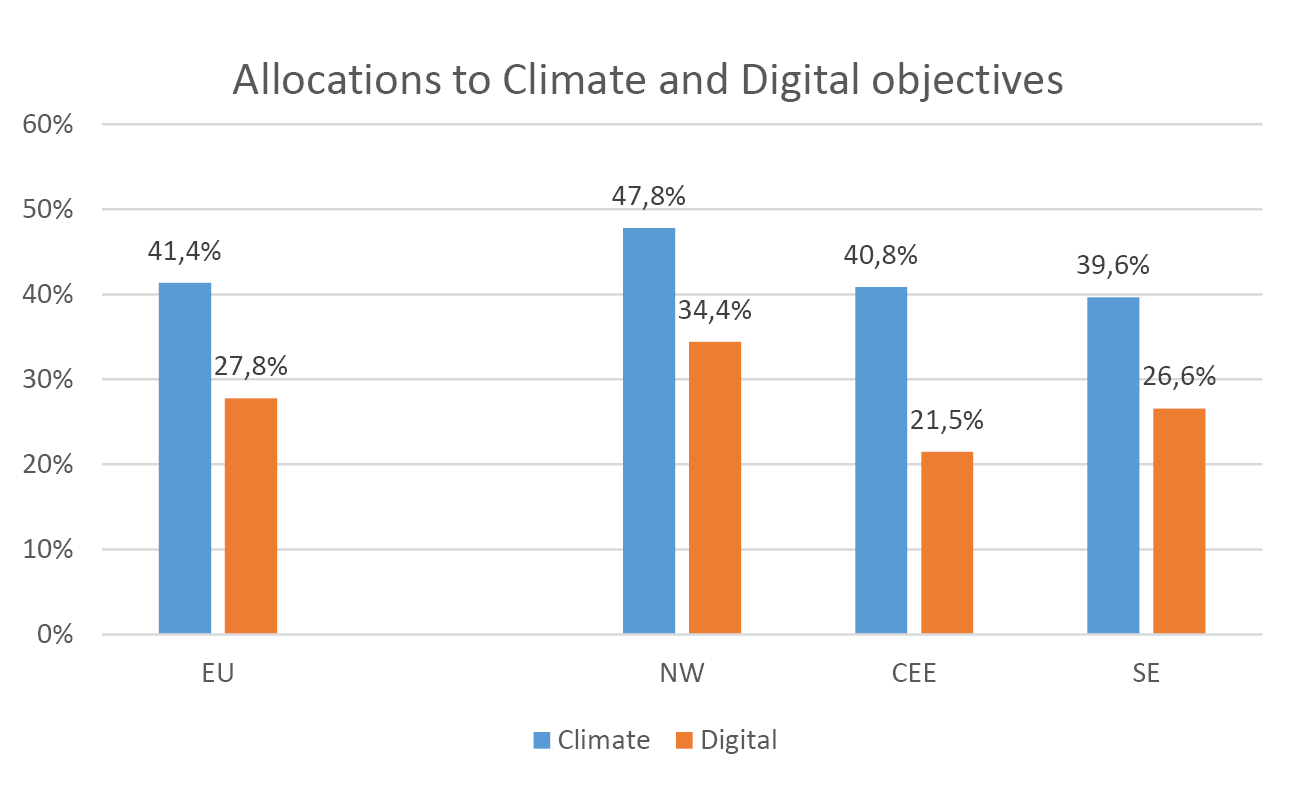
Fig. 8 Actual Climate and Digital-Related Share of Funds.
Source of data: EU member states’ Recovery and Resilience Plans and authors’ calculations.
Support for R&D will also be larger than in the past. Public R&D spending is set to increase, particularly in Southern and Eastern European countries. As a share of GDP, total resources from RRP allocated to public R&D are particularly large in Southern Europe (0.4% of GDP in total over six years). On an annual basis, this is about a sixth of Southern Europe’s public R&D spending in 2019 (Table 2).
Table 2 Public and Private R&D Spending (% of 2020 GDP)
|
Region |
RRF spending on public, higher education, and private non-profit R&D |
Public, higher education, and private non-profit R&D (2019) |
RRF intended spending on private business R&D |
Private business R&D (2019) |
|
EU |
0.1 |
0.7 |
0.1 |
1.5 |
|
North and West |
0.0 |
0.9 |
0.2 |
1.9 |
|
East |
0.2 |
0.5 |
0.1 |
0.8 |
|
South |
0.4 |
0.5 |
0.1 |
0.8 |
Source of data: Eurostat; EIB preliminary evaluation of EU member states’ RRPs as of end of June 2021.
Capital transfers to promote private-sector R&D are relatively less important in Southern and Eastern European countries, and more important in the North and West. Capital transfers can generate a larger amount of investment by requiring the private sector to co-finance some of the investments. In the Recovery Plans, these capital transfers typically target green technologies (research related to green hydrogen being a clear example with explicit allocations in Italy, France, and Finland), strategic sectors (aeronautic sector), or the innovative capacity of SMEs. The types of subsidies vary across countries and programmes: they include tax allowances (for example, in Denmark for R&D), procurement by public-private partnerships (Ireland, France), and setting up investment funds that aim to co-finance investments in certain areas, such as tourism (Cyprus, Greece, Belgium, and Italy).
1.3 The Implementation of Public Investment Plans Determines Their Success
To be successful, large public investment programmes need to be properly operationalised, monitored, and evaluated. A commitment to spending is not sufficient. Plans need to be well-designed. They need to identify barriers to investment and market failures to justify the public intervention. They then need to be operationalised by defining concrete projects that should be financed and that would not have been realised without public support.
Despite differences in design, the European Fund for Strategic Investments (EFSI) provides some lessons. Just like the RRF, EFSI has been set up in the wake of a crisis to tackle its consequences. EFSI’s objective was to stimulate investment in the aftermath of the 2008–09 financial crisis. Similar to the RRF, EFSI targets a range of areas: infrastructure, environment, human capital, and improving SMEs’ access to finance. Both programmes require that the supported projects address market failures and that they could not have been carried out under existing EU programmes (“additionality”). In contrast to the RRF, however, EFSI did not offer grants but shares project risks with its beneficiaries. EFSI funds are used to provide loans, loan guarantees, credit enhancements, and equity-type products, including investments into private investment funds. Its institutional deployment is also different: while the RRF enables the European Commission to provide grants and loans directly to member states, EFSI uses a loss-sharing agreement between the European Commission and the EIB to allow the EIB Group to support riskier projects and borrowers. EFSI closed for new projects in 2020.
EFSI offers lessons about the importance of investment advisory, private co-financing, additionality of investments, and transparency. First, barriers to investment do not only stem from access to finance. The capacity to identify concrete projects and implement them is equally important. For EFSI, the EIB not only provided loans but also advisory services. The European Investment Advisory Hub offered technical assistance, support and training for preparation, management, monitoring, evaluation, audit, and control of projects, and a platform for cooperation with partner institutions. Similar services should be made available when implementing RRF funds.
Second, public sector investment should be catalytic. Member states could amplify the impact of RRF funds by involving the private sector and national and supranational development banks in the funding of the projects. As of the end of 2020, EFSI supported 732 investments in infrastructure and innovation, totalling €69.6 bn, and 816 operations to improve access to finance for SMEs,8 totalling €33.0 bn. The combined size of these operations was far smaller than those envisaged by the RRF. However, because EFSI support also attracted funds from other investors, including from the private sector, these operations mobilised considerably more investment. The EIB estimates that EFSI mobilised over €545.3 bn of investment. To facilitate the co-financing of private investors, the European Investment Project Portal was set up, allowing project promoters to advertise their projects and investors to search for opportunities. Even though much of the support from the RRF comes in the form of grants without any co-financing requirements, member states can choose to require their RRF-supported projects to be co-financed. Indeed, many plan to do so, in particular when providing investment subsidies to the private sector.
Third, given the large size and short deadlines of RRF funds, particular care needs to be taken to ensure that RRF funds generate additional investments rather than replace existing financing sources. Experience from EFSI suggests that the larger the supply of funds relative to the amount of projects waiting to be financed, the greater the risk that public funding only replaces other funding instead of generating additional investment. For the part of EFSI targeted at improving access to financing for SMEs, ECA (2019) found no evidence of replacement of other funds: according to interviews with experts, SMEs’ demand for funds substantially exceeded supply. The EIB’s own evaluation finds that EFSI operations provided financial and non-financial benefits which the market could not have provided, or not to the same extent, nor within the same time frame. ECA (2019) argued that about two thirds of EFSI-financed projects might not have been realised without EFSI support.
Whether all RRF support leads to additional investment remains to be seen. RRF-funded projects need to be additional to projects that take money from other EU sources. There is no corresponding requirement for projects without EU funding. In many countries, RRF funds may not be large relative to investment gaps but they are large relative to what the private and public sectors normally invest. In addition, implementation deadlines are relatively short, providing member states with an incentive to tag projects for RRF funding that were ready to be implemented anyway. Member states themselves, however, expect RRF funds to lead to additional investments. Based on forecasts of investments that some member states provided in their Stability and Convergence Programmes, capital spending funded by the RRF is about as large as the difference in average investment from 2021–24 to 2016–19 (Figure 9).9
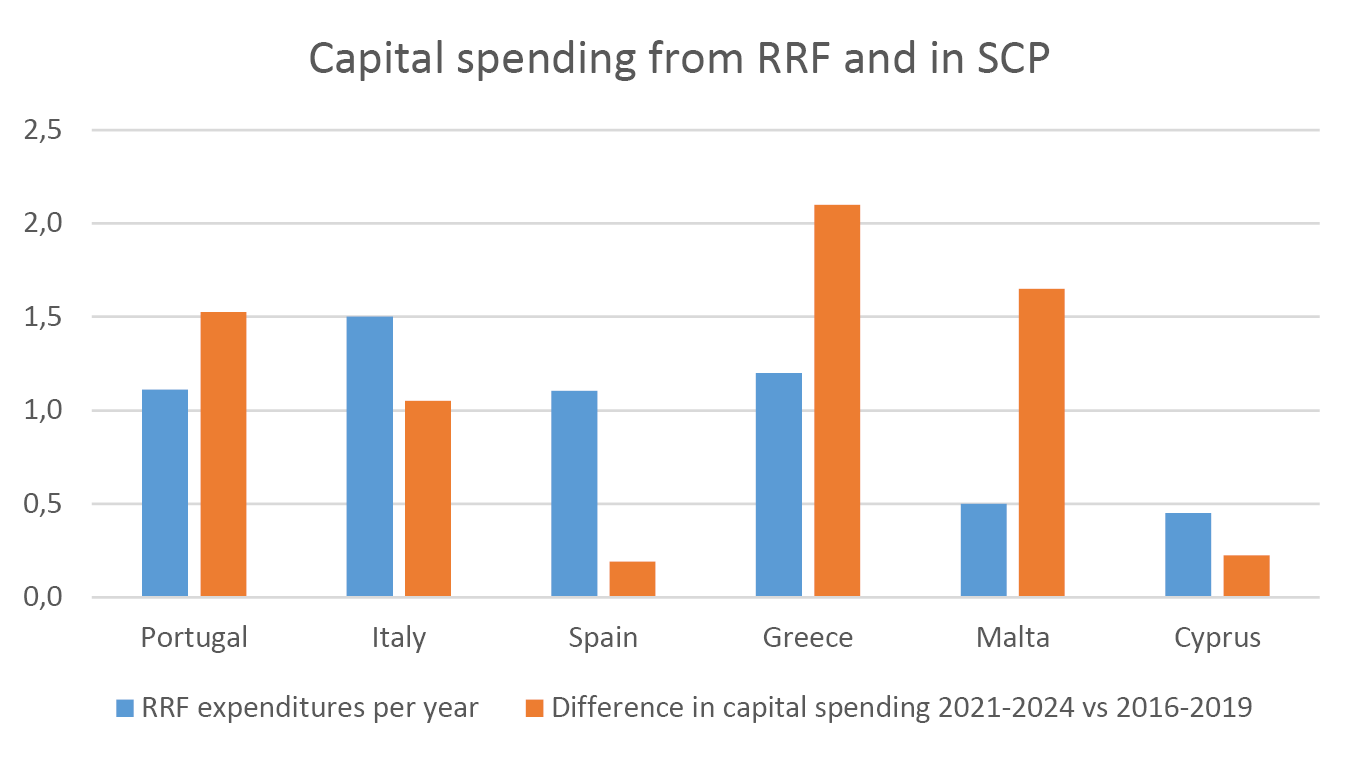
Fig. 9 RRF-Funded Capital Spending, % GDP.
Source of data: EU member states’ Stability Plans (April 2021) and authors’ calculations.
Fourth, transparency, at a minimum, helps the perception of the investment programme and does not lead to significantly higher costs. While the key benefit of transparency is to help ensure that financial support is used for its intended purpose, it can also help the public perception of the investment programme. In response to criticisms by the European Parliament and Civil Society Organisations, EFSI’s transparency was strengthened. The EIB published the rationale for decisions over EFSI funding and a scoreboard used by the EIB to assess EFSI operations while protecting commercially sensitive operations. As a result, the perception of EFSI improved.
Finally, investment plans should also be complemented by structural reforms. Public investments offset investment gaps that arise because market failures or investment barriers thwart private investment. Structural reforms can eliminate some investment barriers and raise GDP substantially. This was recognised in 2014 when structural reform recommendations complemented the creation of EFSI. It remains very relevant today. Consider the example of Italy, which plans RRF-funded investments of almost 12% of 2020 GDP over the next six years. A staff working document by the European Commission estimated that these investments will lift Italy’s GDP permanently.10 By 2040, Italian GDP could still be 1.1% higher relative to the case in which the investments were not implemented. Implementing structural reforms, even if these only halved the distance to the best performers, are thought to be able to raise GDP by 17% by 2040.
1.4 Will This Time Be Different?
Governments have learnt their lesson about the effects of precipitated fiscal consolidations. Many EU governments addressed the economic downturn in 2008–09 with fiscal stimulus programmes. These programmes were, however, quickly reversed in 2010–11 as some governments were forced by markets to reduce borrowing and hence expenditure. Others, despite lack of market pressure, decided that it was prudent to consolidate budgets. Ten years later, things look different. Government expenditures rose substantially in 2020 to address the health crisis and its economic fallout. Investment increased in lockstep. Moreover, governments plan to increase investment even further in the next three years.
Current conditions are exceptionally benign with very low borrowing rates and little market pressure due to the ECB government-bonds buying programmes. Despite high indebtedness of some EU member states (Figure 10), borrowing rates remain low, also owing to large-scale government bond-buying programmes of the ECB. In his presidential address to the American Economic Association in 2019, Olivier Blanchard (Blanchard 2019) argues that when nominal growth of GDP exceeds the nominal interest rate, governments can afford moderate deficits and yet keep stable or even decreasing debt to GDP ratios.11 Moreover, he argues that, at least in the US, nominal growth is more often than not higher than the nominal interest rate.
The ongoing recovery creates a window of opportunity in which governments can act by investing. With borrowing rates close to zero and the continuing economic upswing, governments can focus on implementing structural policies and sustaining higher expenditures to address long-term issues like digitalisation, climate change, and social cohesion.
Governments should also understand that the current benign conditions might change quickly. Blanchard made very clear in his lecture that he was calling for a “richer discussion” on the topic rather than to return policymaking to the thinking of the 1960s, when the mainstream IS-LM model demonstrated that expansionary fiscal policy is essentially free, while ignoring the government budget constraint. Rather, policymakers should take the current situation as a lucky confluence of favourable conditions, which may deteriorate suddenly at any point in the future. Thus, policymakers should take advantage and address the pressing longer-term challenges to their countries, but remain mindful that fiscal stimulus has not become perpetually free.
An early return to the provisions of the Stability and Growth Pact in 2023 carries risks for public investment.12 Government expenditure rose sharply in 2020 and revenues declined, resulting in large increases in government debt in the EU (Figure 10). The size of the debt increase was higher for countries with higher pre-pandemic debt and sharper declines in economic activity in 2020. While European policymakers remain committed to supportive policies to strengthen the recovery, the decision to reintegrate the EU fiscal rules in 2023 could require large fiscal consolidations in some countries, creating risks for public investment. If fiscal rules were reimposed without any changes, highly indebted countries may once again opt for cutting public investment to make ends meet.
Policymakers face a difficult trade-off between letting the economy recover for longer by postponing fiscal consolidation and the risk that their borrowing costs rise before they have countered the increase in debt-to-GDP ratios. Currently, even highly indebted countries are able to borrow and roll over debts due to large-scale bond buying programmes of the ECB. This, however, cannot be taken for granted if inflation picks up significantly, for instance. After all, current debt levels and increases largely exceed those in the period of the European sovereign debt crisis that precipitated the large fiscal corrections in Southern Europe. That said, the RRF constitutes the first European example of a common, joint fiscal policy action that it is based on risk-sharing and on the issuance of a common debt. The RRF explicitly increases EU cohesion and solidarity. This precedent may make it less likely that financial markets will succeed in testing the strength of member states’ commitment to the currency union than in 2011–12.
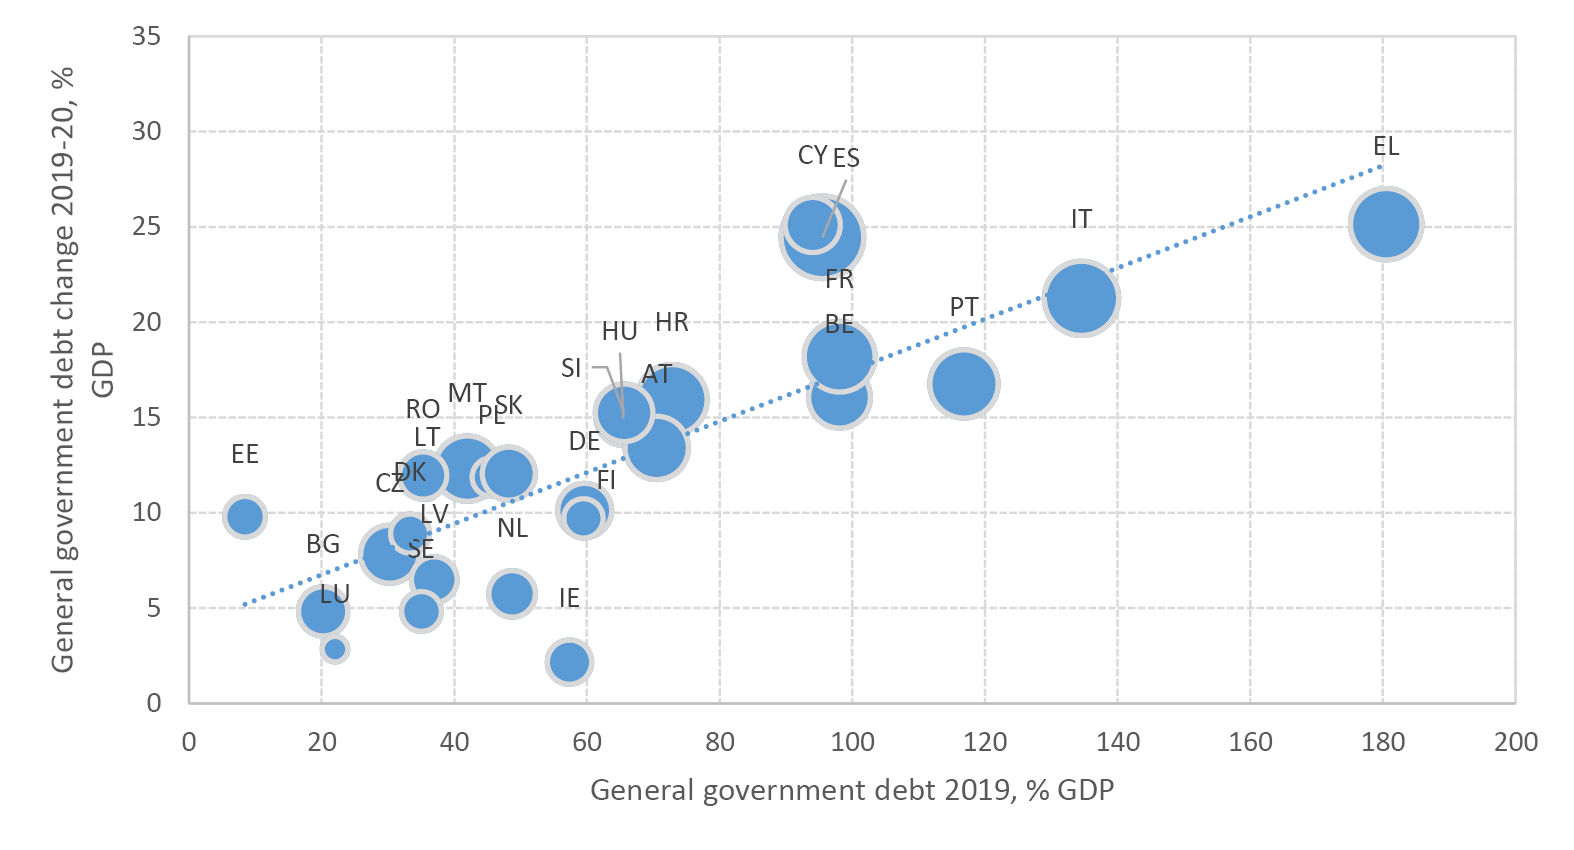
Fig. 10 Change in General Government Debt and Debt Levels in 2019, % GDP.
Source of data: EC Macroeconomic Database (AMECO), and authors’ calculations.
Note: The size of the bubbles reflects the size of the decline of GDP in 2020.
1.5 Conclusion
Following the COVID-19 crisis, the new mantra is to “rebuild better”. A strong commitment to supporting investment has emerged and been reflected, inter alia, in the EU’s Recovery and Resilience Facility. This is welcome news, as Europe had only just started to recover from a twenty-five-year low in public investment intensity. Investment gaps are large, in particular in the context of the structural changes required to put the economy on an environmentally more sustainable path.
Is this time different? The current fiscal programmes appear to avoid the cut to public investment that has typically followed recessions in the past. Refinancing conditions are, for the moment, exceptionally benign, creating a window of opportunity in which governments can act by investing and gradually putting their debts onto sustainable paths. These conditions might worsen quickly, however. Hence the urgent need to make best use of the funds to strengthen economic growth. In order to be successful, public investment programmes need to be properly operationalised, monitored, and evaluated, and should be should be complemented by structural reforms boosting private investment.
References
Alberto, A., O. Barbiero, C. Favero, F. Giavazzi and M. Paradisi (2017) “The Effects of Fiscal Consolidations: Theory and Evidence”, Working Paper 23385, Working Paper Series, National Bureau of Economic Research.
Blanchard, O. (2019) “Public Debt and Low Interest Rates”. American Economic Review 109(4): 1197–229.
European Investment Bank (2021) Chapter 4: Tackling Climate Change: Investment Trends and Policy Challenges. Investment Report 2020–2021. EIB: Luxembourg.
European Commission (2020) Stepping up Europe’s 2030 Climate Ambition: Investing in a Climate-Neutral Future for the Benefit of Our People. SWD (2021) 176 Final, September.
European Commission (2021) Analysis of the Recovery and Resilience Plan of Italy. SWD (2021) 165, April.
European Court of Auditors (2019) European Fund for Strategic Investments: Action Needed to Make EFSI a Full Success. Special Report no. 3.
European Investment Bank (2018) Investment Report 2018/2019: Retooling Europe’s Economy. EIB: Luxembourg.
Jordà, Ò. (2005) “Estimation and Inference of Impulse Responses by Local Projections”, American Economic Review 95(1): 161–82.
3 We use the ratio of investment to GDP and the investment rate interchangeably here. The same is true for investment and gross fixed capital formation. Unless stated explicitly, government investment refers to gross fixed capital formation of the general government, where general government includes all levels of government within a country―local, regional, and central.
4 This increase in the investment rate was only partially due to the large decline in GDP in 2020, because EU real government investment in 2020 increased by 2.9% relative to 2019.
5 We group countries as follows: Southern Europe comprises Cyprus, Greece, Italy, Malta, Portugal, and Spain. Western and Northern Europe consists of Austria, Belgium, Denmark, Germany, Finland, France, Ireland, Luxembourg, the Netherlands, and Sweden. The group of Central and Eastern Europe comprises the remaining EU member states―Bulgaria, Croatia, Czechia, Estonia, Hungary, Latvia, Lithuania, Poland, Romania, Slovakia, and Slovenia.
8 Here, firms with fewer than 500 employees.
9 e.g., Belgium, France, and Italy.
10 European Commission (2021).
11 This claim is seen as controversial by many. See, for instance, the dedicated section in the AEA Papers and Proceedings: https://www.aeaweb.org/issues/592. Blanchard himself said that this proposition was to stimulate debate rather than to assert fact.
12 See the European Commission’s Economic Governance Review for a discussion of how governance frameworks can support economic growth and sustainable government finances.
