10. COVID-19 and the Corporate Digital Divide1
© Chapter Authors, CC BY 4.0 https://doi.org/10.11647/OBP.0280.10
Introduction
The COVID-19 crisis is likely to play a dual role in digital technology adoption. On the one hand, the crisis has led to wider recognition of the importance of innovation and digital transformation. According to the 2020 results of the EIB Investment Survey (EIBIS), a majority of firms in the EU and the US expect COVID-19 to have a long-term impact on the use of digital technologies (EIB 2021a). On the other hand, many firms have experienced a falloff in revenue and liquidity during the pandemic. This may force firms to focus on short-term survival strategies (Revoltella, Maurin, and Pal 2020), leading them to delay or cancel investment. Therefore, whilst the need to adopt digital technologies is more salient than ever, a collapse in firm investment may impede the creation, transfer, and adoption of new digital technologies.
The benefits associated with digital adoption have long been established. Digital technologies, such as advanced robotics, 3D printing, artificial intelligence, or the internet of things, are associated with higher firm productivity and innovation activities (Gal et al. 2019; Rückert, Veugelers, and Weiss 2020; EIB 2021a). Policymakers should pay particular attention to digital technology adoption as its impacts extend beyond firms’ productivity and competitiveness to also include labour markets effects (Frank et al. 2019; Acemoglu and Restropo 2020; EIB 2021a).
Until recently, the implementation of digital technologies was usually associated with the largest, most innovative and modern companies. However, the pandemic has placed issues of digital transformation at the heart of many firms’ survival. Digital technologies were indispensable to preventing business disruption, organising work remotely, improving communication with customers, suppliers and employees, and selling products and services online. Businesses that had adopted digital technologies were therefore better able to cope with the disruption unleashed by the COVID-19 pandemic and better able to forge ahead with digital technology adoption. Due to the pandemic, digitally laggard firms were exposed ever more clearly to the need for change, whilst simultaneously being less able to move into a higher digital gear. Will the pandemic turn out to be a momentum for catching up and closing the digital divide? Or in contrast, will it lead to a more polarised economic structure, with the benefits concentrated in a few “superstar” firms leaving many firms and workers on the losing side?
Several recent studies provide evidence of polarisation and of “winner-takes-all” market dynamics linked to the use of digital technologies, especially on a global scale. Andrews, Criscuolo, and Gal (2016) show an increasing productivity gap between firms at the global frontier and laggard firms.2 Debates surrounding “winner-take-all” markets have been particularly strong in the EU, as the winners are most associated with “Big Tech” firms coming from the US, South Korea, or China. EU firms are hardly present among the Big Tech giants or the leading digital R&D investors that push the frontier of digital technology (Veugelers 2018; EIB 2021a). This growing digital polarisation in the global corporate landscape has implications for the rising polarisation of firm productivity and performance. If EU firms are unable to integrate new digital technologies into their business models, they will lose out, even in the sectors where they are currently still global leaders such as the automotive sector.
Even though these are first-order concerns, recent large-scale firm-level evidence about digital technology adoption across EU countries and the US is scant. Measuring digital adoption by firms and assessing the extent to which digitalisation may be transforming and affecting different economies can be challenging due to the lack of comparable firm-level data across countries.
To foster an evidence-based debate on the impact of digitalisation, this chapter relies on annual EIBIS data on more than 13,000 companies from twenty-nine countries. In 2020, the survey was conducted between May and August, several months after the outbreak of the COVID-19 pandemic. The survey monitors firms’ use of various advanced digital technologies, allowing us to capture digital adoption rates and assess the impact of digital transformation on different economies. In 2020, EIBIS also asked firms about their future digital perspectives.
Our main contributions are as follows. First, we identify digitalisation profiles based on firms’ current use of digital technologies and their perspectives on the expected long-term impact of COVID-19 on digitalisation. Using these profiles, we first show a growing digital polarisation. Second, we show that this digital polarisation matters by investigating the relationship between digital profiles and various measures of firm performance—including innovation activities, labour productivity, and employment growth. Our survey data also allow us to provide evidence that firms along the digital divide grid face different obstacles to investment. The findings suggest that addressing barriers to digital infrastructure and skills, which are both major impediments to digital technology adoption, should be a priority if policymakers want to support digital transformation and redress the digital divide. Addressing the regulatory burden and the uncertainties regulations can create should also be high on the digital policy agenda.
10.1 Adoption of Digital Technologies and Their Increased Use after COVID-19
The analysis presented here relies on data from EIBIS, a firm-level survey administrated annually to senior managers or financial directors of a representative random sample of firms in each of the twenty-seven countries of the EU, the UK and the US.3 EIBIS is designed to be representative of the business population in each country for different sectors and firm size categories.4 Importantly, the design and implementation of the survey is consistent across countries, which is critical for understanding differences in the adoption of digital technologies. In addition, the survey does not only cover firms in the manufacturing sector but also firms in services, construction and infrastructure.
In EIBIS, firms are surveyed about the use of four advanced digital technologies that are specific to their sector.5 They are asked the following question: “Can you tell me for each of the following digital technologies if you have heard about them, not heard about them, implemented them in parts of your business, or whether your entire business is organised around them?” A firm is identified as “digital” if at least one digital technology is implemented in parts of the business and/or if the entire business is organised around at least one digital technology.
The survey thus provides us with unique information on the adoption of digital technologies in the EU and the US compared to other databases. Eurostat data used in the Digital Economy and Society Index (DESI) do not include US firms, which is paramount information for the analysis of the digital divide discussed in this paper.6 Similarly, OECD statistics on ICT access and usage by businesses provide data on two indicators for the US, but only in 2007 and 2012.7
10.1.1 Taking Stock of Digital Adoption
The results of EIBIS show that digital technology adoption is spreading rapidly (Figure 1): the share of digital firms has increased by 5 pp compared to 2019, both in the EU and in the US. However, the EU is not closing its digital gap with the US. EU firms are and continue to be lagging behind the US in terms of digital adoption. In 2020, only 63% of EU firms have implemented at least one digital technology, compared to 73% in the US (Figure 1).
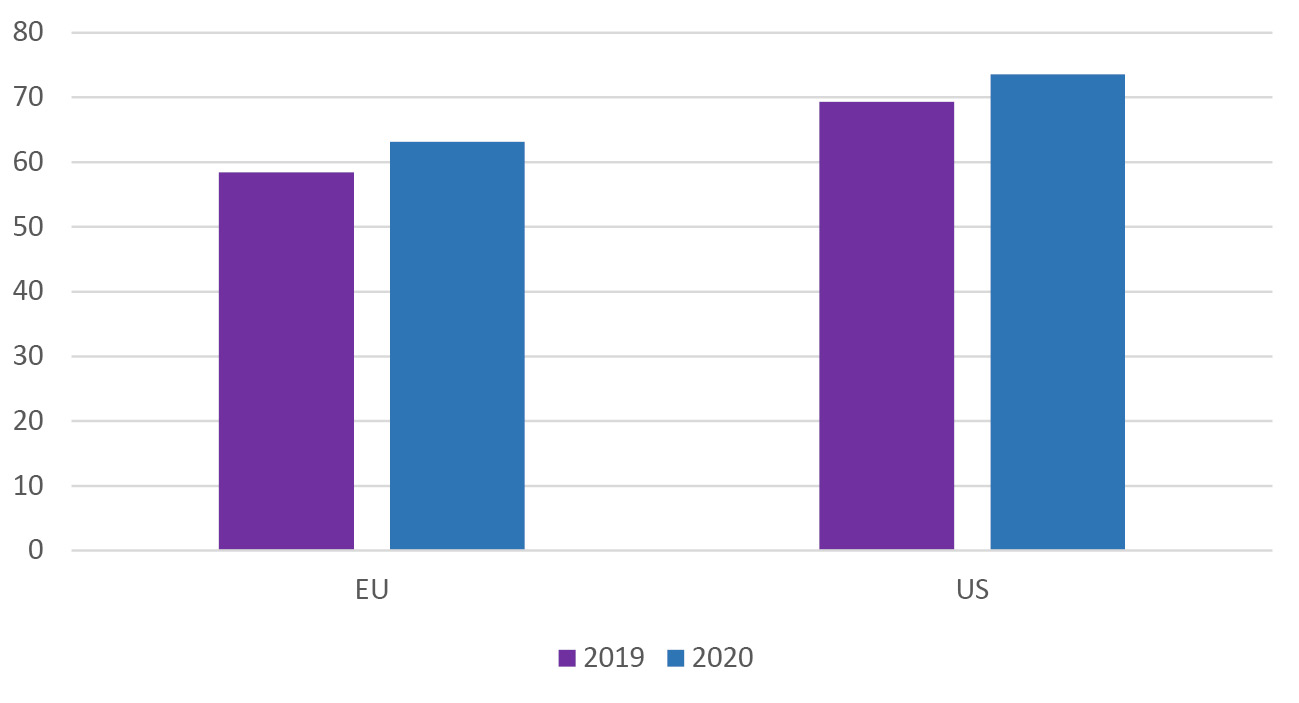
Fig. 1 Adoption of Digital Technologies (% of Firms).
Source of data: EIB Investment Survey (EIBIS wave 2019 and 2020).
Note: A firm is identified digital if at least one advanced digital technology was implemented in parts of the business. Firms are weighted using value added.
The differences between the adoption rates in the EU and the United States are mainly driven by the lower use of technologies related to the internet of things (IoT), i.e., electronic devices that communicate with each other without assistance (Figure 2). On average, 34% of European firms have adopted this technology, compared to 53% of US firms. EU firms also fall short when it comes to the adoption of drones in the construction sector. For the other digital technologies captured in the survey, the differences in adoption rates between EU and US firms are less pronounced.
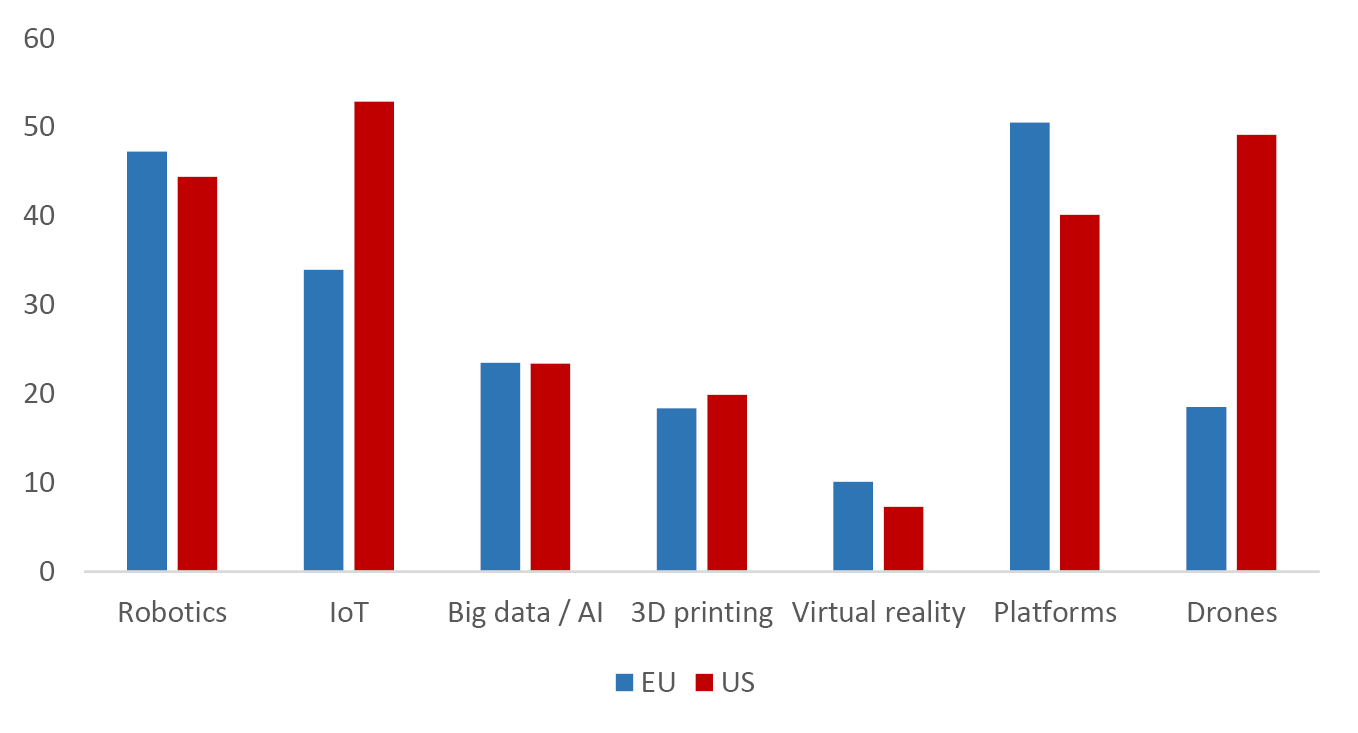
Fig. 2 Adoption of Different Digital Technologies (% of Firms).
Source of data: EIB Investment Survey (EIBIS wave 2020).
Note: A firm is identified digital if at least one advanced digital technology was implemented in parts of the business. Firms are weighted using value added.
10.1.2 The Dual Impact of COVID-19 on Digital Adoption
Throughout 2020, firms were faced with acutely high levels of uncertainty as the COVID-19 crisis weighed on the economic outlook. Uncertainty about the future became a severe constraint to investment activities with half of EU firms considering it to be a major obstacle to investment, up from 34% in 2019 (Figure 3).8 These higher levels of uncertainty jeopardising investment also hold for US firms, albeit less intensely than for EU firms: 42% of US firms consider that uncertainty about the future limit their investment, up from only 18% in the previous year. As a result, we may expect future investment in digital technologies to be postponed or abandoned altogether.
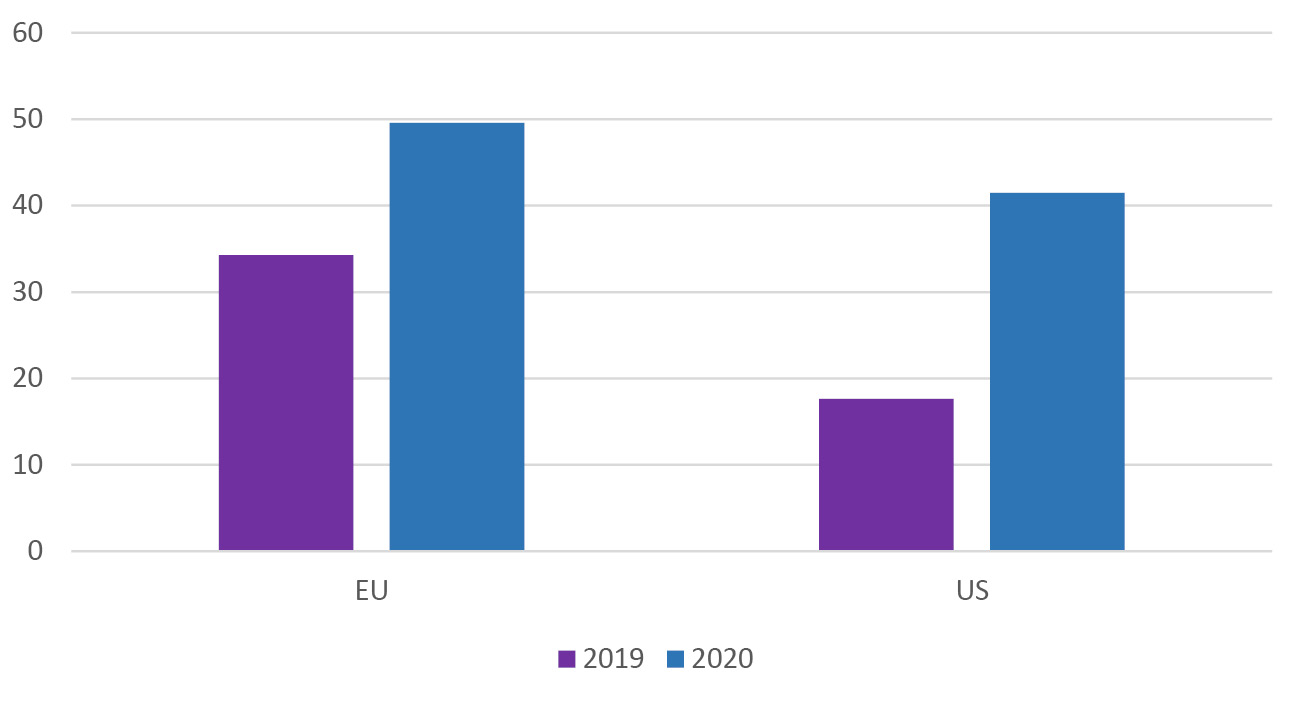
Fig. 3 Uncertainty as a Major Obstacle to Investment (% of Firms).
Source of data: EIB Investment Survey (EIBIS waves 2019 and 2020).
Note: Firms are weighted using value added.
At the same time, a majority of firms report that they expect COVID-19 to increase the use of digital technologies in the long term (50% in the EU and 53% in the US).9 What is more, those firms that are already digitally active are more likely than non-digitally active firms to report that COVID-19 will lead to an increased digitalisation, both in the EU and the US: 57% of EU digital firms think COVID-19 will lead to an increased use of digital technologies, compared to 40% of non-digital firms (Figure 4). This is evidence suggesting that the COVID-19 shock further deepens the corporate digital divide, with leading firms pushing ahead whilst laggards are further falling behind (Rückert, Veugelers, and Weiss 2020).
This divide in the perceived long-term importance of digital technologies is observed both in the EU and in the US, across different sectors and in multivariate regression analysis.10

Fig. 4 Firms Reporting that COVID-19 Will Lead to an Increased Use of Digital Technologies (% of Firms).
Source of data: EIB Investment Survey (EIBIS wave 2020).
Note: A firm is identified digital if at least one advanced digital technology was implemented in parts of the business. Firms are weighted using value added.
10.2 Who Are the Firms Falling Behind? Who Is Forging Ahead?
The previous section has identified a corporate digital divide. A next step is to identify and characterise the firms on each side of the divide. To address this question, firms are classified into four categories based on the combination of their current digital status and their digital outlook: potential frontrunners, digitally stagnant, potential catch-up, and persistently non-digital. Figure 5 positions firms on the digital divide grid according to these categories.
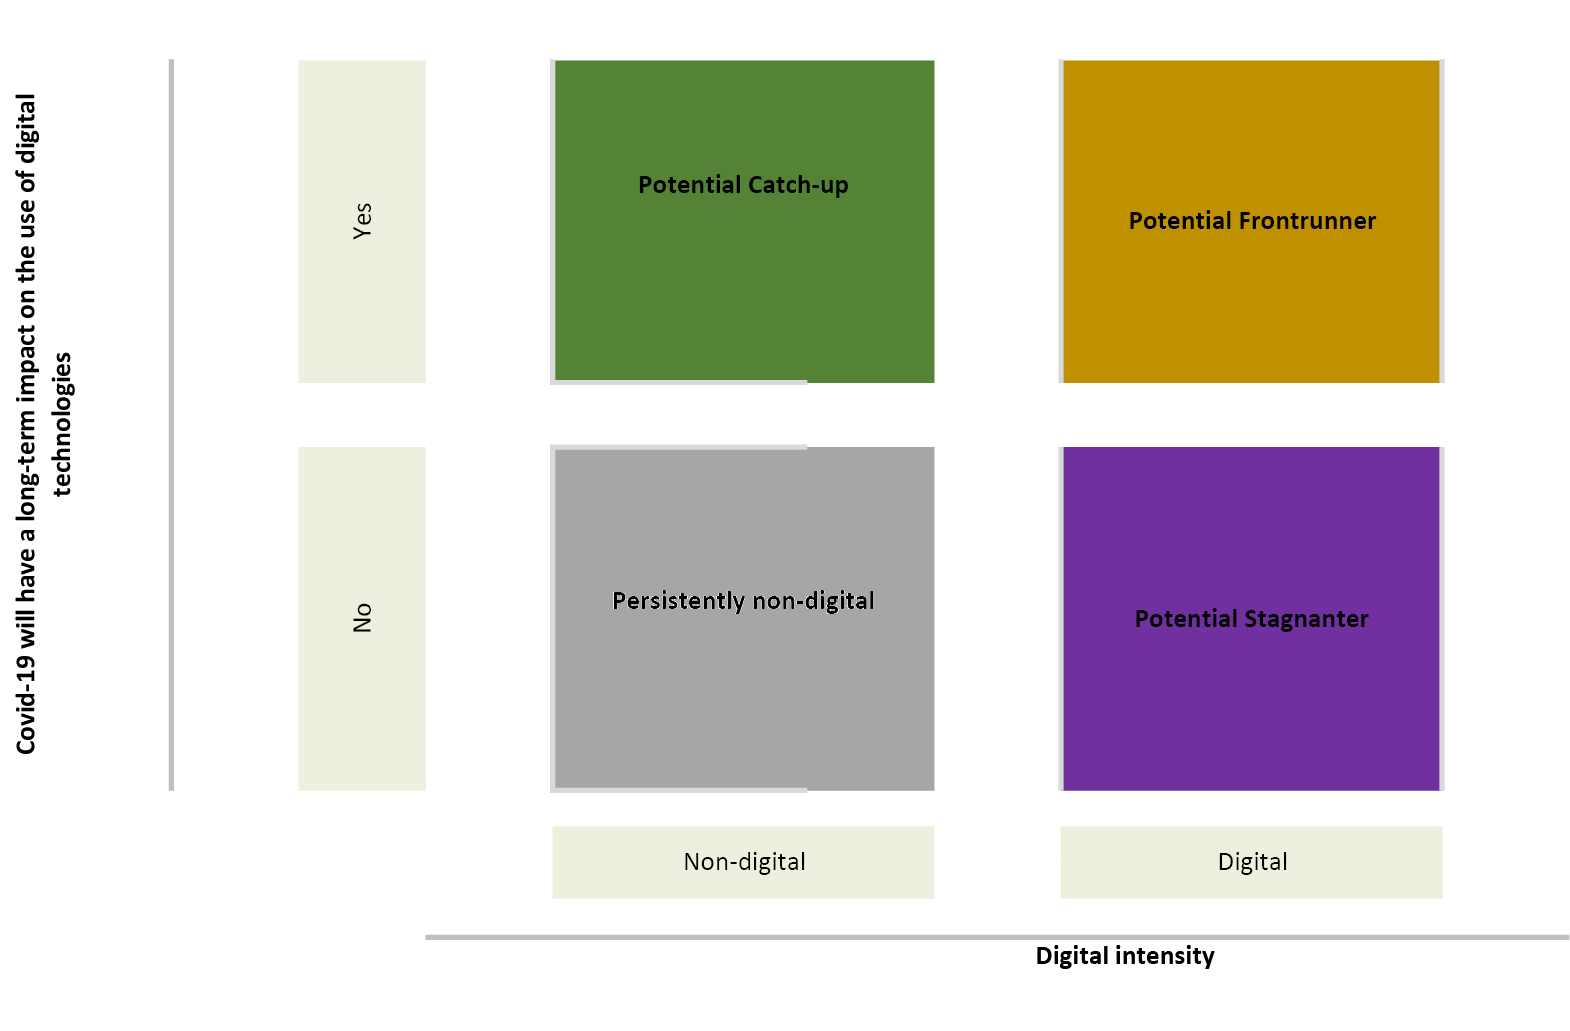
Fig. 5 Corporate Digital Divide Profiles
Firms that have not implemented any digital technology and do not expect digitalisation to become more important in the long term due to COVID-19 years face the threat of falling behind on the digital divide grid. We categorise them as potentially “persistently non-digital”. Companies that are currently non-digital but expect COVID-19 to increase the use of digital technologies are categorised as potential “catch-up”. Among firms that have already implemented digital technologies, some firms do not expect COVID-19 to have a long-term impact on digitalisation: we categorise them as potentially digital “stagnaters”. Finally, already digitally active firms that are expecting an increase in the use of digital technologies are categorised as potential digital “frontrunners”.
Figure 6 displays the share of firms in each of these categories in the US and the EU. The most worrisome part of the digital divide lies with the share of “persistently non-digital” firms in the EU (22%), which is significantly higher than in the US (14%). These firms likely do not intend to take steps to invest in digital transformation, and a policy response may be necessary to prevent them from falling further behind. Perhaps unsurprisingly, given the lower share of digitally active firms in the EU, the share of potential “frontrunners” is slightly lower in the EU than in the US (36% and 40%).
In contrast to this stern outlook for the digital divide in the EU, the share of potential digital “stagnaters” is lower in the EU than in the US (27% and 33% respectively), and the share of non-digital firms that intend to potentially “catch-up” is similar (15% in the EU and 13% in the US).
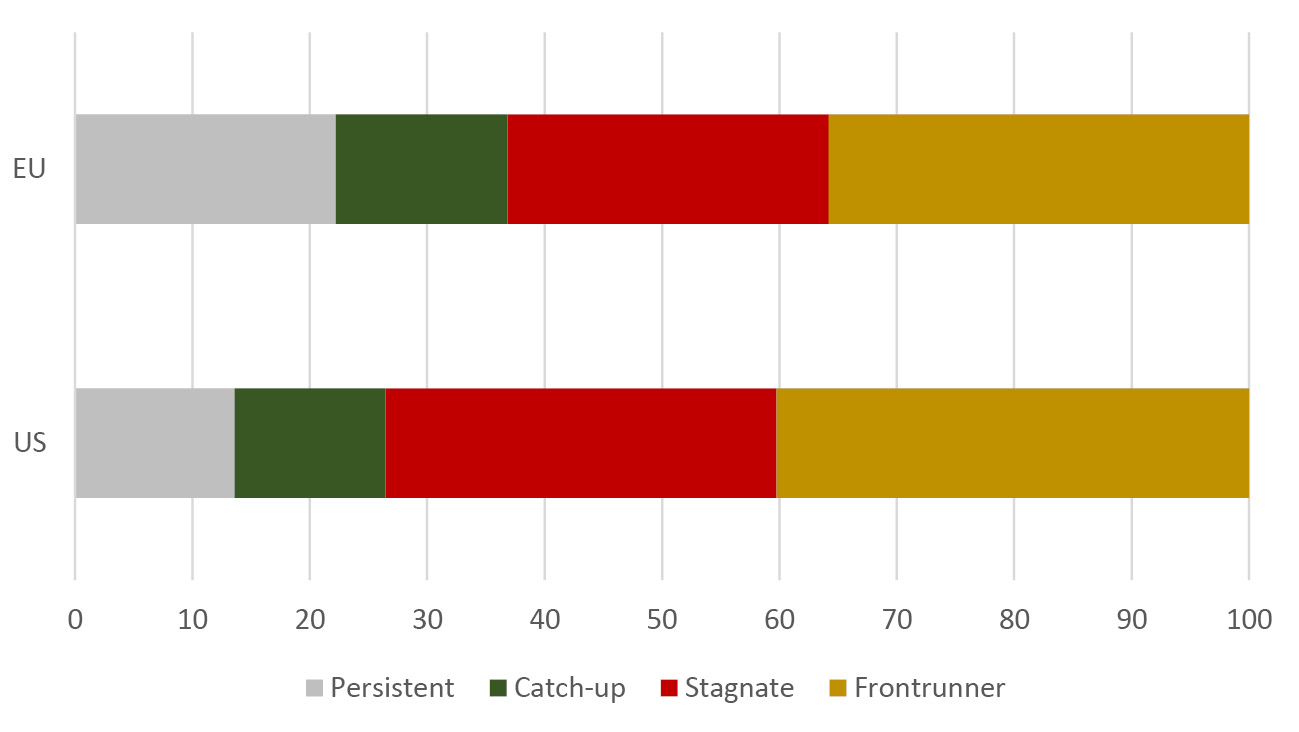
Fig. 6 Corporate Digital Divide Profiles (% of Firms).
Source of data: EIB Investment Survey (EIBIS wave 2020).
Note: See Fig. 5 of the definition of the corporate digital divide profiles. Firms are weighted using value added.
Which companies are falling behind, and which are forging ahead? Grouping the firms along the size dimension, it is clear that size plays an important role in the corporate digital divide. Consistently across the EU and the US, smaller firms are much more likely to be on the wrong side of the corporate digital divide: they are more likely to be “persistently non-digital” and less likely to be potential digital “frontrunners” (Figure 7). Within every size category, EU-US difference are less pronounced, suggesting that the EU-US digital divide differences are due to differences in size composition of the firm population. An exception holds for small firms (of ten to forty-nine employees). The share of small EU firms that are “persistently non-digital” in the EU is higher than in the US (34% and 27%, respectively), while the share of small EU firms that are potential digital “frontrunners” is lower (only 23%, compared to 30% in the US). This lack of investment in digital technologies by small EU firms is an area of concern because there are many more small firms in the EU than in the US (EIB 2021b). The fact that EU firms are smaller on average than those in the United States is likely to be a major disadvantage for accelerating the adoption of digital technologies (Revoltella, Rückert, and Weiss 2020). If EU policymakers want to close the gap in digital adoption with the US, they need to particularly address what is holding back small firms.
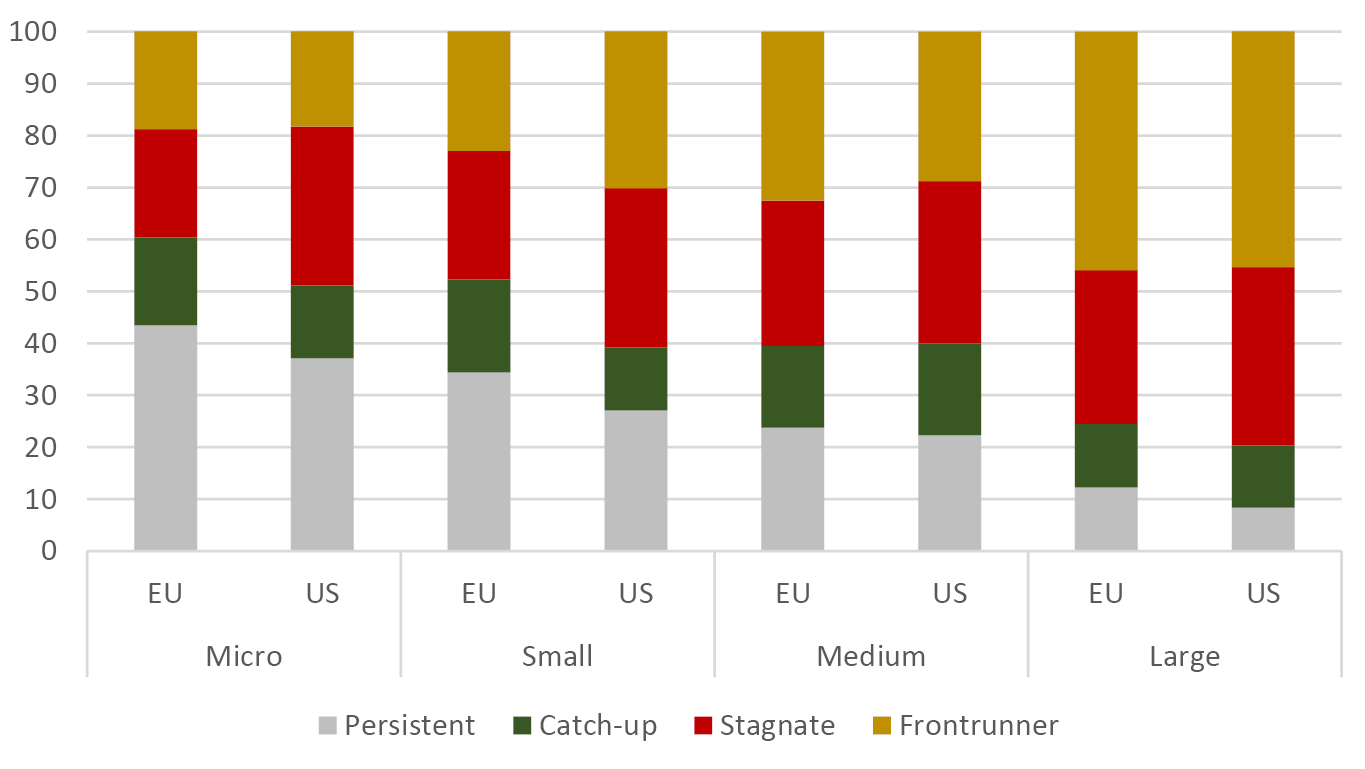
Fig. 7 Corporate Digital Divide Profiles (% of Firms), by Firm Size.
Source of data: EIB Investment Survey (EIBIS wave 2020).
Note: See Fig. 5 of the definition of the corporate digital divide profiles. Micro firms: 1 to 9 employees, small firms: 10 to 49 employees, medium-sized firms: 50 to 249 employees, large firms: 250+ employees. Firms are weighted using value added.
Differences between the EU and the US in corporate digital divide profiles are also associated with firm age (Figure 8). In the US, young firms (less than ten years old) are taking digital technologies much more seriously: the share of young firms that are “persistently non-digital” is smaller than for old firms. In the EU, the share of young firms that are “persistently non-digital” is larger than for old firms, and the share of young firms that are potential digital “frontrunners” is lower.
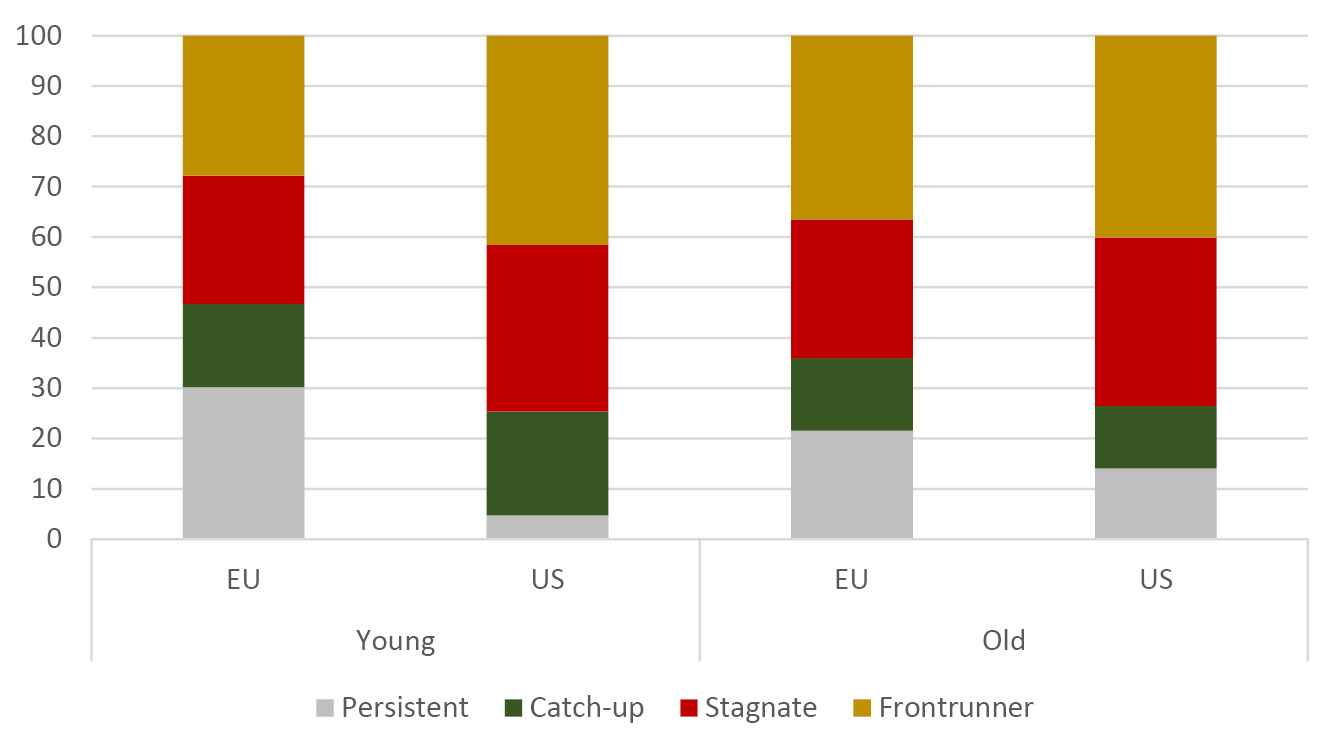
Fig. 8 Corporate Digital Divide Profiles (% of Firms), by Age.
Source of data: EIB Investment Survey (EIBIS wave 2020).
Note: See Fig. 5 of the definition of the corporate digital divide profiles. Young: less than ten years. Old: ten+ years. Firms are weighted using value added.
10.3 Firm Performance along the Digital Divide Grid
It is concerning that a large share of non-digital firms that do not take digital transformation seriously. This persistent lagging behind could have serious long-term repercussions, especially regarding their performance and long-term success. In the following, we look at how firms with different digitalisation profiles perform with regards to employment growth, skills and training of employees, and innovation activities. This analysis is purely correlational and cannot be interpreted as causal.
By comparing the current number of employees with the number of employees in the same firm three years ago, Figure 9 shows that “persistently non-digital” firms are less likely to increase employment. This holds both in the EU and in the US. Firms’ positioning on the corporate digital divide thus matters for employment growth: firms forging ahead with digital transformation are more likely to be dynamic than those that do not invest in digital technologies and are left behind. Multivariate regression analysis confirms the positive association with employment growth: potential digital “frontrunners” are 10% more likely to report positive employment growth over the past three years than “persistently non-digital” firms.11
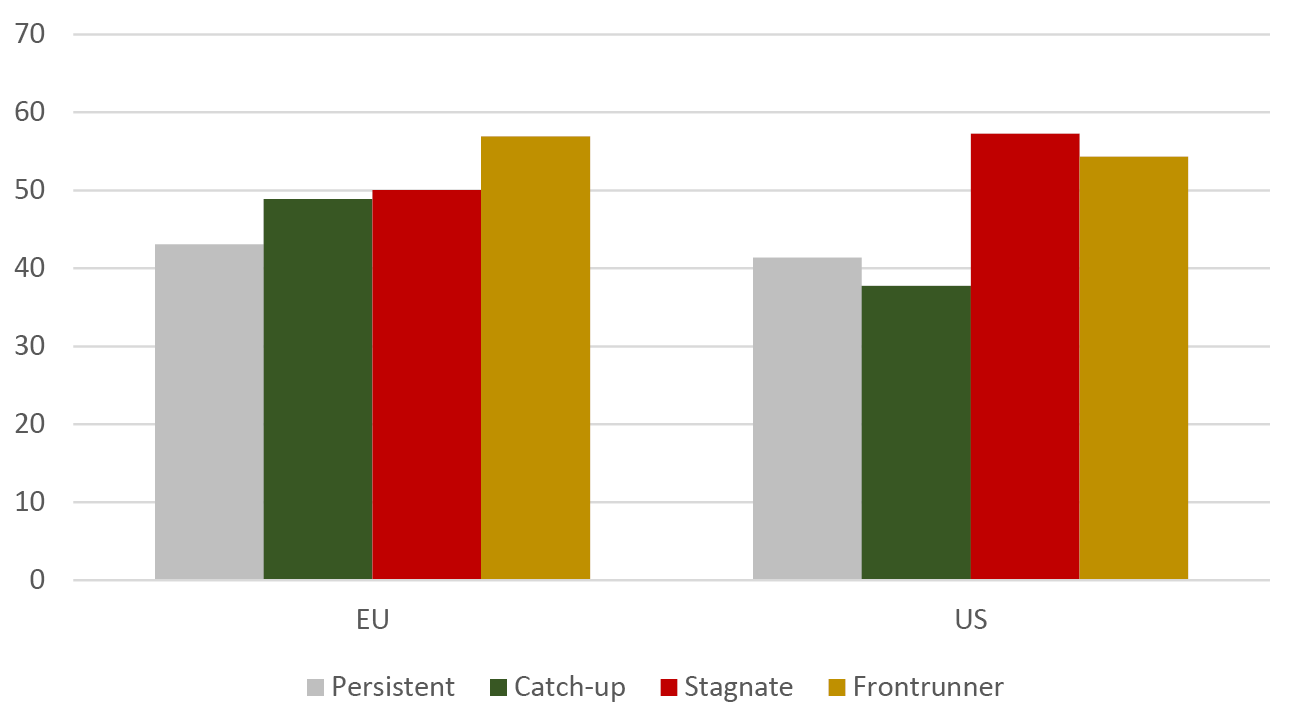
Fig. 9 Share of Firms with Positive Employment Growth over the Past Three Years (% of Firms), by Corporate Digital Divide Profiles.
Source of data: EIB Investment Survey (EIBIS wave 2020).
Note: See Fig. 5 of the definition of the corporate digital divide profiles. Firms are weighted using value added.
As argued by many economists, digital technologies—such as artificial intelligence, machine learning and industrial robots—can have an impact on shifting demand for skills, creating winners and losers among employees, impacting job polarisation (Acemoglu and Autor 2011; EIB 2018; Frank et al. 2019; Acemoglu and Restrepo 2020). We find that there are significant differences in the average wage paid by firms to their employees across the corporate digital divide profiles (Figure 10). Potential digital “frontrunners” grow faster and tend to pay higher wages to their employees, both in the EU and the US. Assuming that average wage per employee can be a proxy for the level of the skills of the workers employed by the firm, this suggests that the jobs created by the potential digital “frontrunners” tend to be for more skilled workers.
However, the pattern across the other corporate digital profiles differs between the EU and the US. In the EU, average wages are higher for more advanced corporate digital divide profiles, the highest wages paid by potential “frontrunners”, the lowest by “persistently non-digital” firms. For the US, we find a U-shaped relationship. US firms that intend to invest in digital transformation (the “catch-up”) or those that are already implemented some digital technologies but do not intend to forge ahead (the potential digital ”stagnaters”) are paying lower wages on average. This may support evidence of wage polarisation due to digital technologies in the US labour market.
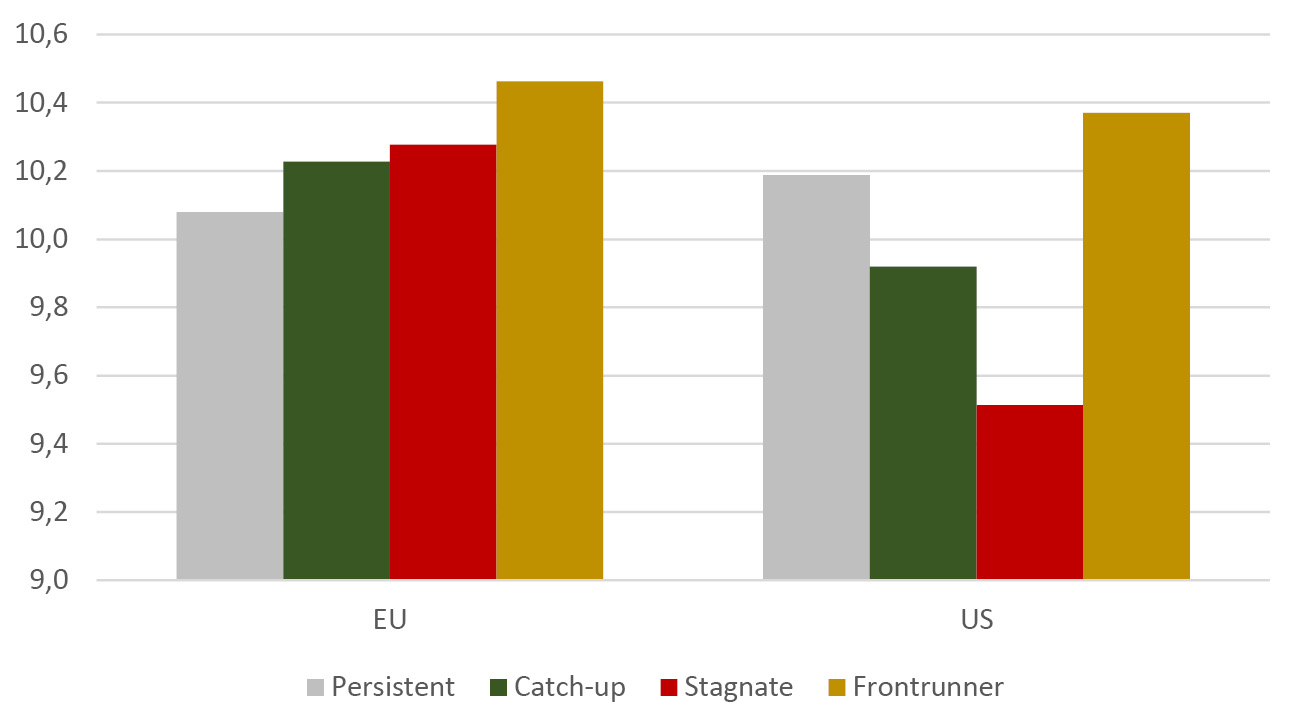
Fig. 10 Log Average Wage per Employee (in EUR), by Corporate Digital Divide Profiles.
Source of data: EIB Investment Survey (EIBIS wave 2020).
Note: See Fig. 5 of the definition of the corporate digital divide profiles. Firms are weighted using value added.
There are also significant differences in investment in employee training across the four corporate digital divide profiles (Figure 11): “persistently non-digitally” active firms are less likely to invest in human capital of their employees, which might further exacerbate the digital job polarisation. This result holds both in the EU and the US and in multivariate regression analysis.12 Investment in digital skills—and an environment that is conducive to learning about them —is more likely to come from companies that take digital technologies seriously.
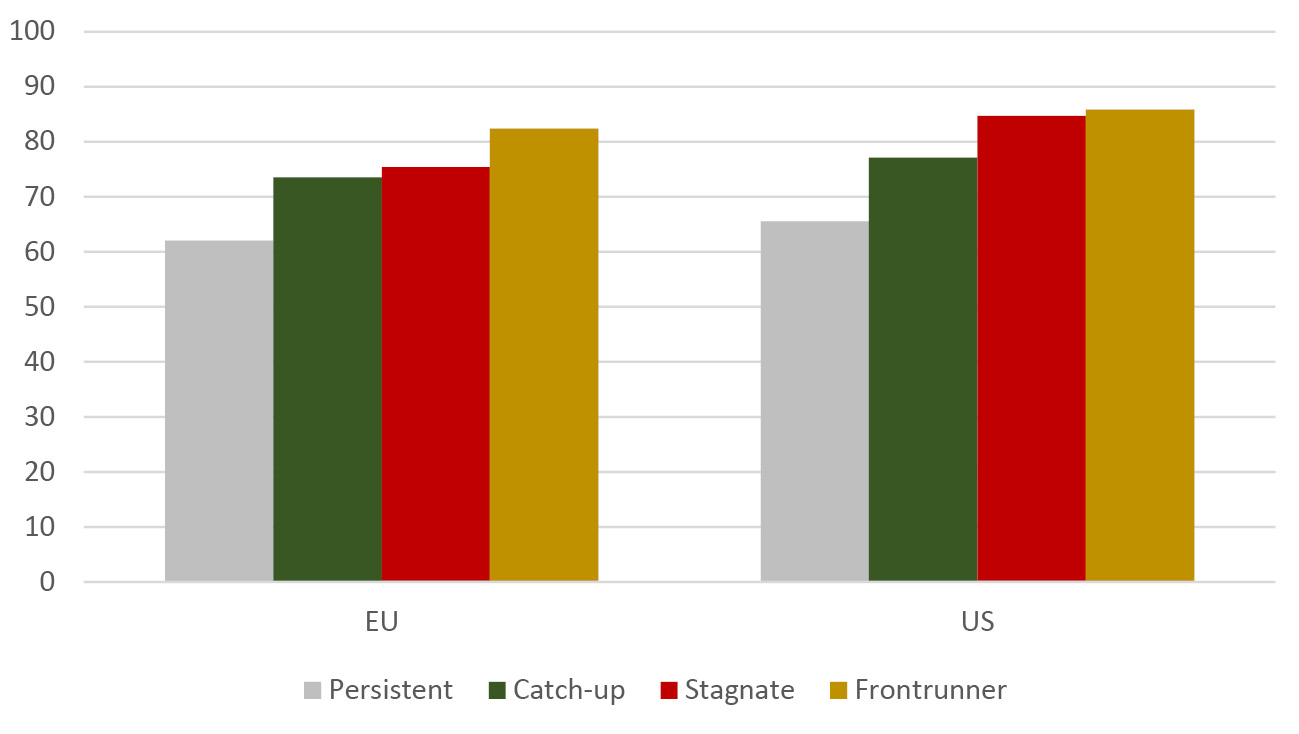
Fig. 11 Firms Investing in Training of Employees (% of Firms), by Corporate Digital Divide Profiles.
Source of data: EIB Investment Survey (EIBIS wave 2020).
Note: See Fig. 5 of the definition of the corporate digital divide profiles. Firms are weighted using value added.
Investment in innovation and digital transformation are closely intertwined. Following Veugelers et al. (2019), we identify companies as active innovators if they invest in R&D and introduce new products, processes and services. We would expect digital technologies to empower innovation and therefore non-digitally active firms to also be less likely innovation active. Figure 12 confirms this: “persistently non-digitally” active firms are less likely to be active innovators. This result holds both in the EU and the US and is confirmed in multivariate regression analysis.13
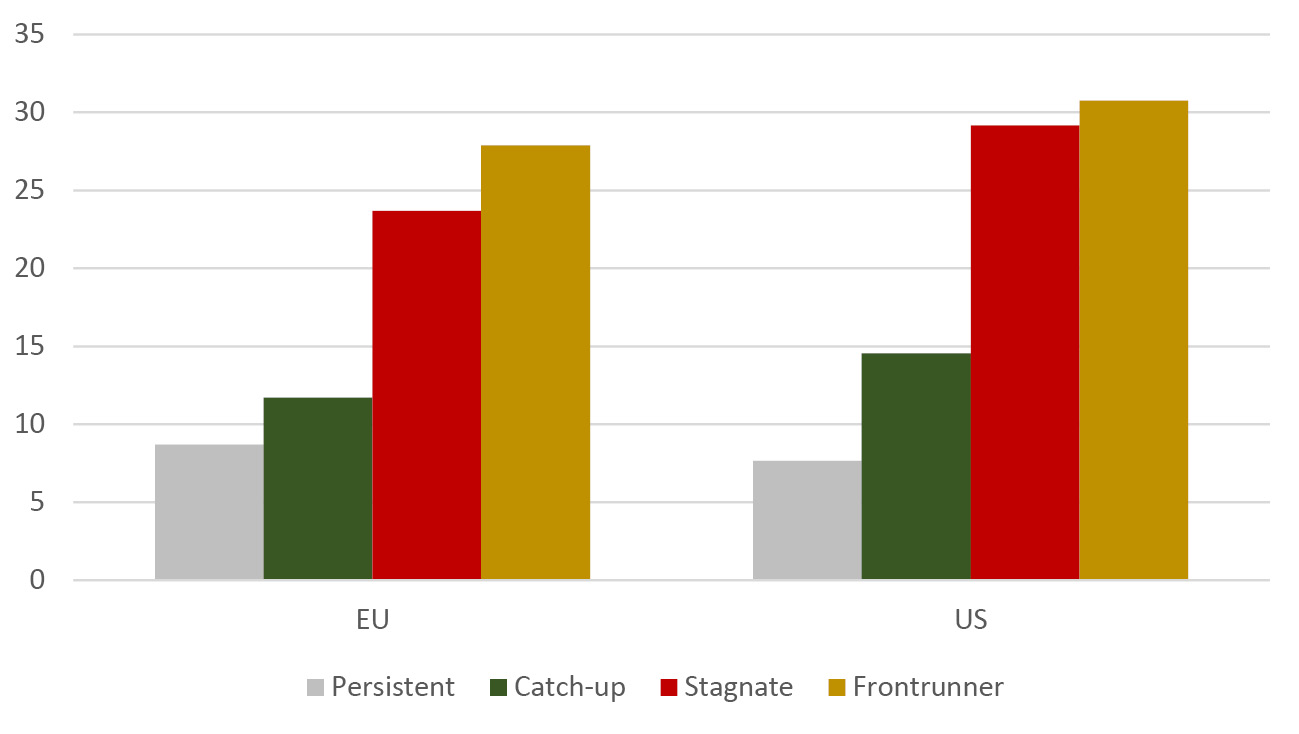
Fig. 12 Active Innovators (% of Firms), by Corporate Digital Divide Profiles.
Source of data: EIB Investment Survey (EIBIS wave 2020).
Note: See Fig. 5 of the definition of the corporate digital divide profiles. Active innovators are firms that invest in R&D and invest to develop or introduce new products, processes or services. Firms are weighted using value added.
10.4 Obstacles to Investment in the EU
EIBIS data also allow us to look at the different barriers and incentives firms perceive when contemplating investment decisions. Identifying any barrier to investment activities that specifically impedes firms that are left on the wrong side of the digital divide is relevant for the identification of policy levers to help move these firms away from of their “persistently non-digital” status, addressing the digital divide. Similarly, identifying the obstacles faced by digital investors will allow EU policymakers to better understand and fast-track investment in digital transformation.
Uncertainty about the future is the most important constraint to corporate investment in the EU, with 50% of EU firms reporting it as a major obstacle (Figure 13). Labour market regulations appear to be a more important obstacle for “persistently non-digital” firms than for other firms, whereas business regulation and taxation is a major concern for roughly 30% of firms, independently from the profile. At the same time, the availability of staff with the right skills is a more severe obstacle for firms that consider that COVID-19 will have a long-term impact on the use of digital technologies. 54% of potential “catch-up” and 47% of potential digital “frontrunners” see it as a major obstacle, compared to 42% of “persistently non-digital” firms and 40% potential “stagnaters”. Access to digital infrastructure is on average less often reported as a major obstacle to investment, but it differs along the digital profile of companies. While 20% of potential “catch-up” and “frontrunners” report this as a major barrier, this only holds for 10% of the “persistently non-digital” firms and 13% of potential “stagnaters”.
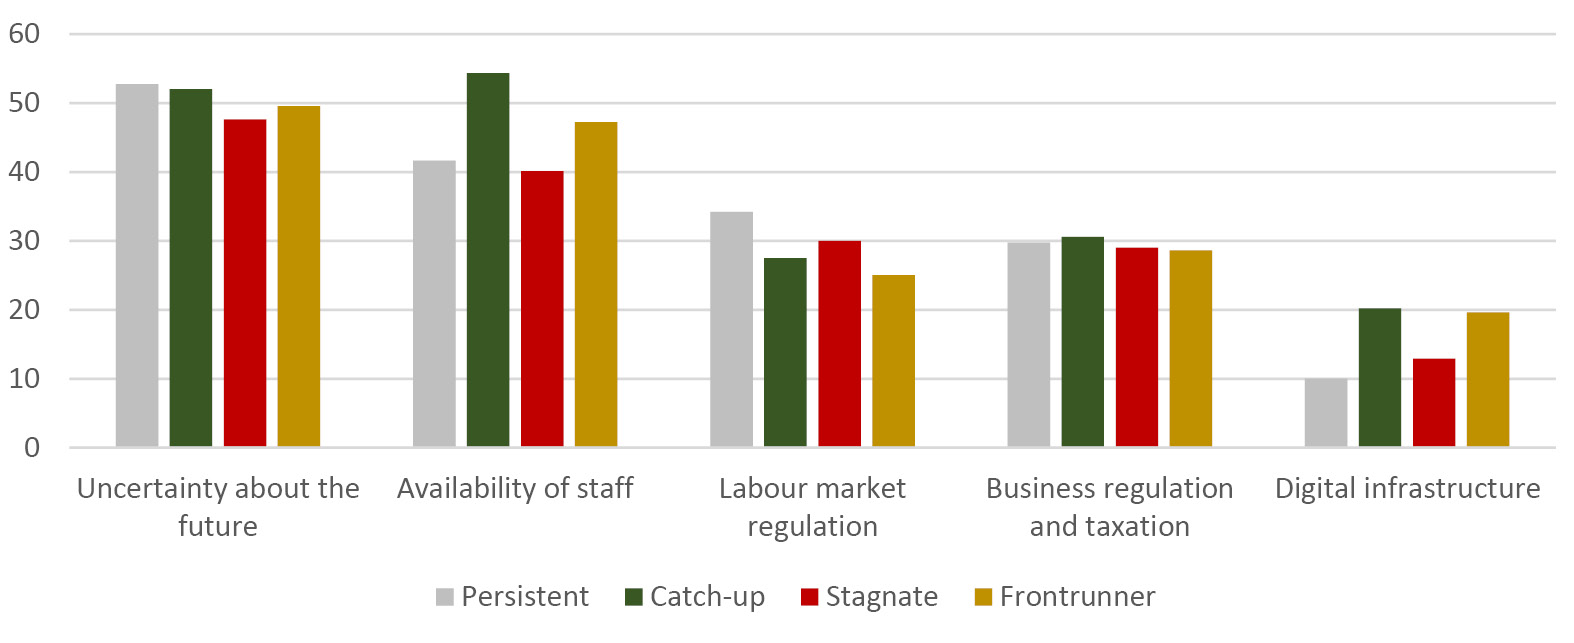
Fig. 13 Major Obstacle to Investment (% of EU Firms), by Corporate Digital Divide Profiles.
Source of data: EIB Investment Survey (EIBIS wave 2020).
Note: See Fig. 5 of the definition of the corporate digital divide profiles. Firms are weighted using value added.
The level of access to digital infrastructure is converging across the EU, with the vast majority of households having access to broadband, but more needs to be done to accelerate the spread of fast connections. There is a negative correlation across countries between the share of households having access to download speeds faster than 1/Gbs and the share of firms reporting digital infrastructure as an obstacle to investment (Figure 14). This indicates that many EU countries have the potential to unlock investment in the digital transformation of businesses by making access to faster broadband speeds more widespread.
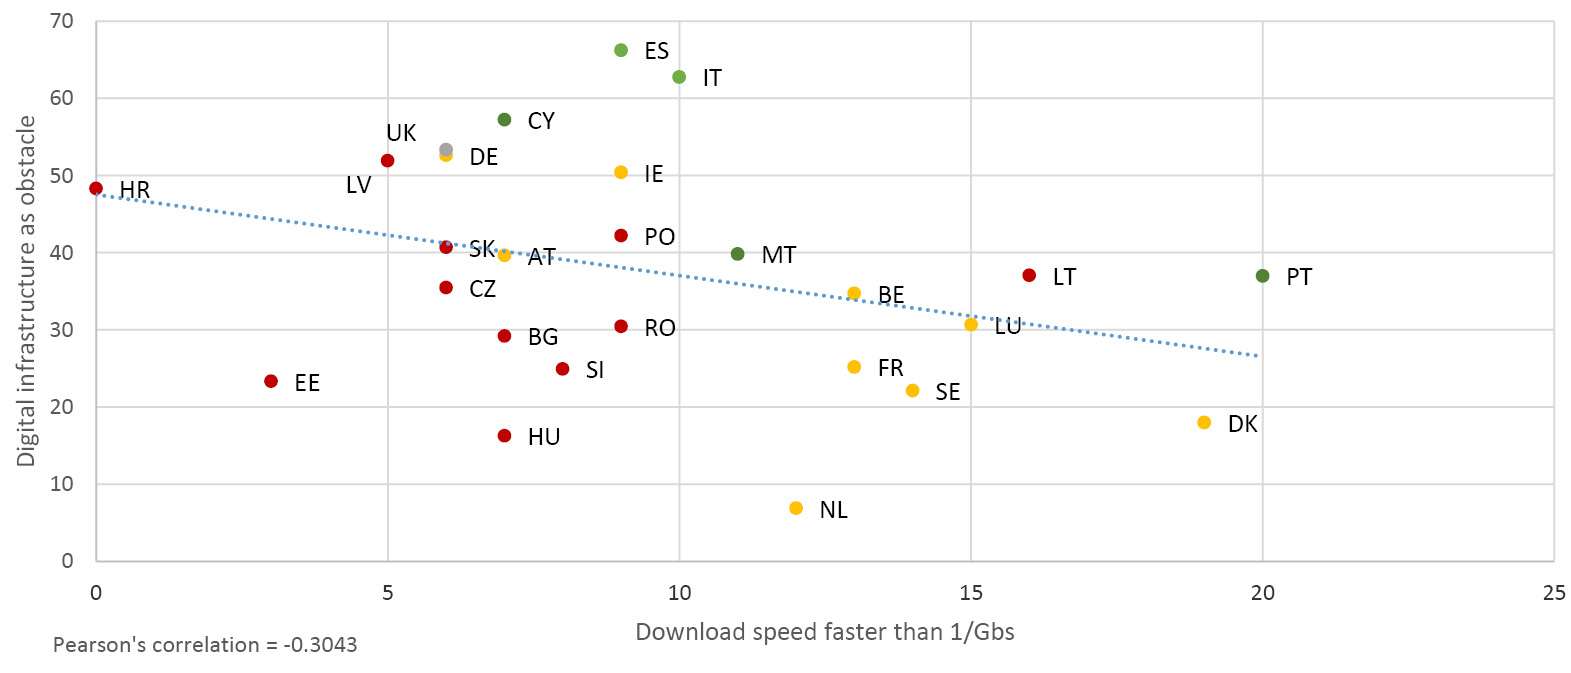
Fig. 14 Download Speed Faster than 1/Gbs (% of Households) and Digital Infrastructure as an Obstacle to Investment (% of Firms), by Country.
Source of data: EIBIS (2020) and Eurostat.
Note: Firms in EIBIS are weighted using value added.
10.5 Conclusion
The analysis presented in this chapter confirms the trend towards a digital divide in the EU and US corporate sector. A substantial share of firms does not implement any state-of-the-art digital technology and does not consider that COVID-19 will have a long-term impact on digitalisation. This share of “persistently non-digital” firms is larger in the EU than in the US, in particular for small firms.
Our results show that dynamics along the digital divide matter for firm performance and employment. “Persistently non-digital” firms are less likely to create new jobs, tend to pay lower wages and invest less in training of employees. They are also less likely to invest in innovation activities.
Lifting firms out of persistent digital non-activity by incentivising them to invest in digitalisation should be a top priority on the policy agenda. Digital transformation is notably a core element of the EU and national recovery and resilience plans to address the COVID-19 crisis.
Effective policy guidance and implementation for digitalisation is especially needed since the COVID-19 crisis may exacerbate the digital divide between firms. Some firms will realise the benefits of implementing digital products, switching to robotic production, using internet of things applications or harnessing the power of big data and artificial intelligence. However, others that fail to innovate and invest in digital transformation are at risk of being left behind. Unprecedented changes in workforce arrangements make the crisis a unique opportunity to raise awareness and encourage non-digital firms to reassess their management strategies and start taking digital transformation seriously before it is too late.
Looking at the major obstacles to investment perceived by firms in the EU also allows us to identify the bottlenecks to unlock further digital transformation. The findings suggest that addressing digital infrastructure and barriers to skills should also be a priority for policymakers to support firms in their digitalisation efforts. Similarly, addressing the regulatory burden and its associated uncertainties should also be high on the digital policy agenda.
To recover from the long-term impact of COVID-19, the EU will need to rapidly create better conditions to foster investment in digital transformation. To ensure that EU firms do not lose ground compared to their US peers, policymakers should strive to preserve a well-functioning, competitive, and integrated EU market environment that will push firms to invest more in the most advanced digital technologies. For example, EU members need to review labour and product market regulations that prevent firms from growing and reaching the size needed for the successful adoption and integration of multiple technologies within their businesses. Policy action should also develop measures to improve the digital skills of workers through training.
References
Acemoglu, D. and D. H. Autor (2011) “Skills, tasks and technologies: Implications for employment and earnings”, in Handbook of Labor Economics, ed. by O. Ashenfelter and D. E. Card, Amsterdam: Elsevier, 1043–171.
Acemoglu, D. and P. Restrepo (2020) “Robots and jobs: Evidence from US labor markets”, Journal of Political Economy 128(6): 2188–244.
Andrews, D., C. Criscuolo and P. Gal (2016) “The best versus the rest: The global productivity slowdown, divergence across firms and the role of public policy”, OECD Productivity Working Paper No. 5.
Brutscher, P.-B., A. Coali, J. Delanote and P. Harasztosi (2020) “EIB Group survey on investment and investment finance―A technical note on data quality”, EIB Working Paper 2020/08.
EIB (2018) Investment Report 2018/19: Retooling Europe’s economy. Luxembourg: European Investment Bank.
EIB (2021a) Investment Report 2020/21: Building a smart and green Europe in the Covid-19 era. Luxembourg: European Investment Bank.
EIB (2021b) Digitalisation in Europe 2020: Evidence from the EIB Investment Survey. Luxembourg: European Investment Bank.
Frank, M. R., D. Autor, J. E. Bessen, E. Brynjolfsson,M. Cebrian, D. J. Deming, M. Feldman, M. Groh, J. Lobo, E. Moro, D. Wang, H. Youn and I. Rahwan (2019) “Toward understanding the impact of artificial intelligence on labor”, Proceedings of the National Academy of Sciences 116(14): 6531–539.
Gal, P., G. Nicoletti C. von Rüden, S. Sorbe and T. Renault (2019) “Digitalization and productivity: In search of the Holy Grail—firm-level empirical evidence from European countries”, International Productivity Monitor 37: 39–71.
Ipsos (2020) “EIB Group Survey of Investment and Investment Finance”, Technical Report, October 2020.
Revoltella, D., L. Maurin and R. Pal (2020) “EU firms in the post-COVID-19 environment: Investment-debt trade-offs and the optimal sequencing of policy responses”, VoxEU.org, 23 June 2020.
Revoltella, D., D. Rückert and C. Weiss (2020) “Adoption of digital technologies by firms in Europe and the US”, VoxEU.org, 18 March 2020.
Rückert, D., R. Veugelers and C. Weiss (2020) “The growing digital divide in European and the United States”, EIB Working Paper 2020/07.
Veugelers, R. (2018). “Are European firms falling behind in the global corporate research race?”, Bruegel Policy Contribution 2018/06.
Veugelers, R., A. Ferrando, S. Lekpek and C. Weiss (2019) “Young SMEs as a motor of Europe’s innovation machine.” Intereconomics 54(6): 369–77.
1 The views expressed in this paper are those of the authors and do not necessarily reflect the views of the European Central Bank or the European Investment Bank.
2 Andrews, Criscuolo, and Gal (2016) define global frontier firms as the top 5% of firms in terms of labour productivity levels, within each two-digit sector and in each year, across all countries since the early 2000s. All other firms are defined as laggards.
3 Eligible respondents are senior persons with responsibility for investment decisions and how investments are financed. This person can be the owner, the finance manager, finance director, head of accounts, Chief Financial Officer (CFO), or Chief Executive Officer (CEO).
4 See Ipsos (2020) for a description of the sampling methodology. The sample is stratified by country, sector, and size class. Brutscher et al. (2020) provide evidence on representativeness of the data for the business population of interest (namely enterprises above five employees) by comparing distributions in EIBIS with the population of firm-level data available in Eurostat’s Structural Business Statistics (SBS).
5 The state-of-the-art digital technologies considered are different across sectors. Firms in manufacturing are asked about the use of: (a) 3D printing: also known as additive manufacturing; (b) robotics: automation via advanced robotics; (c) IoT: internet of things, such as electronic devices that communicate with each other without human assistance; (d) big data/AI: cognitive technologies, such as big data analytics and artificial intelligence. Firms in construction are surveyed about the use of: (a) 3D printing; (b) drones: unmanned aerial vehicles; (c) IoT; (d) virtual reality: augmented or virtual reality, such as presenting information integrated with real-world objects presented using a head-mounted display. Firms in services are surveyed about the use of: (a) virtual reality; (b) platforms: a platform that connects customers with businesses or customers with other customers; (c) IoT; (d) big data/AI. Firms in infrastructure are surveyed about the use of: (a) 3D printing; (b) platforms; (c) IoT; (d) big data/AI.
6 For example, Eurostat provides data on the share of enterprises (with more than ten employees) using industrial robots (17% of the enterprises in manufacturing) in the EU in 2020, which is very similar to the share of manufacturing firms that have implemented automation via advanced robotics according to EIBIS in 2020 (18%). However, there are larger differences between Eurostat data and EIBIS in the use of other digital technologies (such as 3D printing or IoT).
7 For the US, the ICT Access and Usage by Businesses Database provides data on (i) the share of business with a website or home page (in 2007 and 2012) and (ii) the share of business placing orders (i.e., making purchases) over computer networks (in 2007).
8 In 2020, the survey was conducted between May and August, several months after the outbreak of the COVID-19 pandemic.
9 The relevant survey question reads: “Do you expect the coronavirus outbreak to have a long-term impact on the increased use of digital technologies (e.g., in order to prevent business discontinuity or improve communication with customers, suppliers and employees)?”
10 The multivariate regression analysis uses the expected long-term impact of COVID-19 on digitalisation as the dependent variable and the interactions of firm size and firm age, sector, and country as explanatory variables. Marginal effects from Probit estimation show that digital firms are 11% more likely to report that they expect COVID-19 to have a long-term impact on digitalisation.
11 Marginal effects from Probit estimation, using positive employment growth as the dependent variable and the interactions of firm size and firm age, sector, and country as explanatory variables.
12 The multivariate regression analysis uses positive investment in training of employees as the dependent variable and the interactions of firm size and firm age, sector, and country as explanatory variables. Marginal effects from Probit estimation show that potential digital “frontrunners” are 16% more likely to invest in employee training than “persistently non-digital” firms.
13 The multivariate regression analysis uses active innovator as the dependent variable and the interactions of firm size and firm age, sector and country as explanatory variables. Marginal effects from Probit estimation show that potential digital “frontrunners” are 18% more likely to be active innovators than “persistently non-digital” firms.
