12. Environmental Impact Evaluation of a European High-Speed Railway Network along the “European Silk Road”
© Chapter Authors, CC BY 4.0 https://doi.org/10.11647/OBP.0280.12
Introduction
The EU aims to be climate neutral by 2050, which includes the goal of a 90% reduction in greenhouse gas emissions from transport (EC 2019). The transport sector alone accounts for around 25% of the global carbon (CO2) emissions and consumes more than half of the global demand for fossil fuels (IEA 2019). The Agenda 2030 specifically states that “more freight should be transported by rail” (EC 2019). With a study published in 2018 proposing the construction of a European Silk Road, the Vienna Institute for International Economic Studies (wiiw) proposed a contribution to achieve this envisioned shift to rail, suggesting inter alia a high-speed rail network along the envisaged routes. It would extend around 11,000 kilometres on a northern route from Lisbon to Uralsk on the Russian-Kazakh border, and on a southern route from Milan to Volgograd and Baku, also including other modes of transport and a string of logistic centres and ports. A central part is the route from Lyon to Moscow (Figure 1). The idea for a trans-European high-speed rail network is not necessarily new. Such a network was defined by the European Council Directive 96/48/EC of 23 July 1996. However, as noted in ECA (2018), a European high-speed rail network is not a reality but an ineffective patchwork of a few national lines. So far, the political will of the EU member states was lacking to build a network across national borders. However, in the current circumstances, when joint climate action gains support in all European societies, chances are increasing that consensus over cross-border high-speed railway infrastructure construction can be reached.
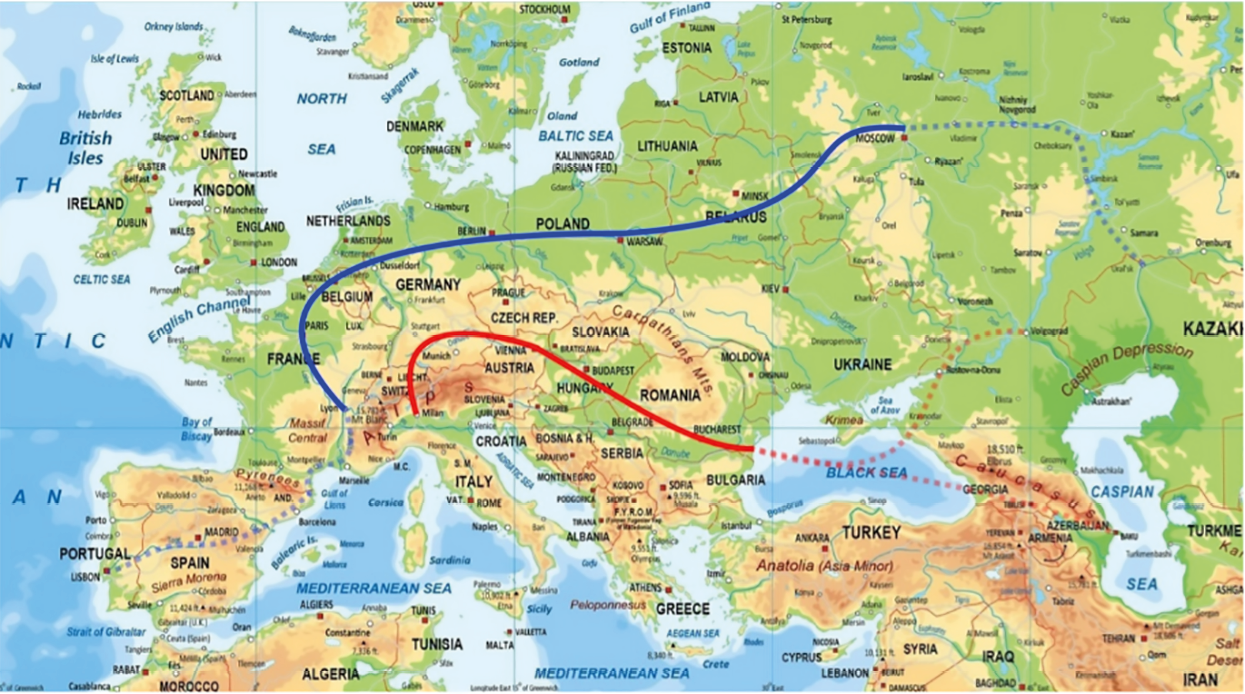
Fig. 1 European Silk Road Routes including the Proposed Trainline from Lyon to Moscow Source of data: Holzner et al. (2018).
The wiiw report sets out the economic effects and advantages of a European Silk Road. In Europe, connecting the West with the East will generate growth and employment in the short- and long-term. Conservative estimations found a potential of 3.5% economic growth on average as well as an increase of employment of around two million over an investment period of ten years, due to the construction efforts in the countries concerned (Holzner et al. 2018). Under favourable circumstances and at continued low interest rates, an employment creation of over seven million can be expected in greater Europe. Furthermore, such large-scale investments into infrastructure projects can reduce the economic disparities around various regions and have long term productivity and trade gains. They can not only remove economic divergence but also create a move towards political integration, offering a new narrative for Europe. This is specifically important in the context of inequalities that persist between Western and Eastern European countries, as well as the European disintegration process, that culminated for the time being with Brexit.
Specific extra-budgetary financing models were proposed for the European Silk Road, which was estimated to cost in total about €1 tn, or roughly 7% of the EU’s GDP (Holzner 2019). In order to conduct and finance the project, the establishment of a European Silk Road Trust owned by the euro area countries, other EU countries and third countries wishing to join the construction of the European Silk Road was suggested. The trust could rely on a public guarantee when it came to issuing long-term bonds (at currently zero or even negative real interest rates). It would formally be part of the private sector, especially as it would have sufficient income of its own from private customers (tolls).
As a strong core guarantor for the trust, the gradual development of a European Sovereign Wealth Fund by the euro area member states was suggested, following the structure of the Norwegian oil fund, for instance sourced from a part of the profits of the ECB. Other options, which would make use of existing institutions, would include, for instance, a substantial increase in the European Fund for Strategic Investments and/or a larger capital injection in the European Investment Bank (EIB), in order to finance the European Silk Road.
Recently, the proposal by the wiiw has gained significance as the idea of a European high-speed railway (HSR) network is also being considered as a mechanism for economic recovery after the COVID-19 pandemic. The Macroeconomic Policy Institute (IMK) in Düsseldorf, the Observatoire Français des Conjonctures Économiques (OFCE) in Paris and the wiiw have jointly proposed to dedicate a part of the EU’s Recovery Fund inter alia to the development of a pan-European HSR network—an Ultra-Rapid-Train connecting EU capitals (Creel et al. 2020). Apart from the economic recovery, an HSR network could also be an important step towards achieving the announced goal of reducing greenhouse-gas (GHG) emissions in the Paris Agreement and the Agenda 2030. While the economic analysis as well as the financing of the project have been studied comprehensively, the environmental effects of constructing a European Silk Road, specifically the HSR network, have not been examined, so far. This study closes the gap by conducting an environmental impact evaluation of the proposed European HSR network. Given that this is about a hypothetical railway line, the calculations must remain rough and based on the results of studies on similar existing lines. Nevertheless, the goal is to determine in various scenarios the possible range of net GHG emissions of constructing and operating an HSR network and to provide a crude estimation of how many tonnes of CO2 could be saved as compared to road and air travel, over the life cycle of sixty years. The analysis will focus only on the northern, proposed core HSR line from Lyon to Moscow, the cost of which was estimated at €200.4 bn. By comparison, this is approximately the amount that Italy receives in pandemic-related EU grants and loans from the Next Generation EU fund. However, it has to be noted that the assumptions about the unit costs were extremely conservative in the sense that the highest possible costs were assumed, i.e., for a new two-track railway line with a tunnel system. Thus, these cost estimates (and other economic estimates made in Holzner et al. (2018)) cannot be used for tying back the emission calculations. Instead, a range of potential GHG emissions based on the literature will be employed in the following exercises.
12.1 Life-Cycle Assessments—Calculating the Environmental Burden of HSR Networks
Generally, an LCA is defined as an analysis that evaluates the environmental impact of a product. In our case, this is the entire life cycle of the proposed HSR line from Lyon to Moscow. Input factors are compared and quantified and contain construction, operation, maintenance, and waste disposal in a period of sixty to one hundred years. The output is the total burden the line will impose on the environment, measured in CO2 or rather CO2-eq. (Asplan Viak 2011).
Many studies focus on the Life-Cycle Assessment (LCA) of railways but are very specific to pre-existing train line infrastructures. While these studies give good insights on how to assess the CO2 or CO2-eq. of existing infrastructures, the study at hand is conducted for a hypothetical line from Lyon to Moscow, rather than an existing project. The aim of the literature review was therefore to find reliable data as a baseline on which to build our model.
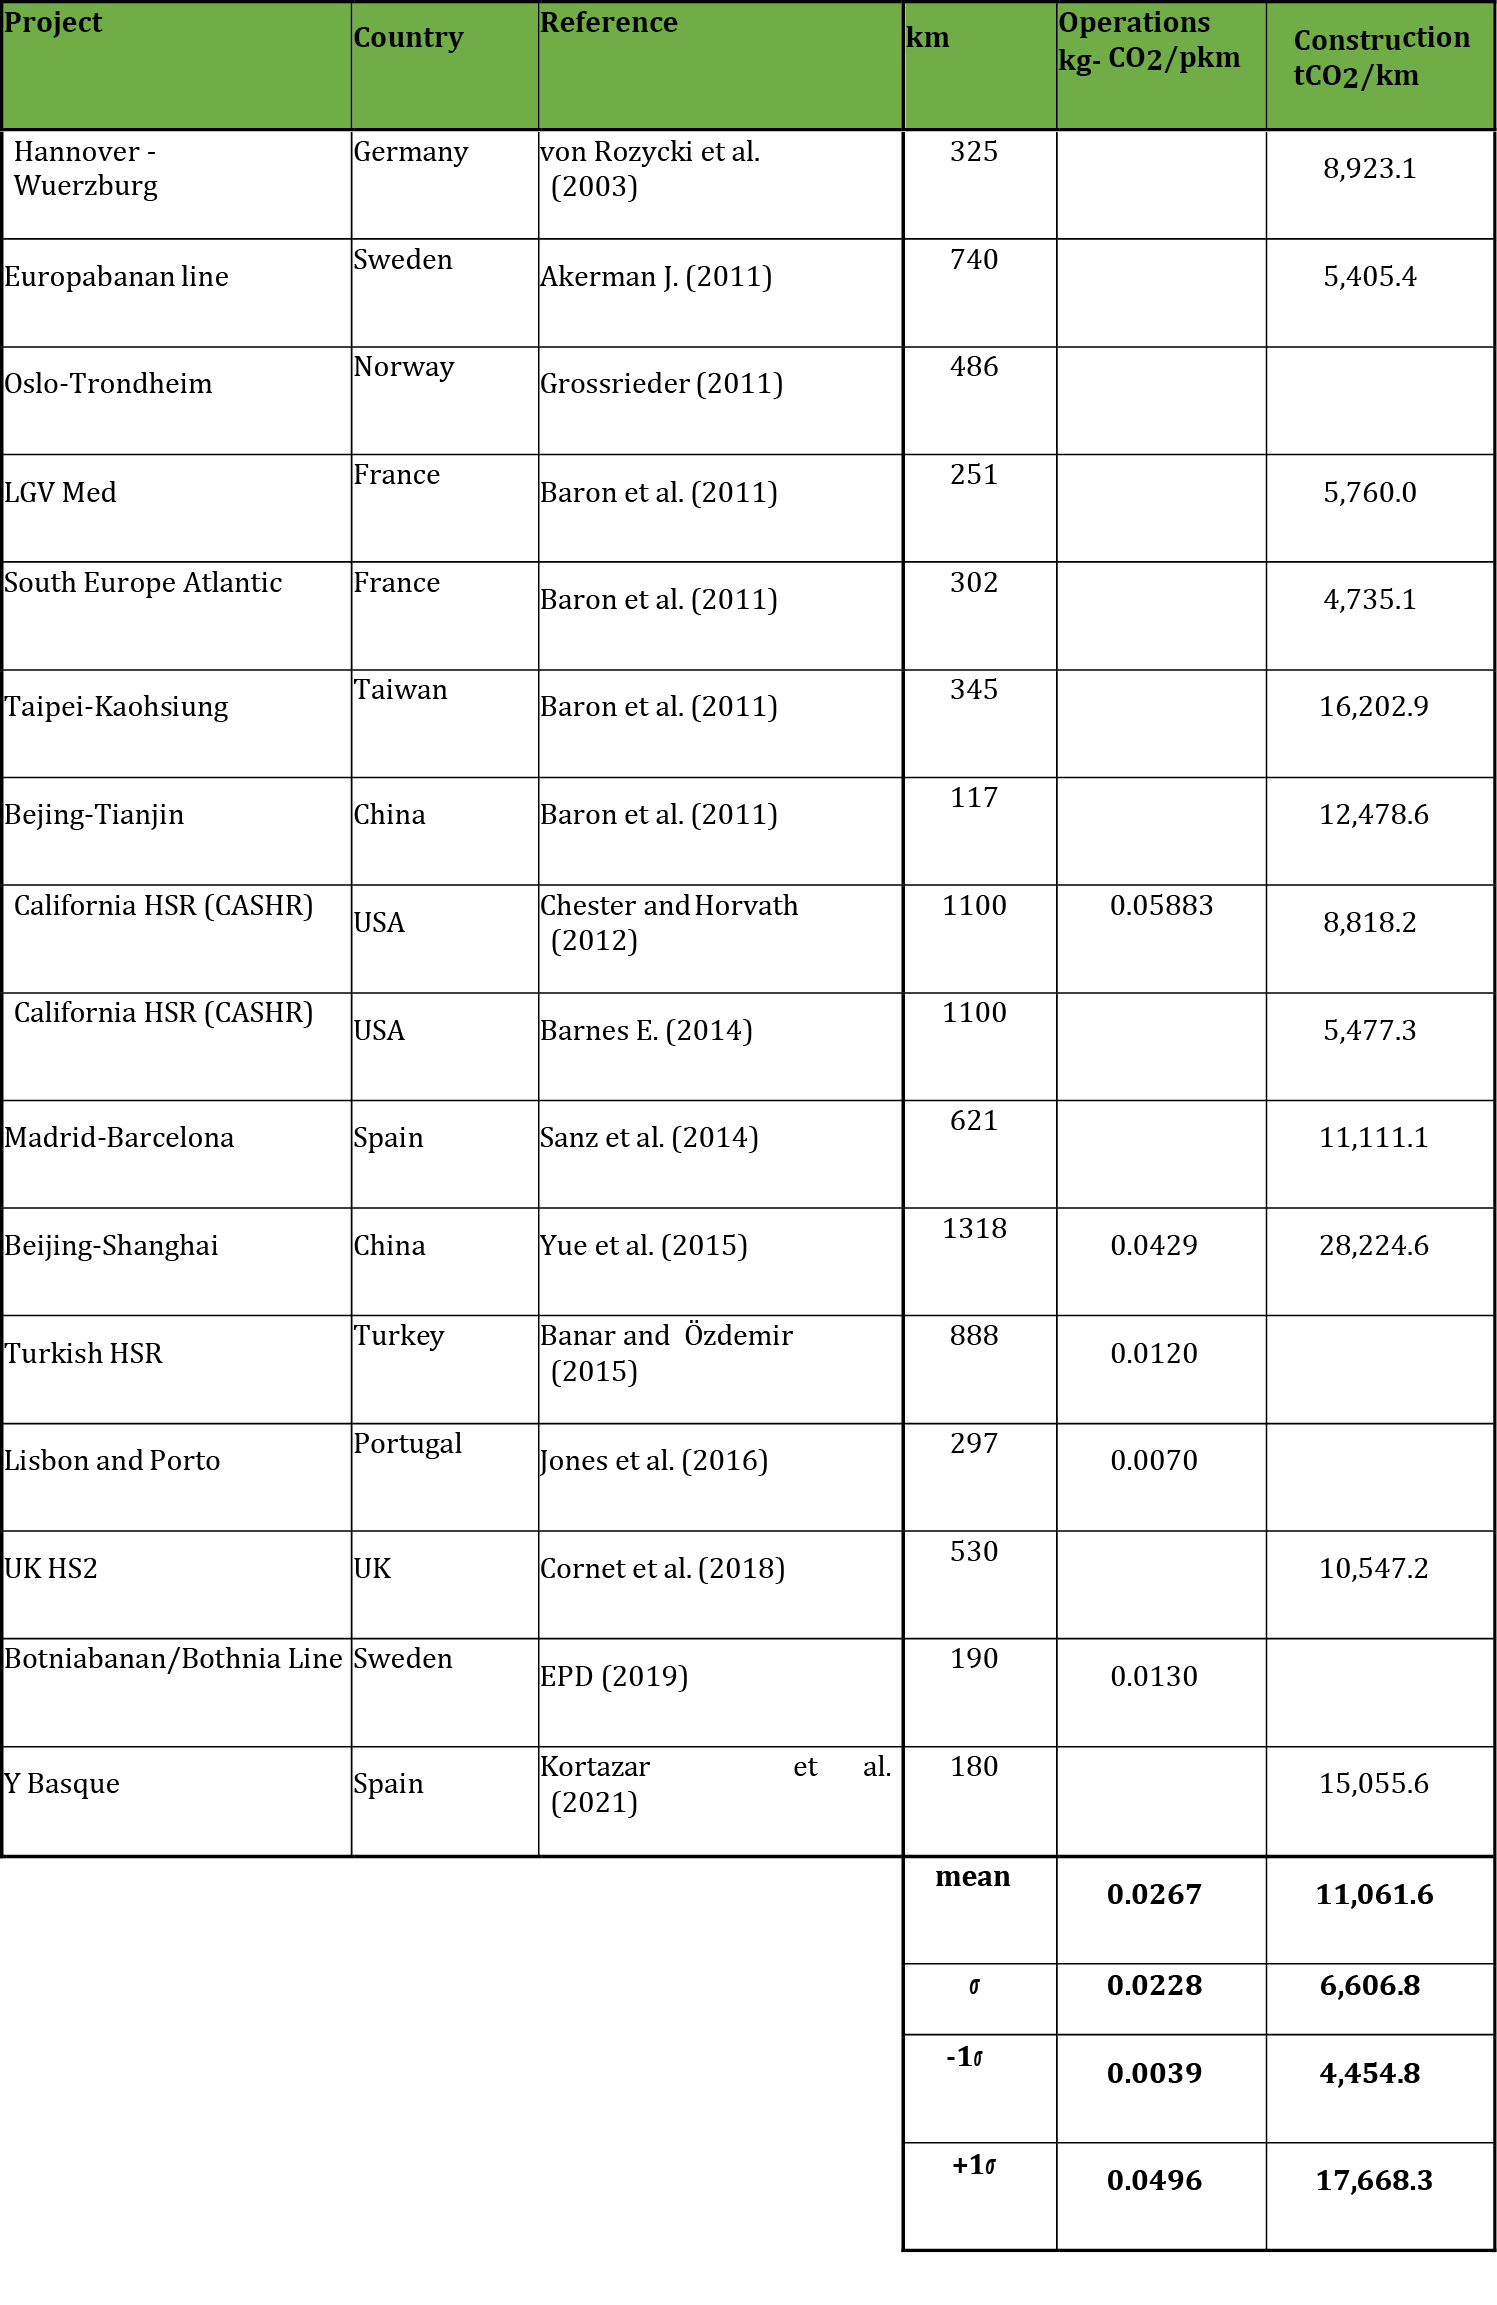
This is possible because LCAs are standardised under the International Organization for Standardization (ISO). The ISO requires adherence to certain norms, namely ISO 14040 and ISO 14044, to allow a comparison and quantification of different studies. Despite the comparability through the framework of the ISO standards, a review of the literature revealed significant differences in results. Decisive factors for the differences turned out to be mostly geographical location, including the share of bridges and tunnels, materials used for construction and various energy mixes among the different countries. To use reliable data for our calculations, we consider twelve studies to incorporate into our model (Table 1). These are mainly European studies, from Germany (von Rozycki et al. 2003), Scandinavia (Åkermann 2011; Grossrieder 2011), Portugal (Jones et al. 2016) and Spain (Kortazar et al. 2021). Outside of Europe studies from the United States (Chester and Horvath 2012) and China (Yue et al. 2015) were considered. Relying on studies covering a broad geographic area as well as different methods will ensure a balanced approach and a realistic estimation of the range between possible outcomes.
Table 1: Comparison of LCA Studies
12.2 Methodology for the Environmental Impact Evaluation
While HSR infrastructure already exists in some parts of the route and other networks would need updating, the analysis builds on the assumption that the entire route Lyon-Moscow of 3434 kilometres would need to be constructed. This implies that our results for CO2-eq. emission savings—all GHG emissions are expressed as CO2-equivalent—are per definition lower-bound estimates.
Drawing on the literature, our study has been developed based on an LCA methodology. We calculate the net CO2-eq. emissions of the proposed HSR line from Lyon to Moscow considering the phases of construction, maintenance, operation, and disposal. While the construction of new HSR infrastructure will create new CO2-eq., the environmental benefit lies in the modal shift of passengers from more polluting modes of transport such as air and road travel (Kortazar et al. 2021). Mathematically this can be represented as:

where a denotes the alternative passenger modes of transport to the HSR and the emissions are summed over sixty years, which is a common period analysed in the literature.
Simplifying the equation provides:

The following analysis takes a two-step approach according to the two parts of this equation. First, the life cycle emissions from HSR infrastructure are estimated. Second, avoided CO2-eq. emissions compared to aviation and road transport are calculated. This provides an indication on how much CO2-eq. could be saved if an HSR network was constructed.
12.2.1 Calculating Emissions from Construction
The emissions for constructing 3434 kilometres of line are estimated according to emission factors deduced from the existing life-cycle assessment studies for railway infrastructure. Hence, the emission factor includes all inputs for construction of rails, maintenance, operation and disposal of the infrastructure. Some studies also include vehicle manufacturing, maintenance, operation and disposal (Akerman 2011; Chester and Horvath 2010; Yue et al. 2015).
The CO2-eq. emissions per kilometre of constructed railway vary widely among the different studies (Figure 2). This is due to two reasons. First, as explained above, some LCA include more input factors than others. Second, the complexity of construction varies widely among different studies. Bridges and tunnels account for the highest emissions during construction (Asplan Viak 2011). As the share of bridges and tunnels ranges from under 30% to over 80%, these differences lead to emission factors ranging from 4,735 tCO2/km (Baron et al. 2011) to 28,224.6 tCO2/km (Yue et al. 2015) (Figure 2). For the trainline from Lyon to Moscow, the number of bridges and tunnels required can hardly be estimated within the scope of this study. The analysis therefore covers three models: an optimistic, a moderate, and a conservative model. The moderate approach uses the mean of the available data on railway construction emission factors. The optimistic and conservative approaches rely on values of one standard deviation from the mean, covering the upper and lower bounds of available data (Table 1).
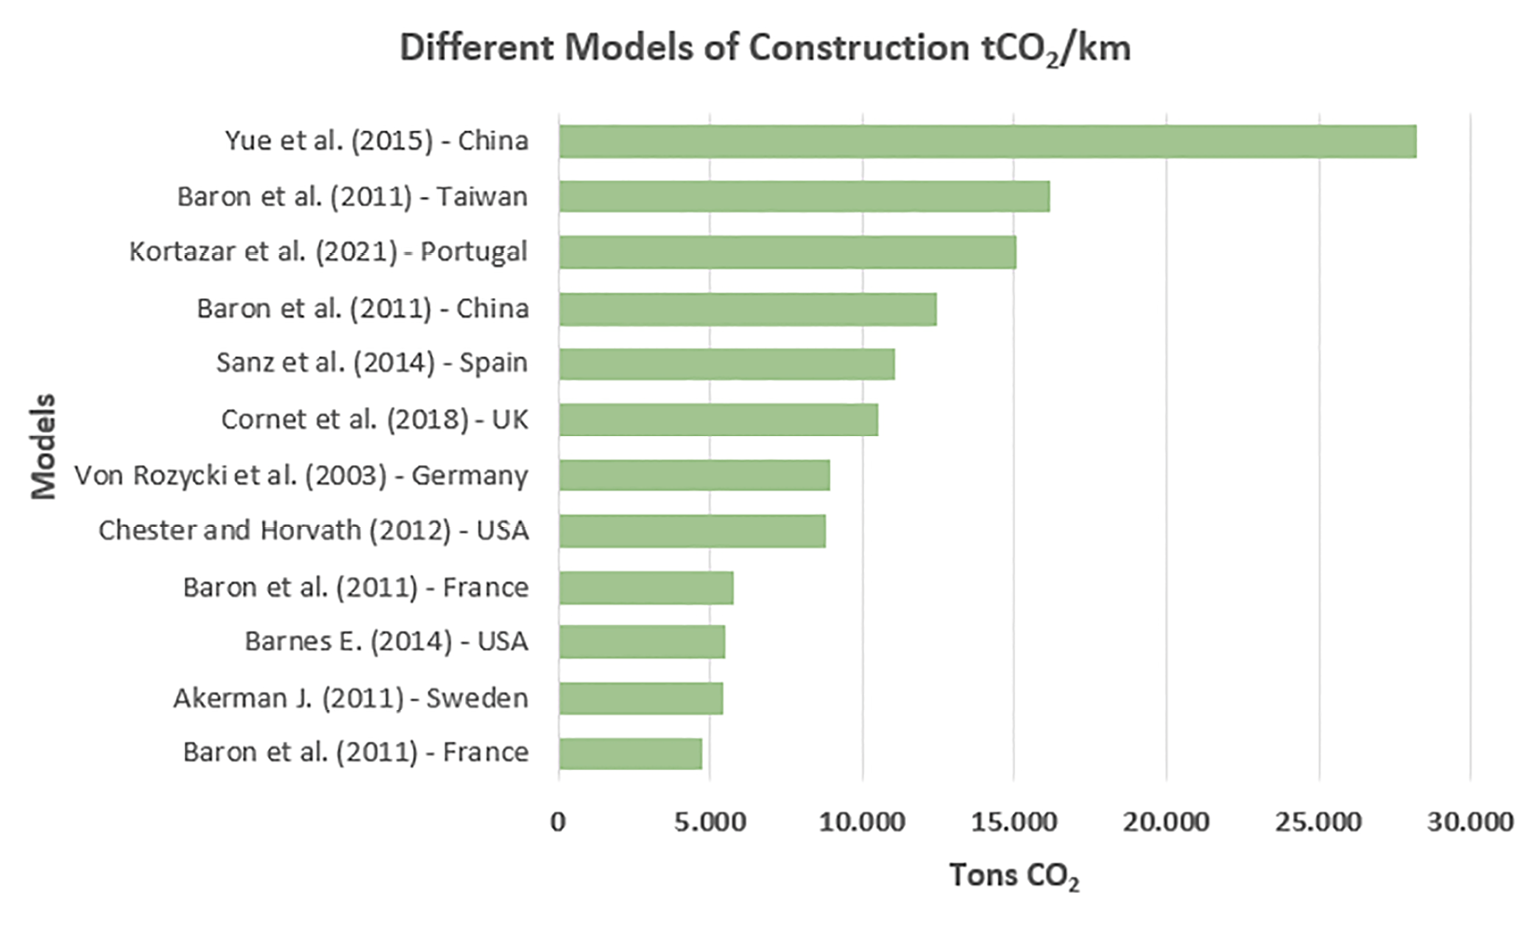
Fig. 2 Construction Emission Models.
Source of data: Bueno et al. (2017).
12.2.2 Calculating Avoided GHG Emissions
To estimate avoided CO2-eq. emissions the modal shifts from aviation to train as well as road to train are determined. This is calculated as:

The avoided CO2-eq. depends on three factors: one, the difference between the emission factors for operation of the mode of transport expressed in tonnes per passenger kilometre (pkm); two, the number of passengers shifting to train as a mode of transport; and three, the average distance travelled by passengers. Multiplying those three aspects will provide the sum of avoided GHG due to modal shifts over sixty years. Mathematically expressed this means:

12.2.3 Factor 1: Difference in Emission Factors
Emission factors for operation of the different ways of transport are relatively consistent across studies and literature. Trains have the lowest CO2 emissions per passenger kilometre with a European average emission factor of 0.027 kg CO2/pkm (Jones et al. 2016). Travelling by plane produces 4.5 times the emissions per passenger kilometre, with an emission factor of 0.126 kg CO2/pkm (Fraunhofer ISI 2020). Passenger cars travelling on the highway emit 0.132 kg CO2/pkm (Fraunhofer ISI 2020). Consequently, for every passenger shifting from aviation to train 0.099 kg CO2/pkm can be avoided and for every passenger shifting from road to train 0.105 kg CO2/pkm can be saved.
12.2.4 Factor 2: Passenger Shifts from Road and Air Travel
Estimating the expected passenger flows is one of the most important aspects of determining the environmental impact of the proposed HSR network. Only if enough passengers substitute their current mode of transport for travelling by train can the emissions from construction be offset. Estimations are based on current passenger flows of which a certain share is expected to shift.
The chosen data is based on values from the year 2019, as the COVID-19 pandemic has impacted passenger flows between countries significantly and thus data from 2020 is not representative. The number of passengers for air could be determined by passengers travelling between airports and reporting countries along the proposed route from Lyon to Moscow. In 2019, total passenger flows on this route amounted to 93.5 million (own calculations based on Eurostat 2021a; Eurostat 2021b; IATA 2019).
The number of passengers by road is estimated according to the average traffic flow on the nine core network corridors of the Trans-European Road Network (CEDR 2019). This amounts to 58,952 vehicles per day in 2019. Assuming an occupancy rate of 1.6 for cars (Fraunhofer ISI 2020) we can estimate 34.4 million passengers using the corridor from Lyon to Moscow within one year. Using these passenger flows as a baseline, an annual growth rate of 2% for aviation and a growth rate of 0.75% for road travel is assumed (Eurocontrol 2018; Alonso Raposo et al. 2019).
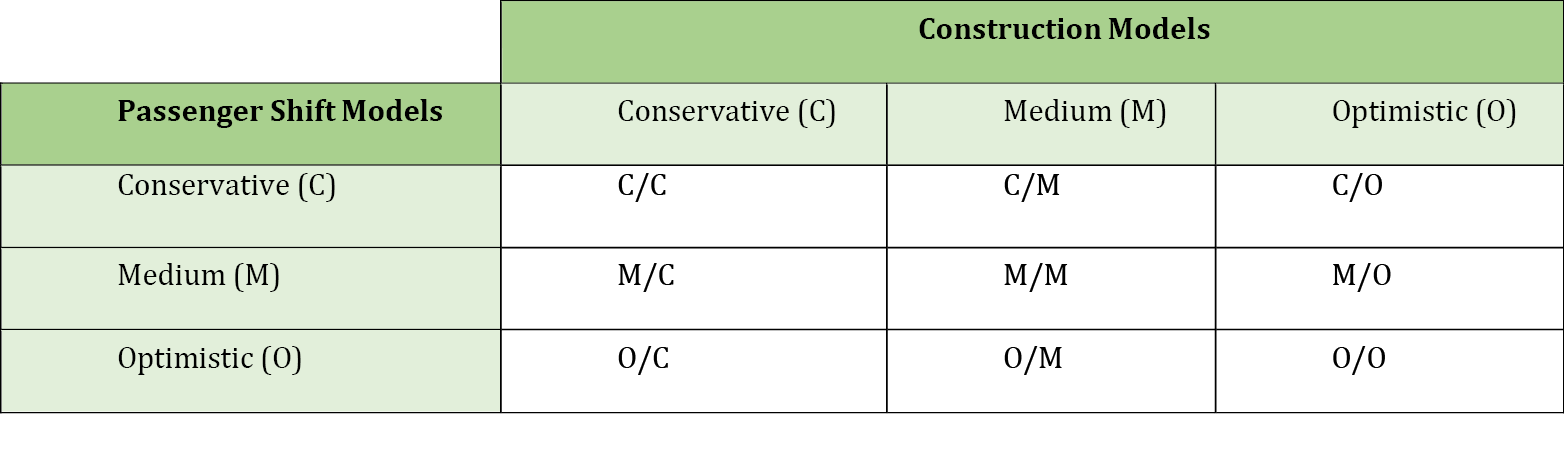
To determine a substitution rate, there are several factors that need to be considered. The main factors determining the choice of travel are price, travel time, travel time reliability, frequency of the connections and other factors such as convenience, comfort, and safety (EEA 2020b). Several studies have shown that trains can substitute aviation transport for a travel time of up to four hours (ÖBB 2021). With an average velocity of 250km/h for HSR (EIM 2008) this means that the train would be a good substitute for routes of up to 1000 km. Substitution rates range from 10% up to 90% (Steer Davies Gleave 2006) depending on the line length, and availability of other means of transport within origin and destinations, which makes it difficult to predict an accurate rate. The study therefore looks at three possible scenarios, which are based on the study on the California HSR by Chester and Horvath (2010). For air travel a shift of 25%, 50%, and 75% of passengers to railway is assumed, and for road transport a shift of 2%, 2.25%, and 2.5% of passengers is assumed. Taking the three models for construction emissions together with these three models provides nine models which are explored (Table 2).
Table 2 Conceptual Depiction of Emissions Models.
12.2.5 Factor 3: Average Distance Travelled
As the emission factors are expressed in passenger kilometres (pkm), the distance travelled also plays an important role in calculating the total emissions. As discussed above, HSR travel has a cut-off point of around 1000 km. This means it will be used as a mode of transport for medium-distance travels which ranges from 300–1000 km (Eurostat 2018). Comparing flight distances regularly used on the route confirms this assumption. Only flights to Russia significantly surpass the 1000 km mark. The model is therefore built on the median of the medium-distance-range, which is 650 km. A more thorough approach would be to look at the individual expected passenger flows for the different passages of the route from Lyon to Moscow and use the weighted mean distance. Due to limitations in available data, we chose the simplified assumption, for both aviation and road travel.
12.3 HSR Networks as a Step towards European Climate Goals
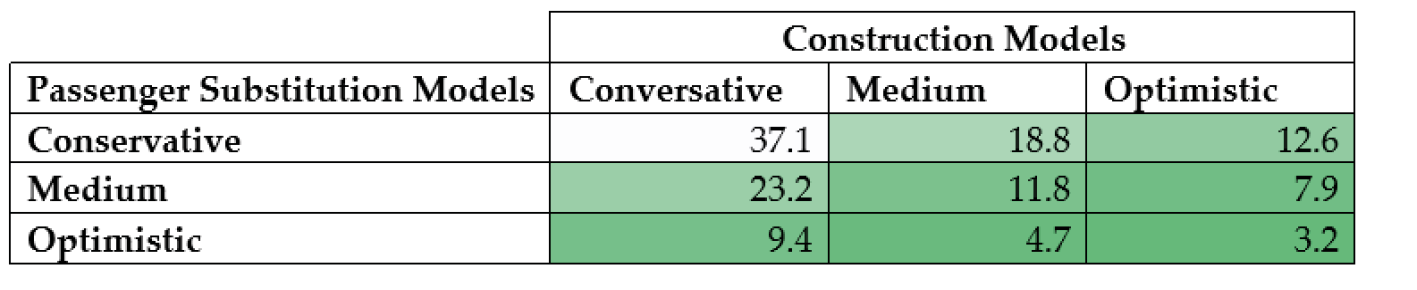
The results show that constructing an HSR network across Europe would be a step towards the goal set out by the EU for cutting emissions in the transport sector. All the explored models provide net negative CO2-eq. emissions. This indicates that more CO2-eq. emissions could be avoided by the modal shift of passengers compared to the emissions from the construction and operation of the HSR line. While the most conservative model only predicts avoidance of 37.4 million tCO2-eq., the medium model calculates 155.7 million tCO2-eq. in savings and the optimistic model implies possible savings of 273.9 million tCO2-eq. (Figure 3). Further, in the most optimistic model, emissions would be offset already after 3.2 years of operation. In the medium model the breakeven would be reached after 11.8 years of operation, while the most conservative model construction emissions will be compensated only after thirty-seven years of operation (Table 3).
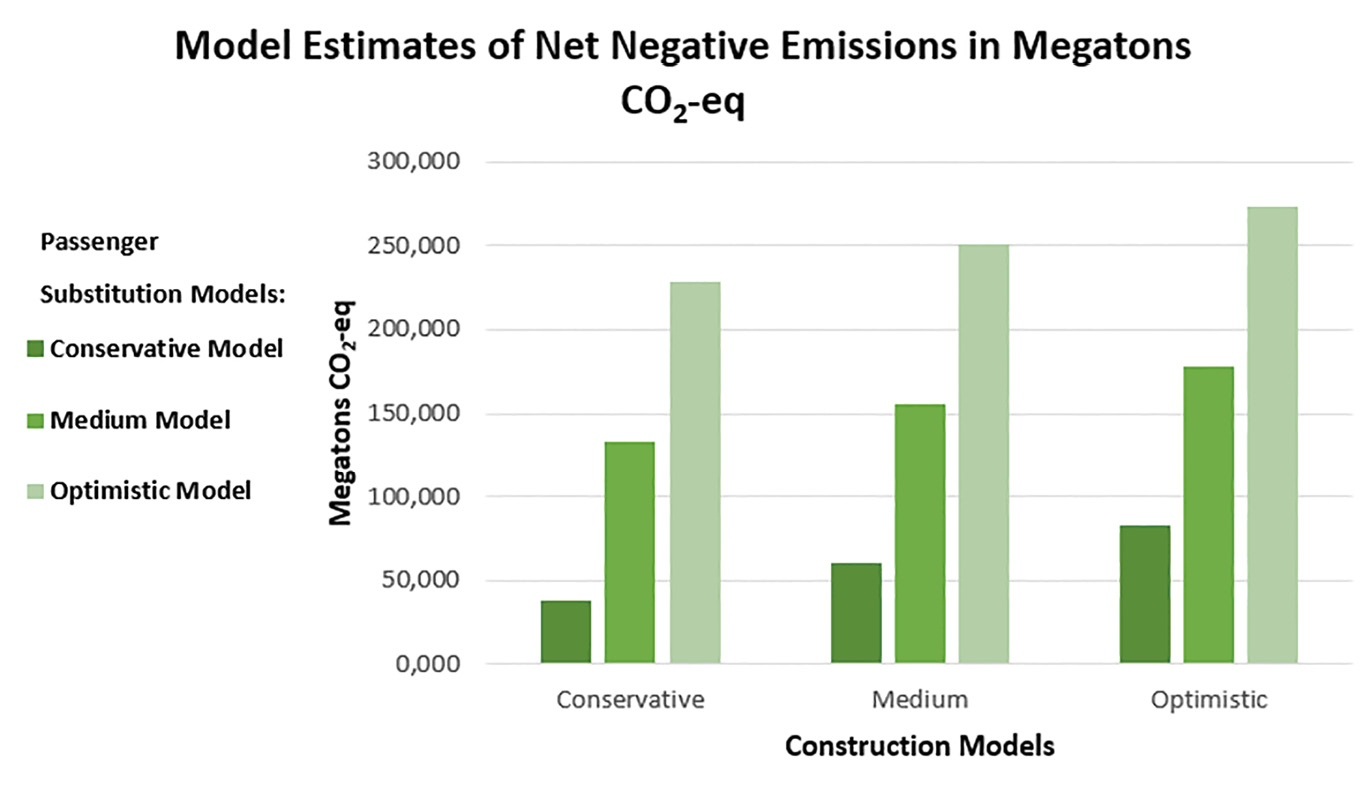
Fig. 3 Model Estimates of Net Negative Emissions
Source: own calculations (2021).
To put the results into perspective, the most optimistic model is comparable to approximately 10% of net emissions within the EU-27 in a year (EPA 2020; EEA 2020a). While this might not seem considerable, several aspects need to be taken into account. First, only passenger travel is included and avoided emissions from freight were not considered. An additional shift within the freight-transport sector will increase the environmental benefits of an HSR line. Second, the construction, maintenance, and disposal of the road and air infrastructure have not been considered, while all aspects for rail are included. This disadvantages rail compared to the other modes of transport. Third, the wiiw has shown the notable economic benefits of constructing a pan-European HSR network. The environmental benefits should thus not be evaluated independently but in addition to the economic advantages. Lastly, the examined passage of the line is only one part of the bigger network which has the potential to save further CO2-eq. emissions. Also, the costs of the Lyon-Moscow HSR, amounting to an estimated €200.4 bn euros, have to be taken into consideration.
Looking at the bandwidth of results between the nine models there is a need to discuss which model would be the most accurate. Therefore, in the following sections, the different models are examined more closely to provide an indication of which scenarios should be used as an estimate and as a basis for the impact evaluation.
Table 3 Net Negative Emissions by Model Type
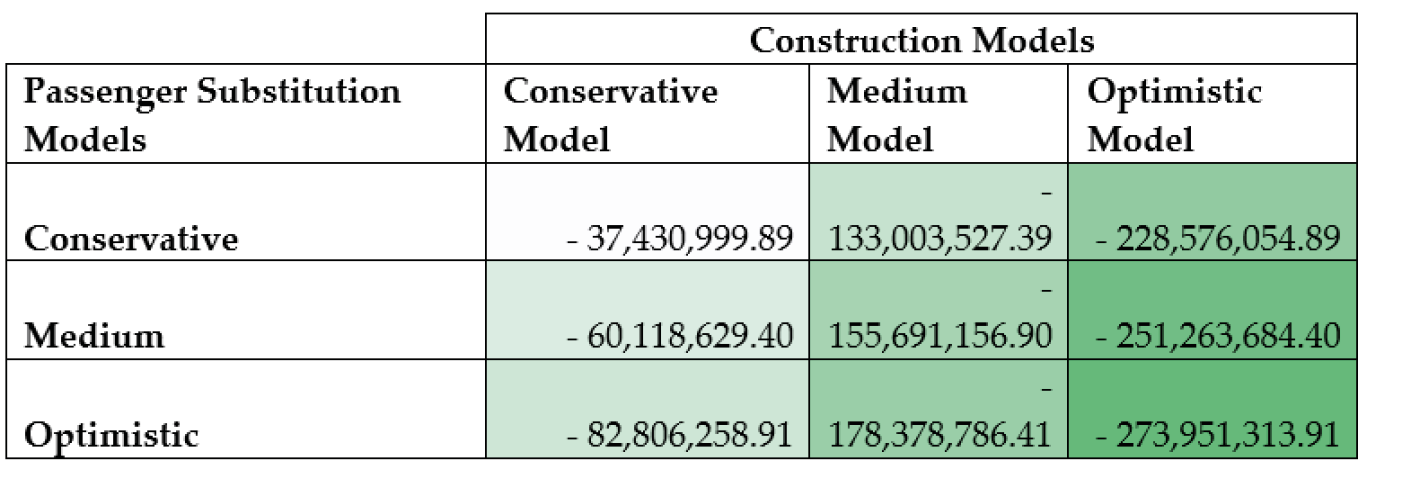
Table 4 Years to Offset Construction Emissions
12.3.1 Impact of Sustainable Construction Practices
The conservative model is based on the mean plus one standard deviation from the considered literature, with 17,668 tCO2-eq./km resulting in a total of 60.7 mil tCO2- eq. for construction (Figure 4). The higher emission factor is mostly due to differences in construction (Yue et al. 2015). Specifically, the lack of light-weight metals and the usage of fly ash in concrete, as well as an unfavourable energy mix, lead to extremely high emission factors (Yue et al. 2015; Barnes 2014). As in Europe construction practices and materials used are more sustainable and have lower emissions, an emission factor as high as assumed in the conservative model is unlikely.
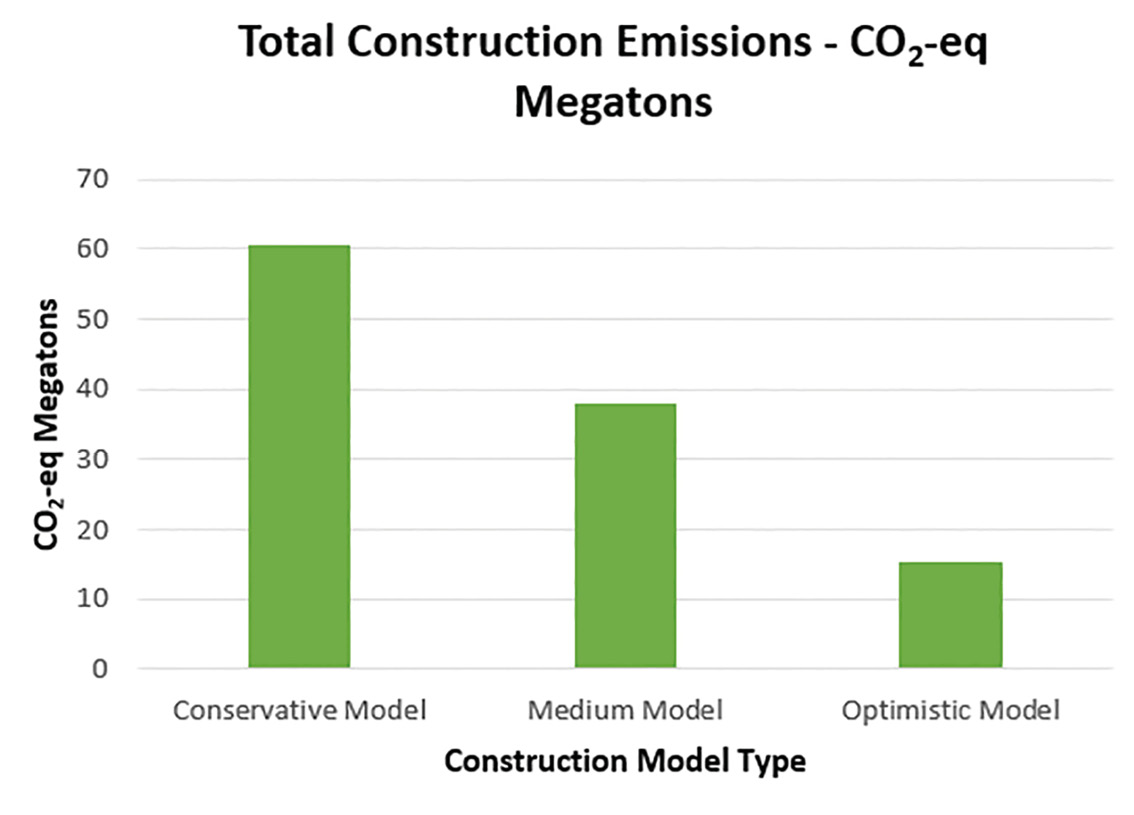
Fig 4 Construction Emissions by Model
Source: own calculations (2021).
The optimistic model, which utilises the mean minus one standard deviation of emissions found in the literature, is more plausible. France and Sweden have the lowest emissions during the life cycle of railways (UIC 2017). This is due to a less carbon-based energy mix, relatively more sustainable construction materials used and a lower share of bridges and tunnels. With an emission factor of 4,455 tCO2-eq./km the total carbon emissions for construction amounts to 15.3 million tCO2-eq (Figure 4). In comparison to the other two models this is only about 25% of the conservative model and 40% of the moderate model total emissions. Nonetheless, this could be achievable with a sustainable energy mix, sufficient numbers for passengers and freight, and sustainable construction practices, i.e., limiting or cutting out fly ash in concrete.
The medium model is based upon the average of twelve studies of tCO2-eq./km emitted during construction. The emissions factor in this model is 11,062 tCO2-eq./km and total emissions emitted from construction in this model amount to 38 million tCO2-eq. (Figure 4). This correlates with other recent projects throughout Europe. For example, Spain has the second longest HSR network in the world and several LCAs have been conducted for different parts of the infrastructure (Kortazar et al. 2021). The quality of assessment is very reliable, because of the diversity of the sample studies used.
Additionally, the coherence found within the European studies shows that the medium model is the most realistic. Nevertheless, we see potential for outcomes according to the optimistic model, if sustainable construction practices are applied and cleaner energy mixes used.
12.3.2 Potential CO2 Emissions Avoided through an HSR Network
For avoided tCO2-eq. emissions, again a conservative, medium, and optimistic scenario have been examined, based on different expected substitution rates for aviation and road. While substitution rates range as wide as 10%-90% among the literature, several factors can indicate a more accurate expected substitution rate. As mentioned, the main factors determining the choice of travel are price, travel time, travel time reliability, and frequency of the connections (EEA 2020b). Linked to those factors are the density of population and competition by low-price airlines impacting the substitution rate (Steer Davies Gleave 2006).
The route from Lyon to Moscow encompasses many corridors where according to aforementioned factors a high substitution rate can be expected. Looking at routes within the 4 hour/1000 km distance, on the proposed lines this would for example include routes such as Lyon to Brussels (730 km), Paris to Berlin (1,050 km), Berlin to Warsaw (575 km), Warsaw to Minsk (545 km) and Minsk to Moscow (713 km). Duisburg to Warsaw would also only take about 4.5 hours. The data on passenger flows show that these routes are currently mainly covered by aviation. For example, in 2019, 1.8 million passengers travelled from Brussels’ airport to Germany with an average flight distance of 383 km (Eurostat 2021a). If a reliable and fast railway system was in place, due to convenience and time of travel for such routes a substitution rate in line with the optimistic model can be expected (75%).
One factor which will constrain the substitution rates is the strong competition of low-price airlines, which cover most of the routes. From a cost perspective, it may be hard for an HSR network to compete with those airlines. However, with the emission trading system adapted by the European Union and possible further policies pushing for the reduction of GHG emissions, an increase of prices on flights can also be expected, which would benefit the substitution rates. Overall, we believe the substitution rate to lie on the upper end of the range, or in other words either the medium or the optimistic model, with substitution rates of 50% or 75%.
On the other hand, shifts from travel by car are expected to be very low. All factors such as price, reliability, and convenience of the car hinder significant shifts to train travel. On top of this, electric cars produce very low carbon emissions. This is an enticing alternative for the increasingly environmentally conscious European consumer market. For these reasons, the substitution rate can be estimated at only around 2–3% (Chester and Horvath 2010). The model does not depend on whether a 2%, 2.25%, or 2.5% substitution rate for cars is used. Therefore, for road travel it does not matter greatly whether the conservative, medium or optimistic model is chosen.
In conclusion, the medium-medium or medium-optimistic models seem to be the most likely (Table 2). This would result in total savings of emissions equivalent to the net tCO2-eq. of the Netherlands (M/M) or Poland (M/O) for a year (EEA 2020a).
12.4 Limitations
Our study faces three major limitations. First, estimating outcomes over the next sixty years provides uncertainties, which could not be accounted for. Assumptions include a steady growth rate as well as a continuous substitution rate. Assuming the same substitution rate for sixty years may overestimate passenger flows. On the other hand, a relatively low growth rate was chosen to account for this aspect.
Second, it could not be considered that the continuous improvement of other modes of transport will reduce emissions as technology advances. Electrical cars are expected to cut emissions from road travel significantly in the future. Current targets set by the EU and member states regarding private car emission requirements aim at eliminating combustion engines within the next ten to fifteen years (Wappelhorst 2020). Similarly, airplane fuel efficiency has been increasing and is expected to reduce the emission factor for aviation (EESI 2019). However, it can be expected that the emissions by train will also reduce as the energy mix within the different EU countries moves towards renewable energies. Nevertheless, the shift to electric cars barely changes the results of our model.
Third, GHG savings from freight transport are not explicitly included in this study as their quantification would need further research. Qualitatively, though, we see strong grounds to expect a positive impact on emissions if freight transport shifts to rail are incorporated. A recent study by the European Environment Agency (EEA 2021) found that transport of freight via rail emits 43 times less CO2 than transport via air. More specifically, a study by Bueno et al. (2017) on evaluating the environmental performance of a high-speed rail project in the Basque Country in Spain demonstrated that net CO2 emissions improve by a factor of 1.3–2.1, depending on the model, when including freight in the calculations. Although the authors came to the conclusion that the Basque Y Line they studied will not reach a net negative CO2-balance, with emissions dropping from 1.92 MtCO2 net emissions if only passenger transport is considered to up to 0.9 MtCO2 net emissions when including both passenger and freight transport. For our study, this is suggestive that the projected CO2 savings could potentially double, when including freight into the calculations.
12.5 Conclusion
In conclusion, we could show that a construction of an HSR line between Lyon and Moscow along the “European Silk Road” provides not only economic advantages, as examined by Holzner et al. (2018), but also presents potential for a positive environmental impact. Based on calculations in the related literature, it could be determined that the most optimistic model projects an emissions avoidance equivalent to 10% net emissions of the EU-27 for a year for passenger transport alone. The bulk of the avoidance comes from an assumed reduction in air travel. The emissions from construction would be offset after eight to twelve years of operation, relying on the medium-medium and medium-optimistic models. Considering that freight transport was not incorporated in the calculations, the potential is in fact higher than portrayed by this study. Existing studies suggest that projected CO2 savings could potentially double, when including freight in the calculations. We argue that the construction and operation of an HSR could significantly reduce passenger flows from aviation, contributing to the EU’s goal to reduce emissions from aviation by at least 10% (EC 2019). While the idea, let alone the construction, of an HSR network seems radical, it certainly can have an extensive impact not only on the further economic integration of Europe but also contribute to a greener, more sustainable, more innovative and technologically advanced future. The estimated costs of the European Silk Road HSR line between Lyon and Moscow of more than €200 bn are substantial. However, as a share of 2020 EU GDP, this makes up only 1.5%. Considering that the investment would likely be spread out over at least a decade, the amount involved appears modest from a European perspective. Also, this has to be seen against the backdrop of the recent signals by the European Commission’s President, Ursula von der Leyen, in her 2021 State of the Union Address, announcing the presentation of a new connectivity strategy called Global Gateway, with investments in quality infrastructure, connecting goods, people, and services around the world.
References
Åkerman, J. (2011) “The role of high-speed rail in mitigating climate change—The Swedish case Europabanan from a life cycle perspective”, Transportation Research Part D: Transport and Environment 16(3): 208–17, https://doi.org/10.1016/j.trd.2010.12.004.
Alonso Raposo, M. and B. Ciuffo (eds) (2019) The future of road transport―Implications of automated, connected, low-carbon and shared mobility (Luxembourg: Publications Office of the European Union), https://doi.org/10.2760/668964.
Asplan Viak (2011) New Double Track Line Oslo—Ski Life Cycle Assessment of the Follo Line—Infrastructure (UOS-00-A-36100), Jernbaneverket.
Banar, M. and A. Özdemir (2015) “An evaluation of railway passenger transport in Turkey using life cycle assessment and life cycle cost methods”, Transportation Research Part D: Transport and Environment 41: 88–105, https://doi.org/10.1016/j.trd.2015.09.017.
Barnes, E. (2014) California High Speed Resilience to Climate Change, https://repository.asu.edu/items/25239.
Baron, T., G. Martinetti and D. Pepion (2011) Carbon Footprint of High-Speed Rail, International Union of Railways, https://railroads.dot.gov/sites/fra.dot.gov/files/fra_net/15009/Carbon%20Foot print%20of%20High-Speed%20Rail%20UIC%202011.pdf.
Bueno, G., D. Hoyos and I. Capellán-Pérez (2017) “Evaluating the environmental performance of the high speed rail project in the Basque Country, Spain”, Research in Transportation Economics 62: 44–56, https://doi.org/10.1016/j.retrec.2017.02.004.
CEDR (2019) Trans-European Road Network, TEN-T (Roads): 2019 Performance Report (October 2020), CEDR Working Group 3.5 Performance, https://www.cedr.eu/download/Publications/2020/CEDR-Technical-Report-2020-01-TEN-T-2019-Performance-Report.pdf.
Chester, M. and A. Horvath (2010) “Life-cycle assessment of high-speed rail: The case of California”, Environmental Research Letters 5(1): 014003, https://doi.org/10.1088/1748-9326/5/1/014003.
Chester, M. and A. Horvath (2012) “High-speed rail with emerging automobiles and aircraft can reduce environmental impacts in California’s future”, Environmental Research Letters 7(3): 034012, https://doi.org/10.1088/1748-9326/7/3/034012.
Cornet, Y., G. Dudley and D. Banister (2018) “High speed rail: Implications for carbon emissions and biodiversity”, Case Studies on Transport Policy 6(3): 376–90, https://doi.org/10.1016/j.cstp.2017.08.007.
Creel, J., M. Holzner, F. Saraceno, A. Watt and J. Wittwer (2020) How to spend it: A proposal for a European Covid-19 recovery programme, wiiw Policy Note/Policy Report, No. 38, https://wiiw.ac.at/publications-all-all-all-all-10-year-desc-0-how+to+spend+it.html.
EC (2019) Sustainable Mobility—The European Green Deal, European Commission, https://ec.europa.eu/commission/presscorner/detail/en/fs_19_6726.
ECA (2018) A European high-speed rail network: not a reality but an ineffective patchwork, European Court of Auditors, Special Report, No. 19.
EEA (2020a) Approximated estimates for greenhouse gas emissions, European Environment Agency, https://www.eea.europa.eu/data-and-maps/data/approximated-estimates-for-green house-gas-emissions-2.
EEA (2020b) Transport and environment report 2020―Train or plane? (19/2020), European Environment Agency, https://www.eea.europa.eu/publications/transport-and-environ ment-report-2020.
EEA (2021) Rail and waterborne—best for low-carbon motorised transport, European Environment Agency Briefing, No. 01/2021, https://www.eea.europa.eu/publications/rail-and-waterborne-transport.
EIM (2008) European Railway Technical Strategy (Version 1.2), European Rail Infrastructure Managers, https://ec.europa.eu/transport/sites/transport/files/themes/strategies/consul tations/doc/2009_03_27_future_of_transport/20090305_eim.pdf.
Environmental and Energy Study Institute (EESI) (2019) Fact sheet: The growth in greenhouse gas emissions from commercial aviation, Environmental and Energy Study Institute Ideas, Insights, Sustainable Solutions, https://www.eesi.org/papers/view/fact-sheet-the-growth-in-greenhouse-gas- emissions-from-commercial-aviation.
EPA (2020) Greenhouse gas equivalencies calculator, US EPA, https://www.epa.gov/energy/greenhouse-gas-equivalencies-calculator.
EPD (International EPD Consortium) (2019) Environmental Product Declaration for passenger transport on the Bothnia Line (Reg. no. S-P-00194), Botniabanan AB, https://portal.environdec.com/api/api/v1/EPDLibrary/Files/3fa98013-e848-4dbc-ae38-ae496671833a/Data.
Eurocontrol (2018) European Aviation in 2040, European Organisation for the Safety of Air Navigation, https://www.eurocontrol.int/sites/default/files/2019-07/challenges-of-growth-2018-annex1_0.pdf.
Eurostat (2018) EU Transport Statistics―Eurostat guidelines on Passenger Mobility Statistics (December 2018), https://ec.europa.eu/eurostat/documents/29567/3217334/Guidelines_on_Passenger_Mobility_Statistics+%282018_edition%29.pdf/f15955e3-d7b4-353b-7530-34c6c94d2ec1?t=1611654879518.
Eurostat (2021a) Air passenger transport between main airports in each reporting country and partner reporting countries, Eurostat Data Browser, https://ec.europa.eu/eurostat/databrowser/view/avia_paoac/default/table?lang=en.
Eurostat (2021b) Air passenger transport between reporting countries, Eurostat Data Browser, https://ec.europa.eu/eurostat/databrowser/view/avia_paocc/default/table?lang=en.
Fraunhofer ISI (2020, March 24) Methodology for GHG Efficiency of Transport Modes (Final Report), https://www.eea.europa.eu/publications/rail-and-waterborne-transport/rail-and-waterborne-best/d3b-eea-ghg-efficiency-indicators/view.
Grossrieder, C. (2011) Life-cycle assessment of future high-speed rail in Norway, Norwegian University of Science and Technology.
Holzner, M., P. Heimberger and A. Kochnev (2018) A ‘European Silk Road’, wiiw Research Report, No. 430, https://wiiw.ac.at/a-european-silk-road-dlp- 4608.pdf.
Holzner, M. (2019) One Trillion Euros for Europe. How to finance a European Silk Road with the help of a European Silk Road Trust, backed by a European Sovereign Wealth Fund and other financing instruments, wiiw Policy Note/Policy Report, No. 35, https://wiiw.ac.at/one-trillion-euros-for-europe-how-to-finance-a-european-silk-road-with-the-help-of-a-european-silk-road-trust-backed-by-a-european-sovereign-wealth-fund-and-other-financing-instruments-p-5106.html.
IATA (2019) The Importance of Air Transport to The Russian Federation, Russian Federation, https://www.iata.org/en/iata-repository/publications/economic-reports/russian-federation--value-of-aviation/.
IEA (2019) Transport—Topics, https://www.iea.org/topics/transport.
Jones, H., F. Moura and T. Domingos (2016) ”Life cycle assessment of high-speed rail: A case study in Portugal”, The International Journal of Life Cycle Assessment 22(3): 410–22, https://doi.org/10.1007/s11367-016-1177-7.
Kortazar, A., G. Bueno and D. Hoyos (2021) “Environmental balance of the high speed rail network in Spain: A life cycle assessment approach”, Research in Transportation Economics 36(101035), 107006, https://doi.org/10.1016/j.retrec.2021.101035.
ÖBB Austrian Federal Railway (2021, January 21) Personal communication, Online interview.
Von Rozycki, C. V., H. Koeser and H. Schwarz (2003) “Ecology profile of the German high-speed rail passenger transport system, ICE”, The International Journal of Life Cycle Assessment 8(2): 83–91, https://doi.org/10.1007/bf02978431.
Russian Federal Agency for Air transport and Aviation (2021) Ob’emy perevozok cherez aeroporty Rossii, Russian Federal Agency for Air transport and Aviation, https://favt.gov.ru/dejatelnost-ajeroporty-i-ajerodromy-osnovnie-proizvodstvennie-pokazateli-aeroportov-obyom-perevoz/.
Sanz, A., P. Vega and M. Mateos (2014) Las cuentas ecológicas del transporte en España, https://www.gea21.com/archivo/cuentas-ecologicas-del-transporte- en-espana.
Steer Davies Gleave (2006) Air and Rail Competition and Complementarity, https://ec.europa.eu/transport/modes/air/studies/internal_market_en.
UIC (2017) Railway Handbook 2017, International Union of Railways, https://uic.org/IMG/pdf/handbook_iea-uic_2017_web3.pdf.
Wappelhorst, S. (2020) The end of the road? An overview of combustion engine car phase- out announcements across Europe, International Council on Clean Transportation, https://theicct.org/sites/default/files/publications/Combustion-engine-phase-out-briefing-may11.2020.pdf.
Yue, Y., T. Wang, S. Liang, J. Yang, P. Hou, S. Qu,J. Zhou, X. Jia, H. Wang and M. Xu (2015) “Life cycle assessment of High-Speed Rail in China”, Transportation Research Part D: Transport and Environment 41: 367–76, https://doi.org/10.1016/j.trd.2015.10.005.