
13. Cohesion Policy and Public Investment in the EU
© Giuseppe Coco and Raffaele Lagravinese, CC BY 4.0 https://doi.org/10.11647/OBP.0280.13
Introduction
The Cohesion Policy is certainly the most important policy area for the EU budget. Over the decades it has also progressively grown in size and relevance. The founding fathers’ acute awareness of the centripetal forces that the Union would determine in the economic sphere, and consequently of the need for a policy to counteract the potential polarisation between central, high-growth regions and peripheral, lagging areas, determined the adoption of an EU-wide policy for territorial cohesion. The main funds of the policy are regional in nature, although nothing precludes their use in a coordinated manner at the national level. As such, the ERDF is the development policy fund, and the ESF, the social pillar fund. From 2007 on, due to the accession of new member states with lower per capita incomes, some resources have been allocated to a “national” fund, the Cohesion Fund (CF). This fund has mostly been used for infrastructure development in the new MS (as well, since 2013, as in some of the old MS whose per capita average income slipped below the 90% EU average threshold).
Discussing the relevance of the Cohesion Policy for investment in the EU is a difficult task as expenditure on EU programming is not categorised according to the current nature of its investment. A report (Prota et al. 2020) on last year’s outlook mainly discussed the history of cohesion policy. It adopted a simple accounting view in reporting its size (only ERDF and CF) relative to the total public investment in each member state (a measure provided by Eurostat) and some ad hoc measures of investments financed by cohesion policy in specific fields like transport or energy. This idea is based on the implicit view that ERDF and CF are development policy funds, and therefore the whole expenditure on them can be attributed to investment. This view has also been used in the past to advocate in favour of cohesion policy as a tool for reducing the damage from decreasing capital expenditure in some countries. Brasili et al. (2021) in this handbook show clearly that most, if not all, of fiscal consolidation comes in the form of reduced capital expenditure and that this was particularly the case for Southern European member states of the EU during and after the Great Recession. The argument is that cohesion policy could have slowed this trend, although there is little evidence of that happening.
While the idea that much of the cohesion expenditure is capital is generally correct for many items, still the fact that some expenditure items refer for example to social infrastructure or better employment leaves many doubts about its integral use for this aim. This may also explain why in some countries the ratio of cohesion “development” expenditure to total public capital expenditure is extremely high (even unreasonably high).1
Cohesion policy probably contributes positively to public investment, but there are at least two open issues in using the total cohesion expenditure over public capital expenditure as a measure of its contribution. On the one hand, not all cohesion expenditure is an investment as it is stated to be, and therefore the ratio mentioned above is not normalised across countries to 100, as the numerator is not a part of the denominator. This makes it important to have a better measure of cohesion policy’s real contribution to public investment expenditure. Our approach will consider the different “themes” in the EU budget (expenditure categorisation) to isolate the items that are, with a high probability, associated with capital expenditure, at least under a proper statistical definition.
However, this brings to the fore the issue of the correct definition of investment expenditure. The current statistical definition includes traditional items of physical capital and some items of intangible capital, notably R&D expenditure. Infrastructure expenditure and R&D expenditure, therefore, are certainly part of any capital definition. Also, most transfers to firms are probably finalised as investment and therefore can be accounted as capital account transfer (gross fixed capital formation).
On the other hand, a growing body of literature claims that a rising and increasingly unstable share of investment takes forms that were in the past less important and are more difficult to account for. Intangibles are becoming ever more relevant for defining the amount of capital embedded in a firm, for example (Haskel and Westlake 2018). The clearest way to understand this argument is to ask the value of the capital of firms like Microsoft or Google. The enormous divergence between an accounting measure of capital invested and the market value of these firms can be partly explained by their dominant positions. But, according to a stream of literature, this divergence is also down to the intangible (and therefore more difficult to evaluate) nature of the investment. According to this view, the value of a firm is equivalent to the value of the human capital working in it, and the network of relationships embedded in its organisation. In other terms value stems mostly from these forms of capital, rather than from traditional tangible items.
It can also be argued that a growing share of public capital is intangible, and therefore the traditional, narrow definition of capital can be misleading, particularly if we are examining a policy aimed at stimulating development in underdeveloped regions. It can be safely assumed for example that a large share of expenditure in education increases human capital and therefore should be accounted for as an investment. We will account for it separately. By the same token, we could claim that some types of social expenditure increase social capital and therefore constitute investments in an even broader sense. This would lead, however, to the view that all cohesion expenditure—and, in a more extreme view, also all of the public expenditure—is, one way or another, a form of capital expenditure. This would make the whole exercise of evaluating public capital expenditure, and specifically the cohesion policy contribution, meaningless. So we will adopt a more reasonable approach.
Based on this approach we will compare capital expenditure (traditional and human) in the wider context of cohesion policy and its share over time in different countries. In our opinion, this exercise may also shed some light on the recent literature on the effects of cohesion policy on growth. Several papers claim that the effects of cohesion policy are highly differentiated across countries and regions, not only in their overall effects on growth but also in the type of effects observed (see, for example, Crescenzi and Giua 2020; Fratesi and Perucca 2020). As suggested by Berkovitz et al. (2020) in a study about Greece, the key for understanding the differences may be to look at the composition of the expenditure.
The second interesting question we will tackle is whether cohesion policy actually increases capital expenditure in MS or whether it just substitutes national capital expenditure. Some investigations in member states have questioned the additionality of the public investment component of cohesion policy (for a recent example, see Psycharis et al. 2020, for Greece). In general, one would expect that if cohesion policy were able to increase capital expenditure then one should observe some correlation between its intensity at a regional level and public capital expenditure. But much of the anectodal evidence does not confirm this view (see also in this volume, Barbieri and Cerniglia 2021, for the Italian case). To investigate this question directly we should ideally compare public investment at a regional level, but unfortunately, Eurostat does not collect such data. We will therefore look in particular at the regions receiving the largest contributions from cohesion policy. For these regions, we will compare the total gross fixed capital formation (GFCF) normalised by regional GDP to the national value of the same ratio. This comparison will give us information about the effectiveness of the EU cohesion policy in increasing investment (public and private) at the regional level and, indirectly, will also give us a clue on the additionality of public investment in different countries. Unfortunately, Eurostat does not provide a measure of public capital formation at the regional level, but gross fixed capital formation provides an interesting clue, in particular if one subscribes to the hypothesis of crowding in of public investments, convincingly put forward also in this volume by Durand et al. (2021).
A purely additional cohesion policy expenditure would increase capital formation in regions that receive more transfers relative to the national average. Of course, we expect some substitution effect, but the extent of this substitution is important information as it offers important clues on whether the policy really increases capital expenditure in the member states, and therefore if a European cohesion policy is really useful (at least for investment).
13.1 Disentangling Capital Expenditure from Other Cohesion Items
It is a generally held view that the EU cohesion policy increases capital expenditure. However, the claim is usually assumed away based on the view that most, or all, of the cohesion expenditure particularly in the “development” funds (notably the ERDF and the Cohesion Fund) are allocated to capital expenditure, while the ESF is allocated to current social expenditure. This is not necessarily the case, as we will see. National accounts (and the EU database on cohesion) do not provide a statistical measure of the amount of funds allocated to capital expenditure, and therefore only an indirect estimate is possible. An estimate of cohesion contribution to investment would be valuable for estimating the share of cohesion resources that generate investment. Even more importantly, we could identify which countries allocate a comparatively larger share of funds to capital expenditure. This information could be tentatively used to investigate the effects of the composition of expenditure on the success of cohesion policy in different countries and, ultimately, its effects on growth.
To allocate cohesion expenditure to current and capital expenditure, we will consider the items (“themes”) identified in the Cohesion Policy Framework Budget for the period 2014–20 and isolate the items that are directly linked to capital formation in the statistical definition of fixed capital and R&D. We group these items in a High Content of Capital Expenditure (HCC) bundle and then calculate its share in each country. We then identify an intermediate content of capital expenditure (ICC) group of items, mostly linked to the Green Deal and Transition, that is likely linked to energy infrastructure and capacity, sustainable mobility, and therefore at least partially capital expenditure. The residual type of expenditure (low capital content) is generally social infrastructure expenditure. Within this group of items, special attention will be devoted to expenditure in “Education and vocational training”. As discussed in the introduction, this item is linked to human capital formation and therefore can be considered a capital expenditure in a broader sense. It is useful to analyse its distribution in the context of capital formation. Table 1 shows the themes of the cohesion policy expenditure and their grouping in the above-named categories.
Table 1 European Structural and Investment Funds by Theme (2014–2020) (in billion euros, Current Prices)
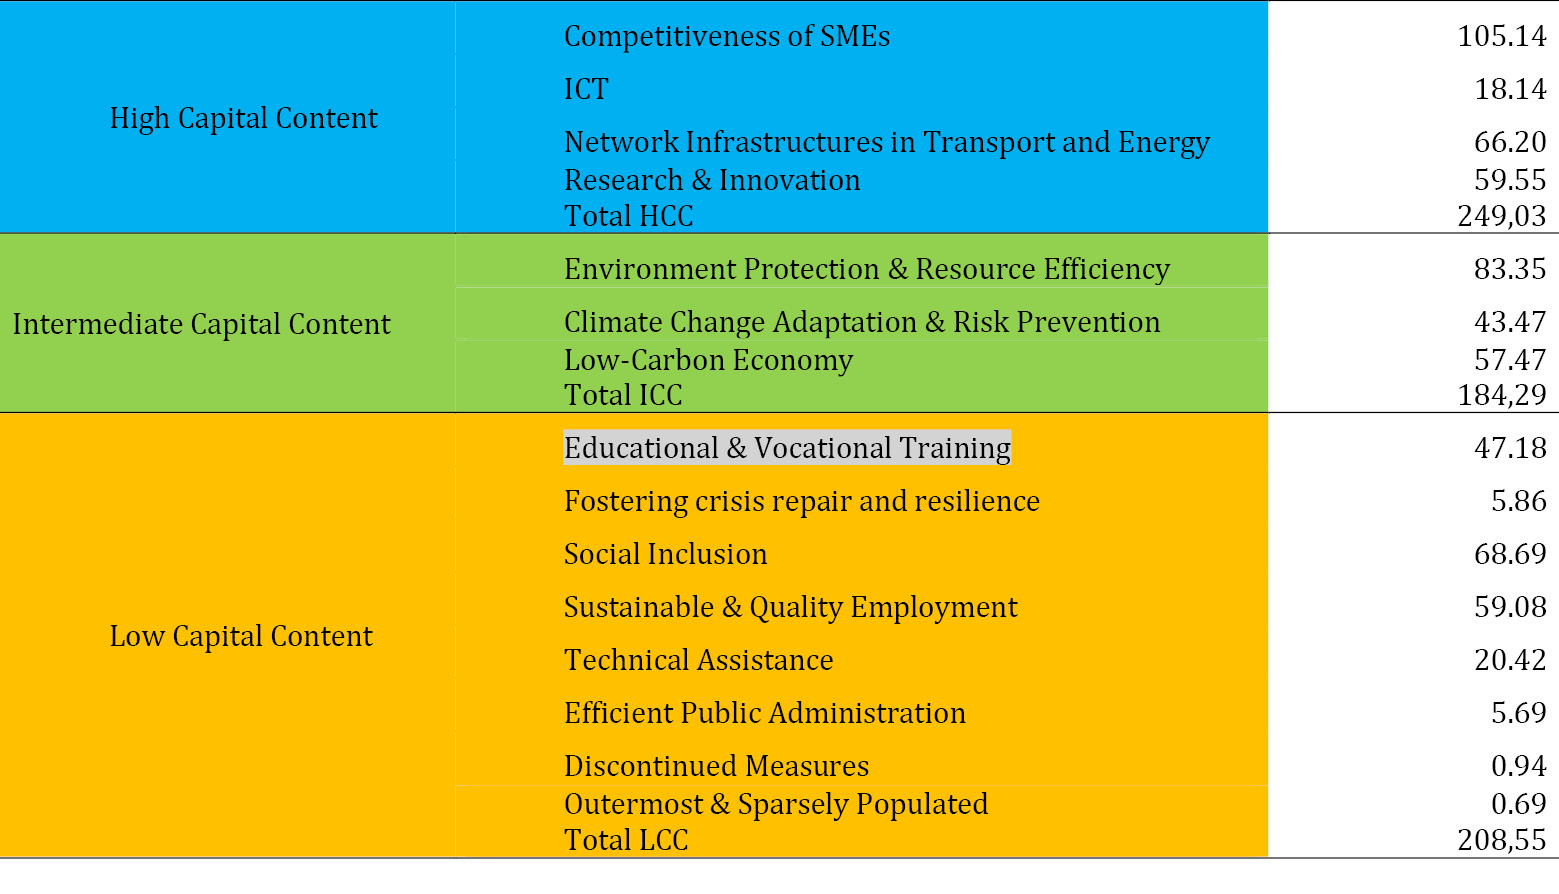
Source of data: Authors ’calculation on data, Open Data Portal for the European Structural Investment Funds―European Commission | Data | European Structural and Investment Funds (europa.eu), https://cohesiondata.ec.europa.eu/themes.
From the table above, it is easy to calculate that roughly 66.66% of cohesion expenditure is devoted respectively to the narrow category of “High Capital Content” expenditure and the broader category of “Intermediate Capital Content” (ICC). Of the remaining 33.34%, 7% is devoted to “Education and formation” and can be accounted for as a form of investment. On the whole, only 25% of cohesion expenditure at the EU level cannot be labelled as capital expenditure.
Table 2 shows the allocations to different “Capital Content” categories across member states in units of €1 bn. Of course, aside from the policy choices of member states, the amounts shown reflect both the size of the country and the overall allocation of cohesion funds. It is however worth noting the enormous allocation of expenditure to the ”High Capital Content” category for Poland, €55 bn of the overall EU budget of €642 bn.
Table 2 MS Budget for 2014–20 by Level of Capital Content (Billion Euros, Current Prices)
|
EU MS |
High Capital Content |
Intermediate Capital Content |
Low Capital Content |
Total |
|
Austria |
3.13 |
5.47 |
2.45 |
11.05 |
|
Belgium |
1.95 |
1.61 |
2.72 |
6.28 |
|
Bulgaria |
3.99 |
4.24 |
3.76 |
12.00 |
|
Cyprus |
0.35 |
0.57 |
0.34 |
1.26 |
|
Czech Republic |
14.56 |
9.38 |
9.18 |
33.12 |
|
Germany |
14.32 |
14.11 |
18.41 |
46.83 |
|
Danmark |
0.48 |
1.48 |
0.82 |
2.78 |
|
Estonia |
2.32 |
1.36 |
2.32 |
6.00 |
|
Spain |
24.85 |
13.47 |
18.28 |
56.60 |
|
Finland |
2.64 |
5.65 |
2.24 |
10.53 |
|
France |
15.04 |
17.99 |
15.91 |
48.94 |
|
Greece |
9.86 |
8.60 |
7.81 |
26.26 |
|
Croatia |
5.36 |
3.60 |
3.70 |
12.66 |
|
Hungaria |
11.62 |
8.12 |
10.02 |
29.76 |
|
Ireland |
1.32 |
4.70 |
1.58 |
7.60 |
|
Italy |
28.82 |
17.44 |
26.16 |
72.42 |
|
Latva |
2.93 |
2.10 |
1.88 |
6.91 |
|
Lithuania |
3.82 |
2.85 |
3.60 |
10.27 |
|
Luxemburg |
0.13 |
0.27 |
0.13 |
0.52 |
|
Malta |
0.37 |
0.34 |
0.42 |
1.13 |
|
Netherlands |
1.49 |
1.31 |
2.00 |
4.80 |
|
Poland |
54.80 |
24.06 |
26.40 |
105.25 |
|
Portugal |
9.45 |
7.56 |
16.19 |
33.21 |
|
Romania |
13.93 |
11.04 |
11.80 |
36.77 |
|
Sweden |
2.64 |
3.25 |
2.46 |
8.35 |
|
Slovenia |
2.08 |
1.54 |
1.33 |
4.95 |
|
Slovakia |
8.94 |
4.67 |
5.85 |
19.46 |
|
UK |
7.84 |
7.52 |
10.81 |
26.17 |
|
Total |
249.03 |
184.29 |
208.56 |
641.88 |
Source of data: Author’s calculation on data, Open Data Portal for the European Structural Investment Funds―European Commission | Data | European Structural and Investment Funds (europa.eu), https://cohesiondata.ec.europa.eu/themes.
Table 3 reports the share of the different categories of expenditure for each member country, normalised to total cohesion expenditure by country. This table really highlights the policy choices of MS (which are, of course, coordinated and agreed with the EU Commission).
Table 3 MS Budget for 2014–20 (Daily Update) by Content of Capital (% Share of Country Allocation)
|
EU MS |
High Capital Investments |
Intermediate Capital Investments |
Low Capital Investments |
of which education and training (% on total budget) |
|
Austria |
28.3% |
49.5% |
22.2% |
5.00% |
|
Belgium |
31.1% |
25.6% |
43.3% |
11.20% |
|
Bulgaria |
33.3% |
35.3% |
31.3% |
5.80% |
|
Cyprus |
27.8% |
45.2% |
27.0% |
1.30% |
|
Czech Republic |
44.0% |
28.3% |
27.7% |
8.00% |
|
Germany |
30.6% |
30.1% |
39.3% |
8.70% |
|
Denmark |
17.3% |
53.2% |
29.5% |
5.30% |
|
Estonia |
38.7% |
22.7% |
38.7% |
9.80% |
|
Spain |
43.9% |
23.8% |
32.3% |
6.90% |
|
Finland |
25.1% |
53.7% |
21.3% |
4.20% |
|
France |
30.7% |
36.8% |
32.5% |
5.90% |
|
Greece |
37.5% |
32.7% |
29.7% |
5.90% |
|
Croatia |
42.3% |
28.4% |
29.2% |
7.10% |
|
Hungaria |
39.0% |
27.3% |
33.7% |
6.90% |
|
Ireland |
17.4% |
61.8% |
20.8% |
4.50% |
|
Italy |
39.8% |
24.1% |
36.1% |
9.10% |
|
Latva |
42.4% |
30.4% |
27.2% |
7.70% |
|
Lithuania |
37.2% |
27.8% |
35.1% |
1.60% |
|
Luxemburg |
25.0% |
51.9% |
25.0% |
8.70% |
|
Malta |
32.7% |
30.1% |
37.2% |
7.00% |
|
Netherlands |
31.0% |
27.3% |
41.7% |
0.80% |
|
Polonia |
52.1% |
22.9% |
25.1% |
5.20% |
|
Portugal |
28.5% |
22.8% |
48.8% |
17.00% |
|
Romania |
37.9% |
30.0% |
32.1% |
3.50% |
|
Sweden |
31.6% |
38.9% |
29.5% |
6.90% |
|
Slovenia |
42.0% |
31.1% |
26.9% |
6.00% |
|
Slovakia |
45.9% |
24.0% |
30.1% |
3.80% |
|
UK |
30.0% |
28.7% |
41.3% |
11.50% |
|
Total |
38.8% |
28.7% |
32.5% |
7.35% |
Source of data: Author’calculation on data, Open Data Portal for the European Structural Investment Funds―European Commission | Data | European Structural and Investment Funds (europa.eu), https://cohesiondata.ec.europa.eu/themes.
Most new accession members, and particularly all eastern countries, allocate a very large share of cohesion funds to HCC Themes. This partly reflects the significance for these countries of the Cohesion Fund (CF), which is mostly allocated to infrastructure. However, note that there are important exceptions among “new” members, in particular Romania and Bulgaria, which allocate below-average shares to HCC expenditure. Most Nordic countries allocate larger-than-average shares to the intermediate category (ICC, the green transition section in Table 1), with a staggering share of 61.8% for Ireland. Older members allocate larger-than-average shares to non-capital expenditure, in particular Germany, Belgium, the Netherlands, and the UK. Also, some southern countries allocate a comparatively larger share to LCC expenditure, in particular Portugal and, to a lesser extent, Italy. Most of these countries however also allocate a large share of these resources to education and training, and are hence still investing, albeit in human capital. Particularly large are the shares of human capital investment of Portugal, Belgium, and the UK.
13.2 Does Cohesion Policy Increase Investment?
The last question we would like to address concerns the extent to which cohesion policy generates further net capital expenditure of potential crowding-out effects. It is indeed possible that cohesion funds are used to substitute for capital expenditure that would have been carried out with national funds anyway in the absence of an EU policy. Both at the EU level, and in certain individual countries, this possibility has generated heated debate about the real additionality of cohesion expenditure, and in particular of its investment.2 To investigate this matter we will look at per capita capital expenditure in those regions that are more interested in cohesion policy: those that received the largest cohesion budgets over the last two budget cycles. We will therefore calculate at the regional level gross fixed capital expenditure (normalised to regional GDP) and compare this data to national gross fixed capital formation (again normalised to GDP). If cohesion expenditure adds value and contributes to the overall capital formation, we would expect to find that it exerts a significant positive effect on regional gross fixed capital formation. The gap between regional and national capital formation should be correlated with cohesion expenditure. A lower-than-the-national ratio of GFCF to GDP for a region receiving a large cohesion contribution would signal strongly that cohesion policy is ineffective in delivering investment. The next figure displays the transfers from cohesion policy over the last two programming periods to the largest recipient regions.
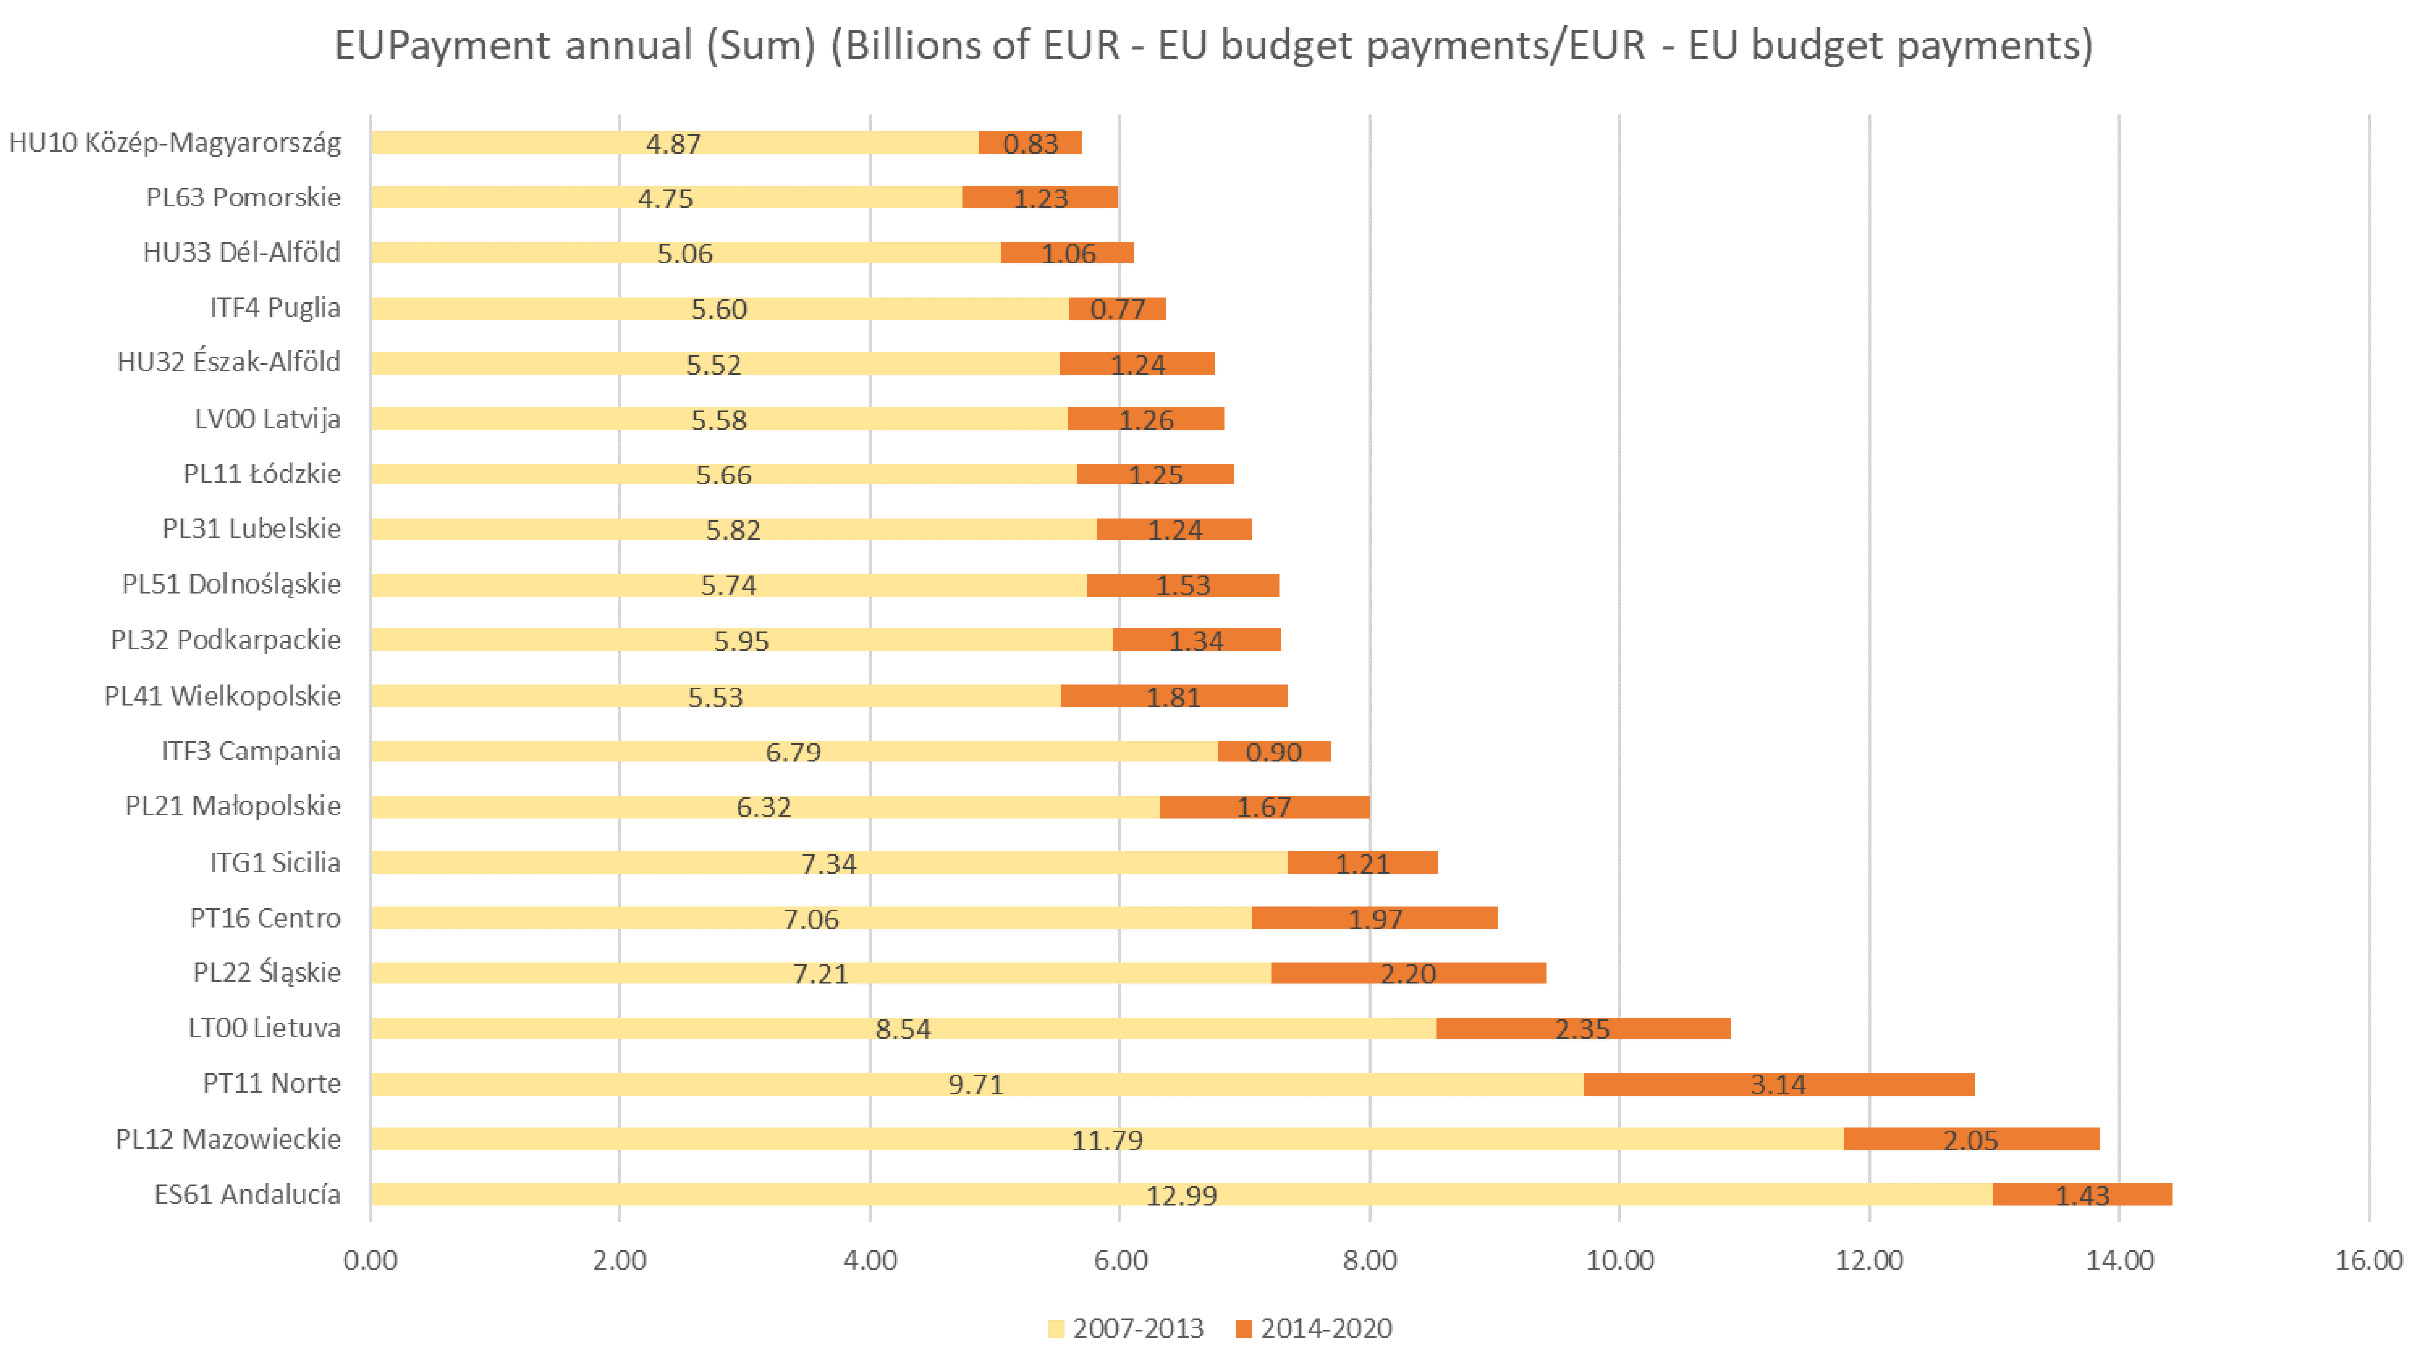
Fig. 1 Regions Receiving the Largest Contributions from Cohesion Policy (2007–20).
Source of data: https://cohesiondata.ec.europa.eu/EU-Level/Historic-EU-payments-by-MS-NUTS-2-region-filter-by/2qa4-zm5t.
Table 4 compares the ratio of gross fixed capital formation to the region’s GDP for these regions over the period 2007–20, with the national average of the same ratio. If cohesion policy significantly contributes to public (and private) investment we would expect the regional ratio to be larger than the national one.
Table 4 Comparison of Ratio of GFCF to GDP with National Averages, Selected Regions, 2007–20 (Constant Price, 2015), %
|
NUTS 2 Regions |
Regional GFCF/Regional GDP |
National GFCF/National GDP |
|
ES61 Andalucía |
19.44 |
19.82 |
|
PL12 Mazowieckie |
20.71 |
19.16 |
|
PT11 Norte |
19.02 |
17.95 |
|
LT00 Lietuva |
24.17 |
24.17 |
|
PL22 Śląskie |
18.26 |
19.16 |
|
PT16 Centro |
17.82 |
17.95 |
|
ITG1 Sicilia |
16.56 |
18.88 |
|
PL21 Małopolskie |
18.23 |
19.16 |
|
ITF3 Campania |
17.08 |
18.88 |
|
PL41 Wielkopolskie |
18.98 |
19.16 |
|
PL32 Podkarpackie |
20.79 |
19.16 |
|
PL51 Dolnośląskie |
19.49 |
19.16 |
|
PL31 Lubelskie |
17.33 |
19.16 |
|
PL11 Łódzkie |
19.29 |
19.16 |
|
LV00 Latvija |
24.17 |
24.17 |
|
HU32 Észak-Alföld |
24.33 |
22.68 |
|
ITF4 Puglia |
17.67 |
18.88 |
|
HU33 Dél-Alföld |
24.01 |
22.68 |
|
PL63 Pomorskie |
21.26 |
19.16 |
|
HU10 Közép-Magyarország |
27.24 |
22.68 |
Source of data: Author’s elaboration on ARDECO database https://knowledge4policy.ec.europa.eu/territorial/ardeco-online_en
Table 4 shows a complex picture, with different outcomes for different countries. While the Hungarian regions (e.g., Közép-Magyarország, Észak-Alföld), some Polish regions (e.g., Mazowieckie and Podkarpackie), and, to a lesser extent, the Portuguese regions (e.g., Norte) display significantly higher-than-national GFCF ratios, the regions of Italy and Spain display lower-than-the-national-average ratios of capital formation. This certainly indicates that the cohesion policy has been ineffective in the main regions of Italy in raising the level of total capital formation. Moreover, it may also indicate that national public investment expenditure has been substituted by EU cohesion policy funds in those regions. Certainly, there is no indication that public investment has been increased significantly by cohesion policy in these countries.
13.3 Conclusion
In this paper, we explored data on Cohesion Policy expenditure to assess its real contribution, both directly and indirectly, to public capital formation in the EU. A significant proportion of Cohesion Policy, particularly in certain regions, is capital expenditure, although the standard approach of assuming that it is always entirely capital expenditure definitely appears wrong. We have tried to disentangle the likely share of capital expenditure in the budget cycle 2014–20 by exploring the themes of the policy. Some of them are mainly capital expenditures, others less so. By this method, we ascertained that some two thirds of cohesion expenditure has a significant investment nature. Another 7% is directed at increasing human capital (through education and formation). For 25% of the total, it is safe to assume that there is not an investment element. The composition of the expenditure according to the likely capital content is highly differentiated across countries. While some countries, notably Poland, spend a high proportion of funds on fixed capital formation, others spend considerably less. This may explain why cohesion policy is associated with very different outcomes (for example relating to productivity or employment without growth) in different countries (Crescenzi and Giua 2020).
In a second exercise, we explored the relationship between gross fixed capital formation at the regional level and cohesion policy, in an attempt to discover whether the latter has been able to increase investment and public investment in the regions receiving more transfers relative to the national average. The data show large differences between different regions and countries. In particular, the Italian regions seem not to benefit from cohesion policy in terms of overall investment.
Although this may also signal a lack of additionality of cohesion expenditure in some countries, a satisfactory test can only be conducted with public investment data at the regional level, which are currently not available in Eurostat. We believe it must be a priority for policy and statistical purposes to produce these data.
A final observation should be made on the effects of COVID-19 on cohesion investments. In 2020, the EU Commission launched two initiatives to allow the use of cohesion resources for a swift response to the coronavirus emergency, starting a large reprogramming of funds (EU Commission 2021). The use of cohesion funds for the emergency was necessary, but we must be aware that this may have an adverse impact on public investment. The initiatives allowed the transfer of funds across priorities and even among funds. Roughly €20 bn were transferred to health actions, emergency business support, and direct support of vulnerable groups of people. None of these actions are investments, hence we should to some degree expect a decrease in public investments in underdeveloped regions.
References
Berkowitz, P., P. Monfort and J. Pien´kowski (2020) “Unpacking the growth impacts of European Union Cohesion Policy: transmission channels from Cohesion Policy into economic growth”, Regional Studies 54(1): 60–71.
Barbieri, G. and F. Cerniglia (2021) “The Relaunch of Public Investment in Italy”, in The Great Reset: 2021 European Public Investment Outlook, ed. by F. Cerniglia, F. Saraceno and A. Watt (Cambridge: Open Book Publishers), pp. 63–78, https://doi.org/10.11647/obp.0280.04.
Brasili, A., A. Kolev, D. Revoltella and J. Shanz (2021) “Public Investment in the Pandemic—Europe at a Glance”, in The Great Reset: 2021 European Public Investment Outlook, ed. by F. Cerniglia, F. Saraceno and A. Watt (Cambridge: Open Book Publishers), pp. 17–32, https://doi.org/10.11647/obp.0280.01.
Coco, G. and C. De Vincenti (2020) Una Questione Nazionale—Il Mezzogiorno da problema a opportunità (Bologna: Il Mulino).
Crescenzi, R. and M. Giua (2020). “One or many Cohesion Policies of the European Union? On the diverging impacts of Cohesion Policy across Member States”, Regional Studies, 54(1): 10–20.
Durand, L., R. Espinoza, W. Gbohoui and S. Mouhamadou (2021) “Crowding In-Out of Public Investment”, in The Great Reset: 2021 European Public Investment Outlook, ed. by F. Cerniglia, F. Saraceno and A. Watt (Cambridge: Open Book Publishers), pp. 107–26, https://doi.org/10.11647/obp.0280.07.
EU Commission (2017) Communication on Ex-post Verification of Additionality 2007–13, Brussels: European Commission, https://ec.europa.eu/regional_policy/en/information/publications/communications/2017/ex-post-verification-of-additionality-2007-2013.
EU Commission (2021) European Structural and Investment Funds 2014–20, 2020 Summary Report of the annual implementation reports, Brussels: European Commission, https://ec.europa.eu/regional_policy/en/information/publications/reports/2021/european-structural-and-investment-funds-2014-2020-2020-summary-report-of-the-programme-annual-implementation-reports-covering-implementation-in-2014-2019.
Fratesi, U. and G. Perucca (2018) “EU Regional Development Policy and Territorial Capital: A Systemic Approach”, Papers in Regional Science 98(1), 265–81.
Haskel, J. and S. Westlake (2018) Capitalism without Capital: The Rise of the Intangible Economy (Princeton: Princeton University Press).
Prota, F., G. Viesti and M. Bux (2020) “The Contribution of the European Cohesion Policy to Public Investment”, in A European Public Investment Outlook, ed. by F. Cerniglia and F. Saraceno (Cambridge: Open Book Publishers), pp. 175–92, https://doi.org/10.11647/obp.0222.10.
Psycharis, Y., V. Tselios and P. Pantazis (2020) “The contribution of Cohesion Funds and national funded public investment to regional growth: evidence from Greece”, Regional Studies 54(1): 95–105.
1 For some smaller countries, usually the beneficiaries of the highest per capita transfer, such as Hungary and Portugal, this ratio is close to 60% in the period 2015–17. It is very unlikely, however, that the whole of the Cohesion Policy expenditure is capital in a traditional accounting sense. The same proportions are negligible in larger and richer countries like Germany.
2 At the EU level, this originated a procedure for ex-post verification (see EU Commission 2017). For a description of the problem and the institutional attempt to tackle it in Italy, see Coco and De Vincenti (2020).