
2. From Fiscal Consolidation to the Plan de relance: Investment Trends in France
© Mathieu Plane and Francesco Saraceno, CC BY 4.0 https://doi.org/10.11647/OBP.0280.02
Introduction
This chapter traces the trends of public investment and public capital in France from the 1970s. Compared to other OECD countries, both the level of public capital and the quality of infrastructures in France are high. But the trend over at least the last ten years is not favourable. Gross public investment has been on a declining trend for years, and net public investment has shown an even greater drop, becoming negative. The depreciation of public capital today is not compensated by new investment. The net worth of public administrations is still positive but has suffered a significant fall and reached a worrying low point. Indeed, since 2005 public debt has grown faster than public capital. The first part of the chapter will summarise and actualise the analysis of Plane and Saraceno (2020) on the dynamics of the public capital stock in France. The second part will initially look at the French response to the COVID-19 crisis and then describe the €100 bn Plan de relance (Plan de relance) that was presented in September 2020.
2.1 Trends in Public Investment before the Pandemic
How did public capital in France evolve from the late 1970s? What are its main characteristics and how is it measured? Which public institutions hold this capital? How did investment flows and depreciation shape it? What is the net position of public administrations today? This section will address these questions.
What is referred to as public capital covers a wide variety of assets, such as land, residential buildings, ports, dams, roads, but also intellectual property rights. It is necessary to break down the “wealth of the state” into these different components to understand its dynamics considering, as we will show below, that price (most notably land prices) and volume effects may play a significant role in explaining the evolution of the different components, and of aggregate figures.
The data we use are from the INSEE national accounts, which are public; our analysis covers the period 1978–2020 for the decomposition of net wealth and 1949–2020 for investment. INSEE reports the consolidated level (general government, GG) and its components, distinguishing between the central government (CG), local governments (LG), social security administrations (SSA), and other government agencies (OGA).
Public investment in France has seen contrasting trends in recent decades. While it was rather dynamic until the late 2000s, at the turn of 2010 the fiscal stance changed, and a substantial part of fiscal consolidation was achieved by reducing capital expenditure. Indeed, the reduction of public investment has contributed to almost a third of fiscal consolidation even though investment only represented 6% of public expenditure. The share of public investment on GDP, which had largely been above 4% since the 1960s (Figure 1), fell below that level in 2011 and, during the period 2015–18, reached its lowest level since 1952. Spurred on by the new rules of local communities’ management and the effect of the electoral cycle linked to municipal elections, the investment rate has improved in 2019–2020 but has not, however, returned to its average level of the 2000s. In 2020, due to health restrictions, public investment contracted by 4.4% but held up rather well in the face of the decline in GDP (-7.9%). Nevertheless, the drop in investment fatally impacted the stock of public capital.
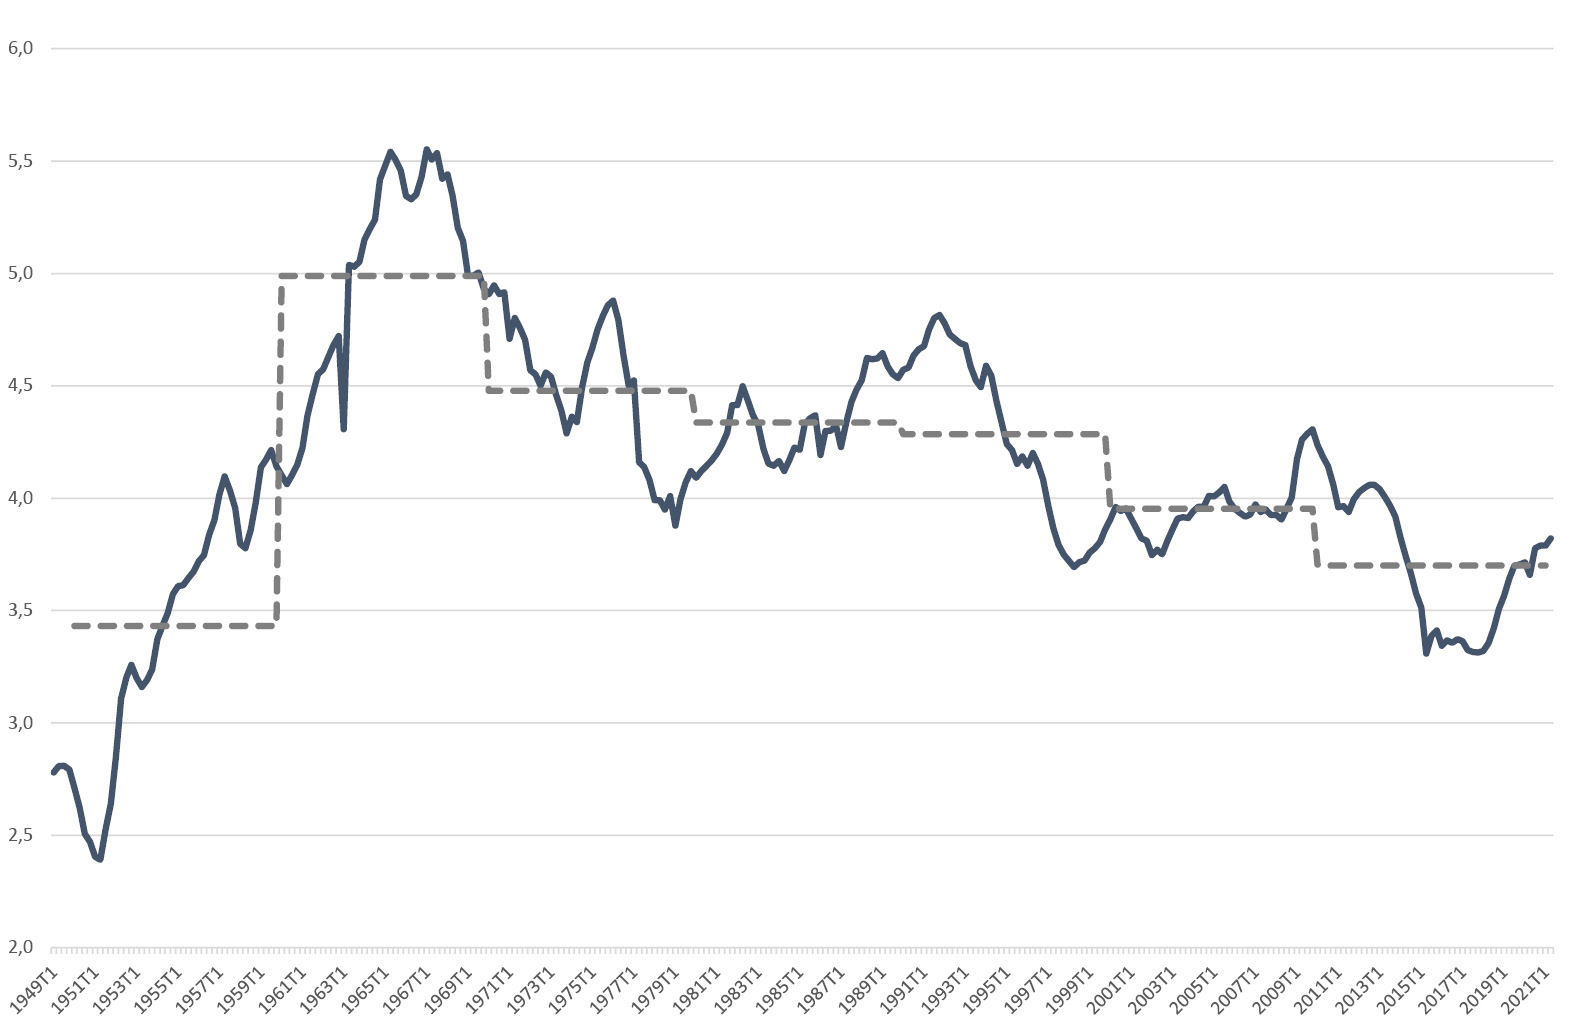
Fig. 1 General Government Investment Rate (as a % of GDP).
Source of data: Insee. Figure created by the authors.
In 2020, the consolidated public sector had a positive net wealth in spite of the negative impact of the COVID-19 crisis (Table 1). Total assets held represented 172% of GDP, of which 103% was for non-financial assets. Financial liabilities totalled 164% of GDP. The net worth in 2020 was therefore 8.2% of GDP, around €2800 per capita.
Table 1 Decomposition of General Government Net Wealth
|
As a % of GDP |
In euros per head |
|||
|
1978 |
2007 |
2020 |
2020 |
|
|
Non-financial assets |
60.8 |
90.4 |
102.8 |
35210 |
|
Financial assets |
27.6 |
52.6 |
69.0 |
23620 |
|
Financial liabilities |
33.7 |
84.9 |
163.5 |
56020 |
|
Net worth |
54.7 |
58.1 |
8.2 |
2810 |
Source of data: INSEE and authors’ calculations.
While positive, the consolidated net wealth is at its lowest level since 1978. Indeed, after reaching a record level in 2007 (58% of GDP), it has lost fifty points of GDP in the space of thirteen years. The reasons for this sharp drop are to be found on the net financial liabilities (debt) side that increased substantially while non-financial assets increased slightly.
This net worth is unevenly distributed among different levels of government. Indeed, it is very positive for local administrations (70% of GDP in 2020), very negative for the state (-80% of GDP in 2020), and slightly positive for social security administrations and other government agencies (8% and 10% respectively). Broadly speaking, the central government―which runs recurrent public deficits―has accumulated public debt; low-debt local governments hold non-financial assets, be it land, buildings, or civil engineering works. With the economic and financial crisis, from 2008 on, the central government net worth deteriorated considerably, as public deficits and debt increased. On the other hand, the net worth of local governments remained high and relatively stable over the same period due to a stable value of non-financial assets and of their debt.
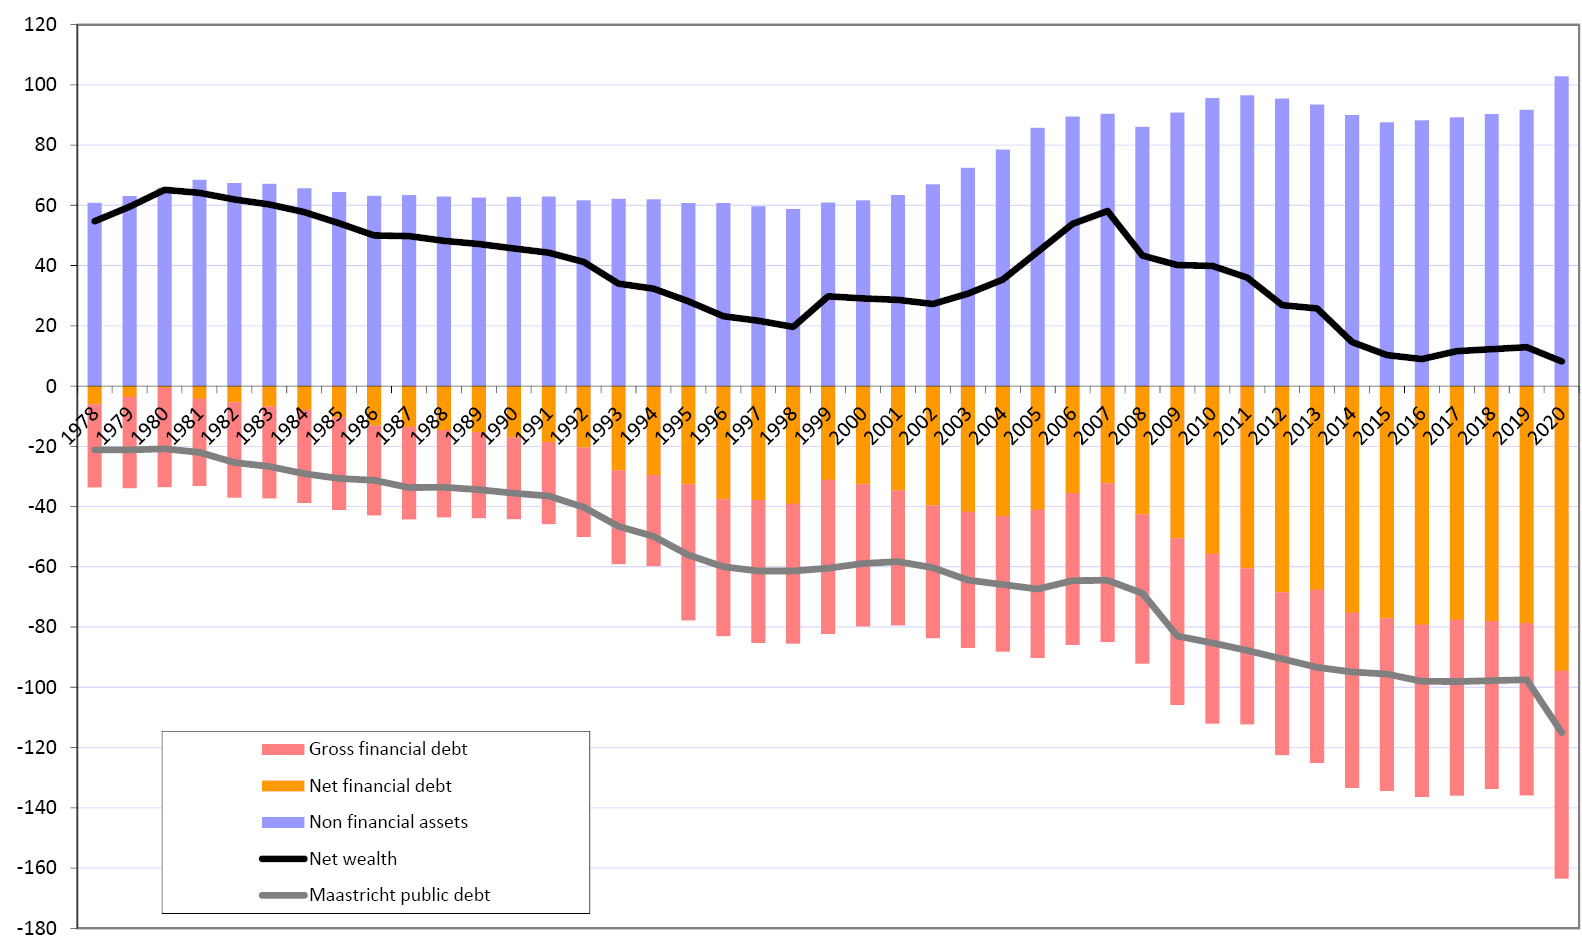
Fig. 2 Evolution of General Government Net Wealth as a % of GDP.
Source of data: Insee. Figure created by the authors.
In 2020, non-financial assets (NFAs) of the general government represented 60% of total assets and accounted for 103% of GDP. These figures can be further divided into fixed capital (produced NFAs), which is the result of past public investments, and land (non-produced NFAs).
Fixed assets account for 55% of GDP, mostly civil engineering works and non-residential buildings (47% of GDP), with 8% being public housing, machinery and equipment, weapon systems, and intellectual property rights. Non-produced NFAs represent 47% of GDP, most of which (98%) constitutes land owned by the general government. Unlike fixed assets, non-produced NFAs do not depreciate, and their evolution depends mainly on land prices. These prices have been the main cause of change since the 1970s (details on the decomposition by type of assets and by level of government can be found in Plane and Saraceno 2020).
Fixed capital is given by calculating the past accumulation of realised investments net of depreciation. Between the end of the 1970s and 2020, the value of fixed assets held by the general government ranged from 47% to 55% of GDP, showing significantly lower volatility than the value of non-produced NFAs. This is because fixed assets experience much smaller price changes than land.
Since 1978―but also since 2007―it has been the non-residential buildings, and to a lesser extent the intellectual property rights, which have seen the larger increase of their share in fixed assets.
The analysis of gross investment needs to be complemented by the net flow of fixed assets (net investment), to assess the dynamics of the capital stock (abstracting from the effects of revaluation of the existing stock). Thus, if gross investment is greater (lower) than the depreciation of capital (consumption of fixed capital, CFC, in national accounts’ nomenclature), then net investment increases (decreases) and the stock of capital increases (decreases). Unlike fixed assets, non-produced NFAs (land) and inventories may experience changes in value but are not subject to consumption of fixed capital. CFC only applies to fixed assets.
Over the period from the late 1970s to the first half of the 1990s, general government net investment was strong, averaging more than 1% of GDP per year (Figure 3). It even experienced a strong boom over the period 1987–92, averaging above 1.4% of GDP per year. From 1993 to 1998 however, general government net investment declined sharply, reaching 0.5% of GDP in 1998, a decrease of 1% of GDP in the space of six years. Like in other European countries, this is mostly due to the effort to meet the Maastricht criteria in the run-up to adopting the euro: the cyclically adjusted deficit for France decreased from 4.6% of GDP in 1993 to 1.8% in 1998. Past this phase, net investment recovered, then fluctuated between 0.7 and 0.9% of GDP over the 2000–10 period, without ever returning to the level observed during the 1980s and the first half of the 1990s. But it is mainly from 2011, following the Global Financial Crisis, that net investment has experienced a break. Since then, it has been at its the lowest level since the late 1970s, when the wealth accounts were introduced.
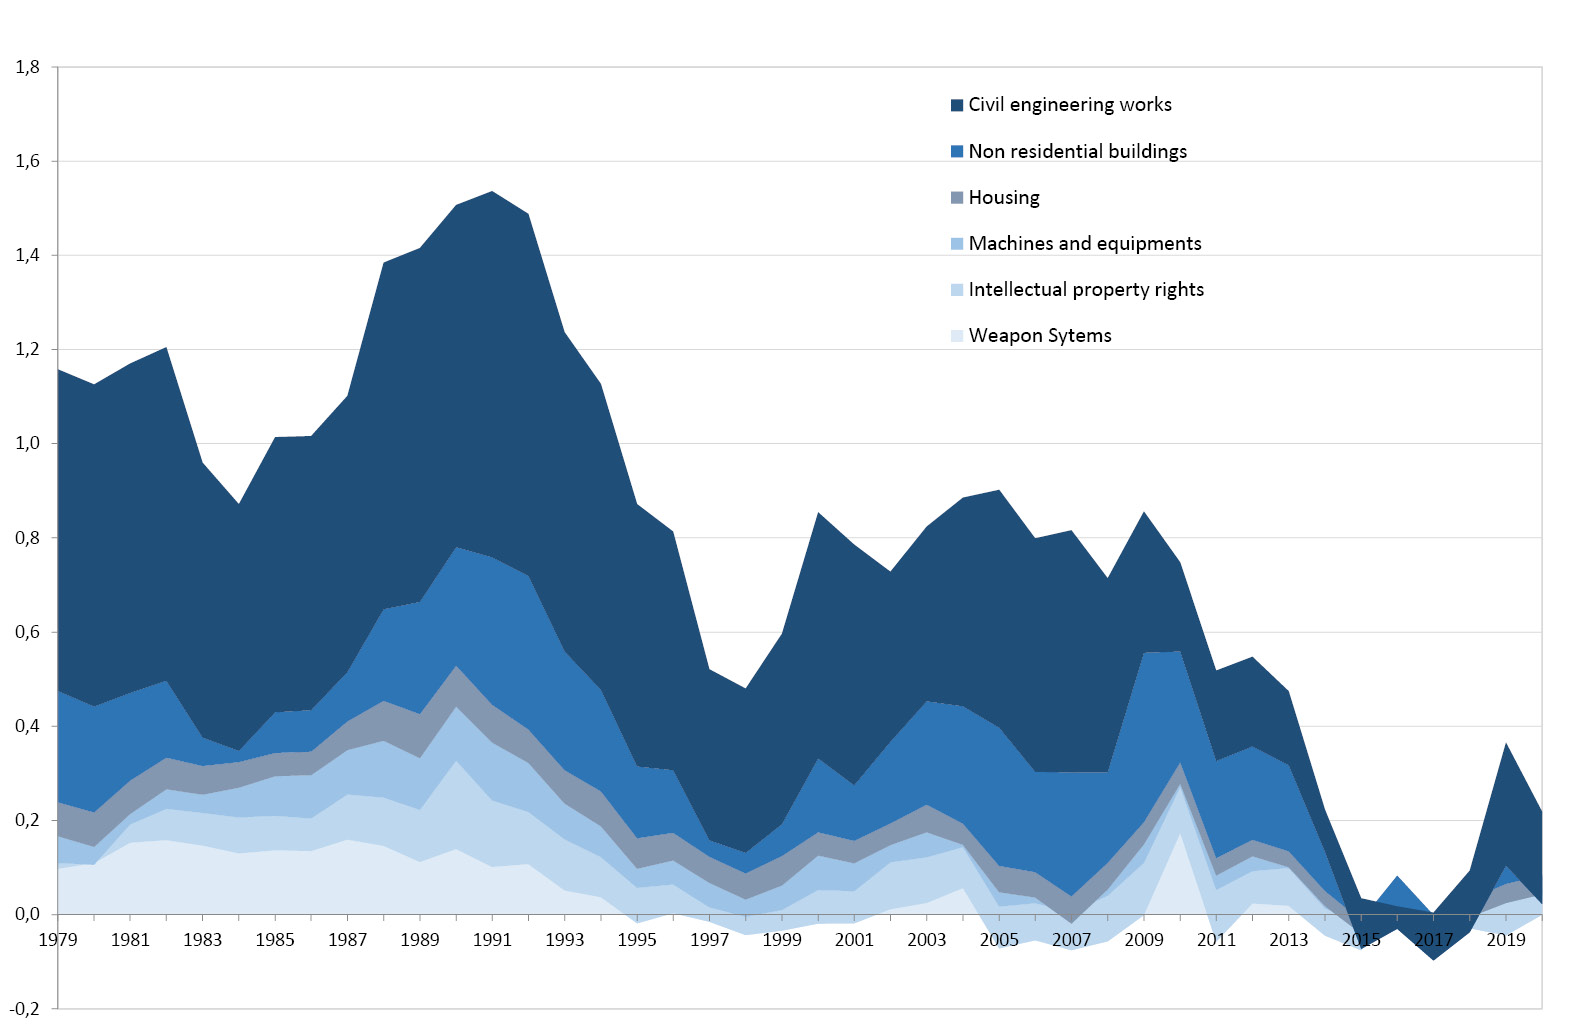
Fig. 3 Net General Government Investment by Component as a % of GDP.
Source of data: Insee. Figure created by the authors.
Thus, during the period 2014–18, France has spent about 0.7% of GDP (about €17 bn by year in constant 2020 euros) less on net investment than it did during the period 2000–10, and 1.4% (approximately €34 bn by year in constant 2020 euros) less than during the period 1990–92.
While the central government contributed positively, albeit weakly, to net investment until the early years of the 2000s, since 2005 central government net investment has moved into negative territory. It is, in fact, local governments which have historically been the main contributors to net government investment. However, since 2007―on the one hand, with the Global Financial Crisis that reduced own resources levied by local governments, and, on the other hand, with the reduction of endowments to local governments that followed fiscal consolidation―net investment by local governments has collapsed from 0.8% of GDP in 2007 to 0% in 2016. Since then, it has recovered slightly, to a level that barely offsets the destruction of capital by the central government and by social security administrations.
The picture that emerges from the analysis of stocks and flows is rather consistent and gives two main messages: the first is that public investment and the stock of capital have been largely affected by the macroeconomic cycle. In the two significant phases of fiscal consolidation―the run-up to adopting the euro in the 1990s and the aftermath of the sovereign debt crisis―investment was strongly reduced. Especially in the latter case, net investment turned negative of zero for all levels of government, thus reducing the stock of capital that, before the pandemic, was at an all-time low. The second message, that emerges in particular from the analysis of stocks, is that in spite of these trends in investment, the capital stock in France is still significant (and larger than in other countries, as can be seen by looking at the other chapters of this outlook). One might ask then if the effort of consolidation, and the disproportionate burden that it has laid on public investment, at least led to more sustainable public finances.
If we compare the evolution over the last twenty years of non-financial assets’ net flows in relation to the primary net financial flow (financial assets―financial liabilities―interest expenses), which we consider here as a proxy of the net worth, two sub-periods emerge clearly. The first, which runs from 1996 to 2008, is a period in which the additional public net financial debt (excluding interest expense) was more than offset by the net accumulation of non-financial assets, leading to a positive net value on this period, which means that the general government stock of wealth has increased in value over this period, even abstracting from price effects. The second period, which runs from 2009 to 2020, shows a new pattern in which the net debt increase is no longer offset by an increase in public non-financial capital, generating a sharp deterioration in government net worth. The economic and financial and economic crisis has led to a sharp increase in public debt. Fiscal consolidation started being implemented in 2011: while on one hand it has partly reduced new financial commitments, on the other hand this has been more than offset by a reduction in the net accumulation of non-financial assets. This is further proof of the fact that the burden of fiscal consolidation was disproportionately laid on the shoulders of public investment. The sharp reduction in net worth therefore casts doubt on the effectiveness of fiscal consolidation in strengthening the public finances outlook for France.
2.2 Public Investment during the Pandemic
A recovery in public investment began in the two years before the COVID-19 crisis, with an increase of nearly 14% between the end of 2017 and the end of 2019. This movement was linked to the electoral cycle of municipal elections and the government’s desire to preserve investment within the framework of the targeted budget contract with local communities. While a partial reversal in public investment was expected after the municipal elections, the drop observed in the first half of 2020 is out of proportion to that observed in previous electoral cycles (Figure 4).
Indeed, the COVID-19 crisis led to a drop of 11% in public investment during the first half of 2020 compared to the second half of 2019 (with a fall to 16% during the second quarter of 2020). By way of comparison, the three strongest half-yearly decreases observed for the previous seventy years were between 5% and 6%. The fall in public investment during the first half of 2020 was therefore twice as strong as the most severe reversals since 1950.
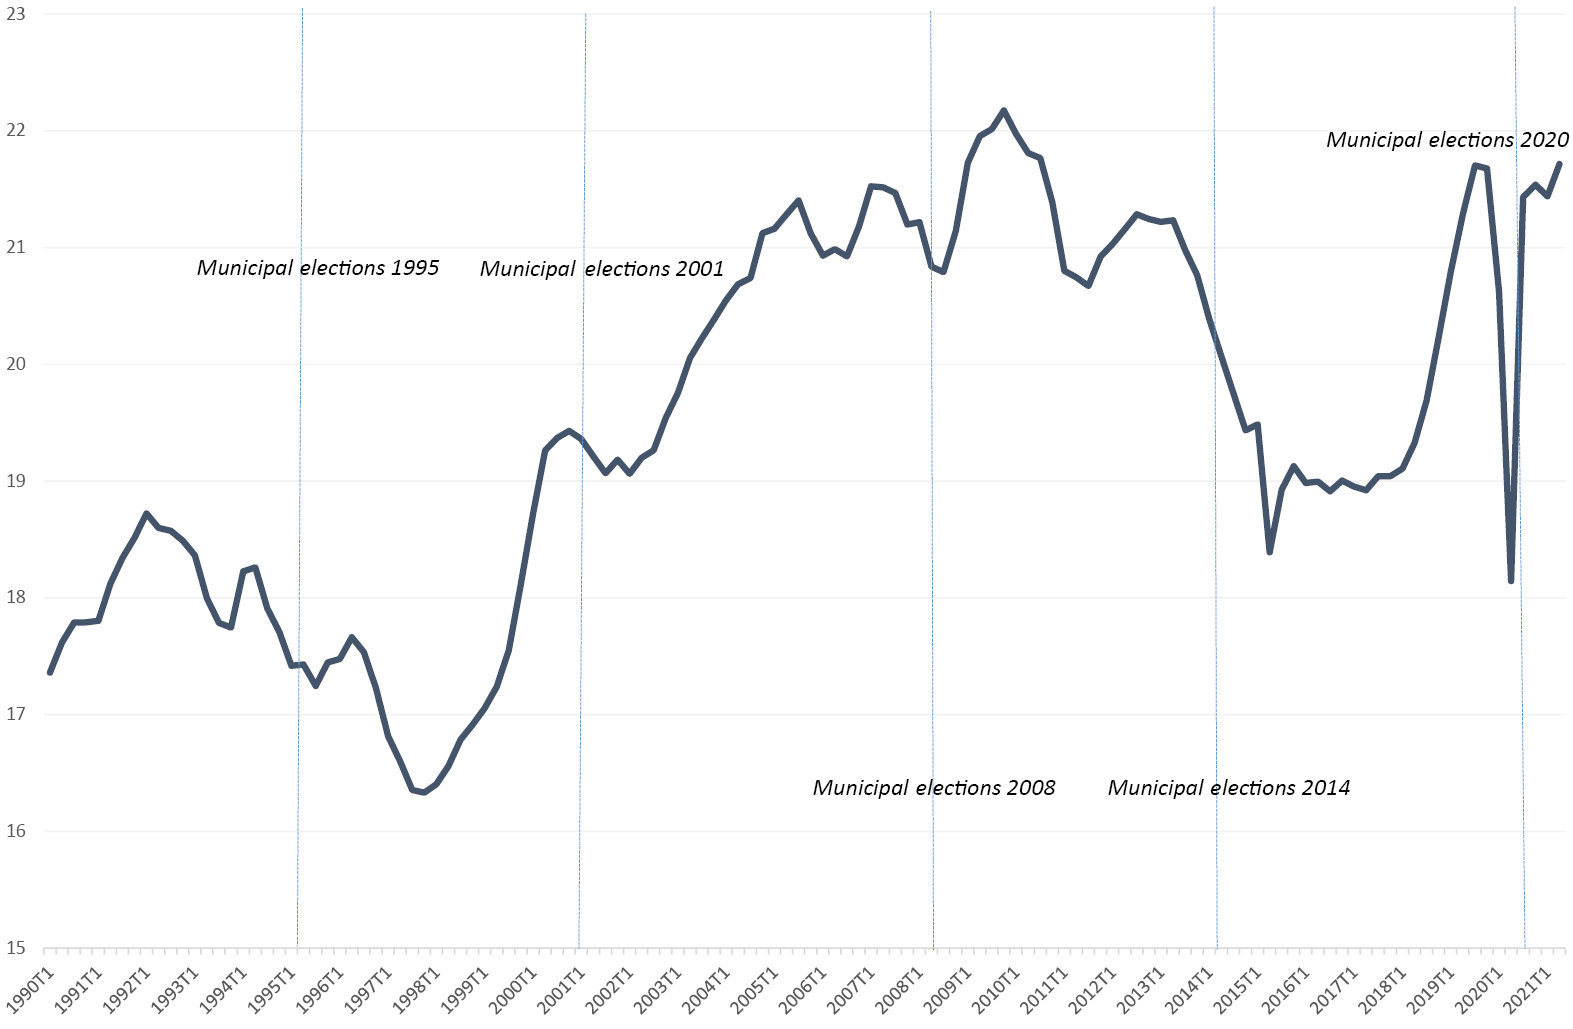
Fig. 4 General Government Investment―Constant Prices, in Billion Euros.
Source of data: Insee and authors’ calculations.
The reason for the drop can be traced to the virtual halt of the economy. The first lockdown, from 17 March to 11 May 2020, was characterised by very strong health restrictions and a historic drop in GDP of more than 30% during the period. The restrictive measures of that lockdown impacted most sectors of the economy, including construction, with the almost total shutdown of most construction sites. The construction sector lost more than 60% of its added value in April 2020 (compared to a pre-COVID situation), leading to a historic fall in public investment.
However, from the third quarter of 2020, public investment returned close to its pre-COVID level despite two other lockdowns (in November-December 2020 and March-April 2021). This is because the two subsequent lockdowns were less restrictive: activities related to construction were no longer stopped, and non-teleworking activities were, in general, less restricted. In addition, the government voted in September 2020 for a €100 bn Plan de relance, which includes a section on public infrastructure, with particular emphasis on the thermal renovation of public buildings and increased planned investment from the start of the year 2021 (see Section 3.4).
Overall, public investment contracted by 4.4% in 2020. This is a relatively modest drop, especially when compared to the fall in the level of activity, the highest on record. It is not the most important contraction in recent times; in 2014 and 2015, public investment fell more than 4%, despite positive growth rates, because of fiscal austerity and the reduction of local governments’ endowments. The pandemic overall had a lesser negative impact on public investment than fiscal consolidation. The resilience of public investment in 2020 has helped to slow down the fall in activity and contributes to the ongoing and future recovery of the French economy. However, taking into account the depreciation of public productive capital, net investment only increased to 0.2% of GDP in 2020. It is 0.2 points % of GDP less than in 2019. The investment gap to be filled, stemming from the drastic drop of the first semester, is of almost €5 bn.
2.3 The Plan de Relance of September 2020
There are several reasons that lead us to believe that, as of today, the multiplier of public investment for France would be quite significant, in the upper range of estimates (Creel et al. 2011; Le Garrec and Touzé 2020). First, the French government finances its ten-year debt at a historically low nominal rate (around 0.2% in June 2021), which means that the real rate is almost zero and is becoming negative with the desirable return of an inflation rate close to 2%. Second, in spite of recent spikes in inflation, the medium-term forecast for inflation remains subdued, so that interest rates will remain low for quite some time; this will limit crowding out of private investment (see Chapter 7 of this volume). Finally, the output gap and (more importantly) the slack in the labour market leads us to believe that, in the short run, the multiplier will also be quite large.
It is in this context that the French government unveiled, in September 2020, the contents of the Plan de relance worth €100 bn over two years, part of which (€40 bn) is financed with funds from the Recovery and Resilience Facility, the flagship item of the Next Generation EU programme. Like all other major EU countries (except for Italy), France made the choice of only using the grants of the Recovery Facility. Of the €100 bn, around €36.7 bn will be dedicated to public investment (see Table 2).
Table 2 The Investment Component of the Plan de relance (in Billion Euros)
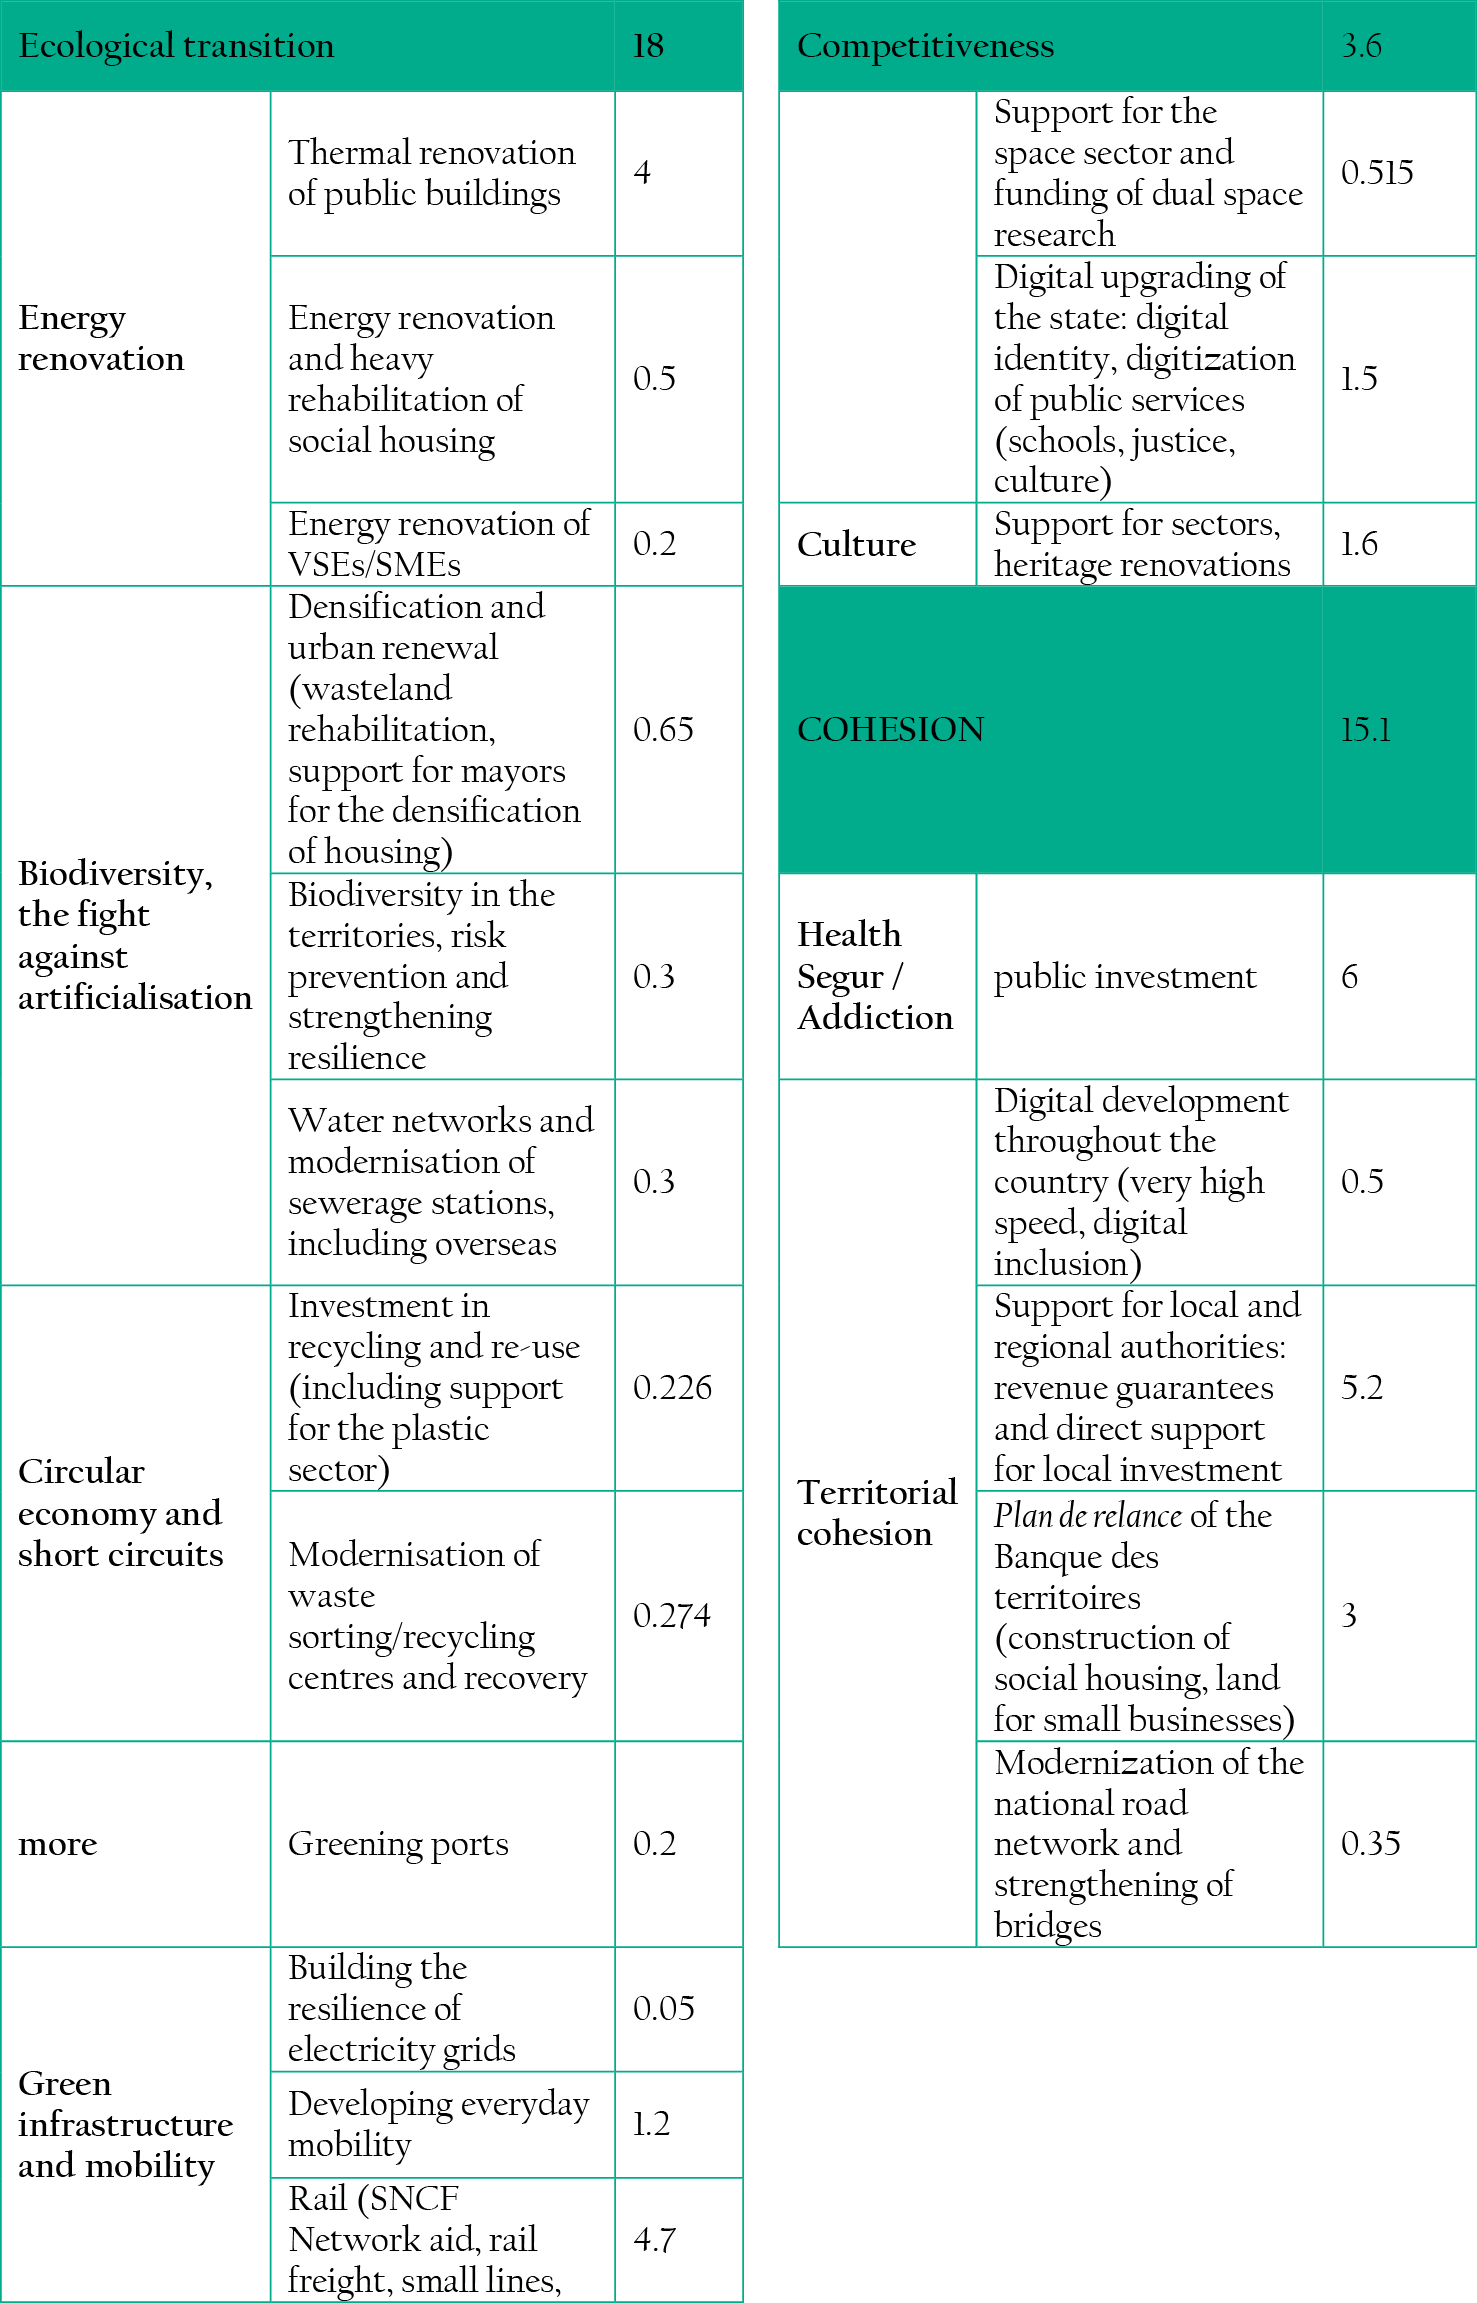
The Plan de relance is focused on three components, each weighing a third of the total: an “ecological transaction” component, for around a third of the plan (€30 bn); a “competitiveness” component (€34 bn), aimed at supporting businesses (especially small and medium enterprises) with aid and tax cuts; and a “cohesion” section (€36 bn), for the most part dedicated to supporting local communities. If we look at the public investment components of the plan (the €36.7 bn detailed in Table 2), ecological transition has the lion’s share, with €18 bn (50% of total investment), followed by cohesion (€15.1 bn or 40% of public investment). Only 10% of the public investment component of the plan will go to competitiveness.
If we look into the details of the ecological transition component, €4.5 bn will be allocated to the thermal renovation of public buildings, and to the energy renovation and major rehabilitation of social housing. Investment in transport (daily mobility, rail networks, and other transport infrastructure) will absorb €6.5 bn. With regard to competitiveness, the public investment effort will be concentrated on the digital upgrading of the central and local governments, in particular the digitisation of public services (€1.5 bn) and support for heritage renovations in the domain of culture. With regard to the cohesion component, public investment will mainly be allocated to health (€6 bn), support for investment by local authorities (up to €5.2 bn), and the Plan de relance of the Banque des Territoires (construction of social housing and land for small businesses), for €3 bn.
Like for other countries, the challenge for France is the deployment of the Plan de relance according to the timeline presented to the Commission. The disbursement of funding will be conditional to the attainment of milestones and results detailed in the plan. The second issue is a territorialisation of the Plan de relance, especially for its investment component. We saw that local authorities account for a large part of public investment. Capacity building and coordination among local governments and the central government will be central to the success of the plan.
On top of the €6 bn devoted in 2020 to measures to promote youth employment, green technologies, and infrastructure, the Plan de relance should, based on our estimates,1 mobilise €34 bn in 2021 (1.4% of GDP) and €28 bn in 2022 (1.1% of GDP). A reasonable assessment of the impact of these expenditures requires a detailed and disaggregated analyisis, as sectoral and functional multipliers may be quite different (for details, see Ducoudre et al. 2020). A significant percentage of the Plan de relance rolled out in 2021 (38%) focused on non-targeted support for businesses, in particular through a cut in production taxes. In a time of high uncertainty, these measures will not be particularly effective in revitalising investment in the short-term and will have a low multiplier the first year (estimated at 0.3). While the Plan de relance is betting on public investment, only 30% of the plan for 2021 is used to fund public investment. Even though the public investment multipliers are high (close to one), the slow speed of project implementation explains the expected modest improvement in growth in 2021 induced by public investment. In 2022, the share of the Plan de relance earmarked for public investment is expected to increase to 39%.
In contrast, job retention schemes, measures to promote employment and strengthen equity capital, sector-based subsidies, and assistance for the poorest households are supporting employees’ income and the financial position of companies coping with the long-term impact of the health restrictions and changes in consumer behaviour. These measures, which represent 43% of the plan for 2021, will yield a strong multiplier effect in the short term (Figure 5). The Plan de relance is projected to boost GDP by 1.3% in 2021 (after an impact of 0.3% of GDP in 2020), which corresponds to a multiplier of 0.9. In 2022, the Plan de relance measures are expected to amount to €28 bn euros (1.1% of GDP) and to have an impact on growth of 0.8% of GDP. The fiscal multiplier in 2022 (0.7) would be slightly below that of 2021, mainly because of the increasing share of non-targeted measures (39%); in contrast, the weight of targeted measures declines sharply between 2021 and 2022 (from 43% to 20%). In total, the Plan de relance would result in a cumulative gain in economic activity of 2.4% of GDP over the period 2020–22, for a cumulative fiscal impulse of 2.8% of GDP, which corresponds to a multiplier of 0.85. Over the same period, the public investment component would boost GDP by 0.7%, representing 30% of the total impact of the Plan de relance.
On 11 July 2021, President Macron announced a new investment plan to follow the €100 bn Plan de relance and “build the France of 2030”. While the 2020 stimulus plan was composed of very disparate measures, the new one would only target investment for strategic sectors, such as hydrogen, semiconductors, or electric batteries. The resources devoted to these future investments in the 2020s will be unveiled on the occasion of the budget project for 2022, presented in the fall of 2021. The plan will hopefully significantly increase public investment, and eventually strengthen the potential growth rate of the French economy.
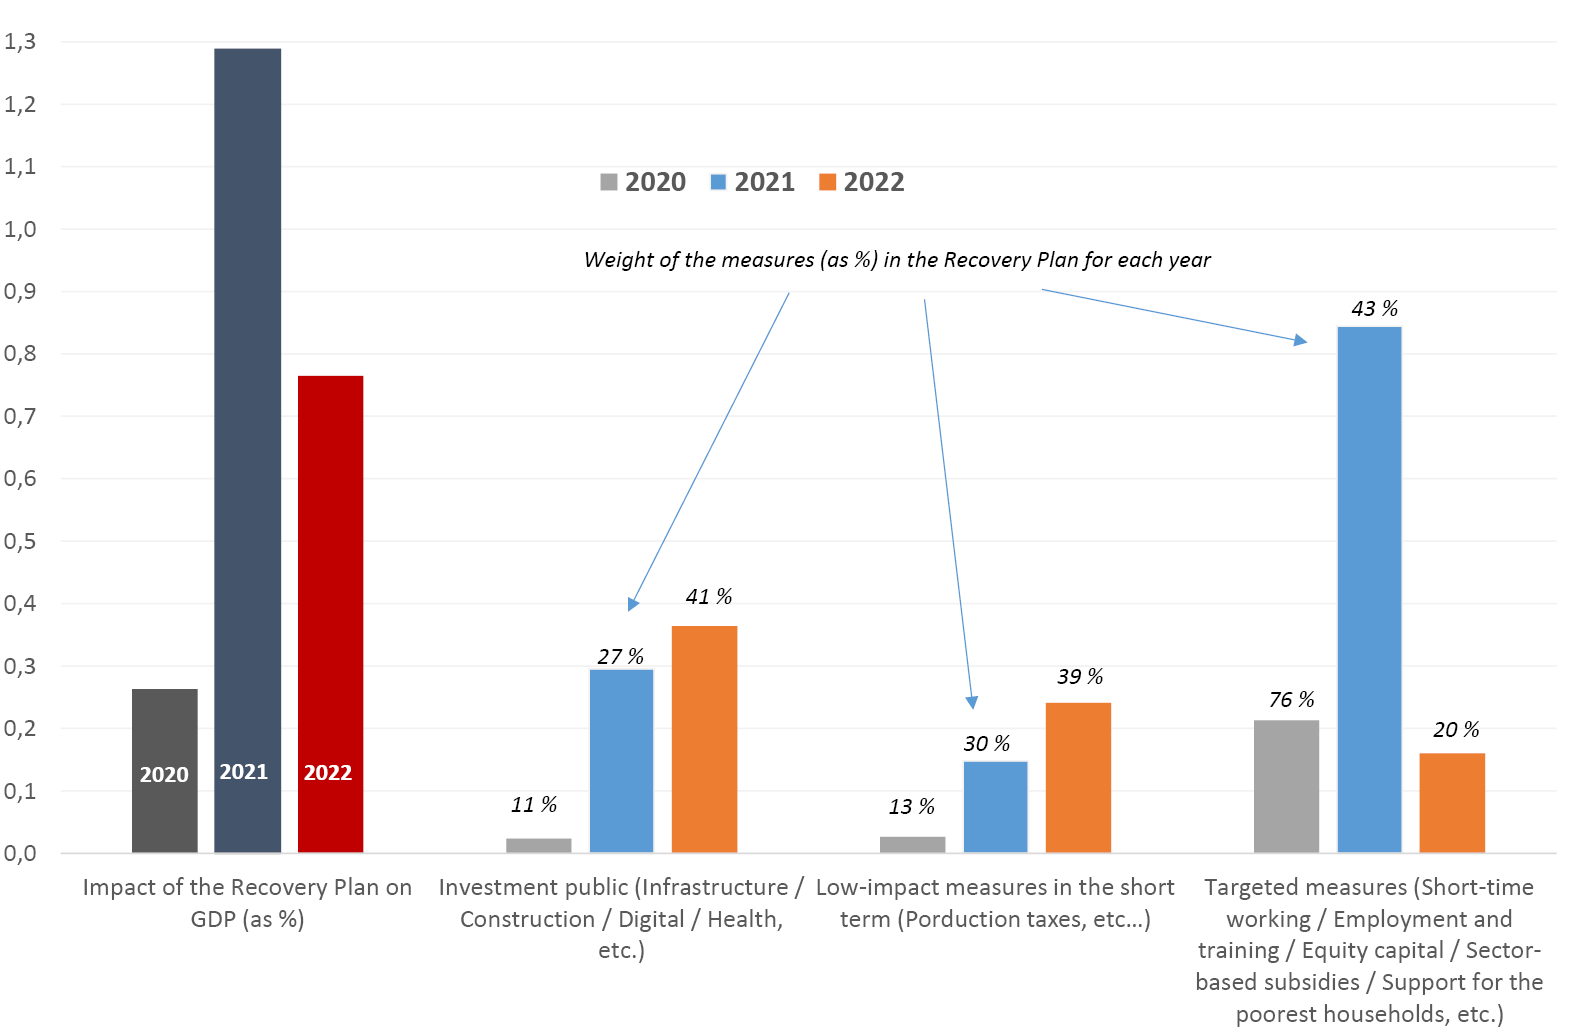
Fig. 5 Impact of the Plan de relance on French GDP and Breakdown by Three Categories of Measures, % of GDP.
Source of data: Draft budget for 2021, French Plan de relance Digest, Stability Programm 2021–27, and OFCE forecasts.
2.4 Conclusion
In the run-up to the COVID-19 crisis, France followed the trend of all the European countries, who in the past decade have seen public investment decrease quite substantially and capital stock deplete. It is true that, thanks to the sustained investment dynamics of previous decades, France ranks highly in both the quantity of public capital and the quality of its infrastructures; but in terms of flows, it is today near an all-time low. The reversal started at the time of the Global Financial Crisis of 2008. Despite the rhetoric of the time, national account data show that it was not countered with a public investment push: the sharp increase of debt between 2007 and 2017 did not correspond to an accumulation of public capital. On the contrary, investment paid the heaviest toll in the subsequent consolidation phase, when both expenditure reduction by the central government and cuts to transfers to local administrations (the largest owner of non-financial assets) resulted in a significant loss of public capital. Thus, in the space of a decade, the French general government saw its net investment drop to very low levels, and its net worth decrease by fifty points of GDP, to an all-time low in 2018. An even greater source of concern is that the previous increase of the net worth, in the 2000s, is mostly attributed to a price effect of non-produced non-financial assets (land and real estate; see Plane and Saraceno 2020, for details).
In 2018 and 2019, thanks—amongst other things—to the electoral cycle associated with the municipal elections, public investments seemed to recover slightly. But with the pandemic and the harsh lockdown of spring 2020, it dropped brutally in the second quarter of the year. Despite the subsequent rebound, its overall level for 2020 marks yet another drop.
The European Commission, led by Ursula von der Leyen, that took office in late 2019 has put public investment, most notably in ecological transition and digitalisation, at the centre of its agenda. These priorities were carried into the massive effort for the recovery that the Commission has launched with the Next Generation EU programme, more specifically with the Recovery and Resilience Facility. France has decided to embed the Facility grants financing in its Plan de relance that, over two years, will devote €100 bn to recovery (of which €36.7 bn will go to public investment), so that the effects of the pandemic will definitively be left behind. The Plan de relance allocates the funds along the guidelines given by the Commission, with particular emphasis (compared to other countries) on the green component.
This effort is quite considerable, but it is certainly not going to be enough for the task of completing the modernisation and the greening of the French economy.There will certainly be the need for further long-term investment plans. This is why, past the pandemic, the emphasis will go back to national fiscal policies. Most of the essays contained in the previous volume of the European Public Investment Outlook (Cerniglia and Saraceno 2020), including our chapter on France, called for a preferential treatment for investment (a “golden rule”). The consultation process on the reform of the Stability Pact, slowed down by the pandemic, is now in its final stages, and the Commission will formulate a reform proposal in the coming months. A golden rule, even if limited to some categories of spending such as digitalisation and ecological transition, would be particularly important for a large economy like France, in which domestic demand and sustained investment (both public and private) are necessary to ensure long-term growth.
The explosion of public debt during the pandemic might nevertheless force us to be cautious of the capacity to carry on the necessary public investment efforts. In other words, it is legitimate to ask whether the fiscal space exists for the massive investment in key sectors such as ecological transition. Global public debt has reached a level that is unprecedented, exceeding the peak reached during World War II (IMF 2021). This is not the case for France’s public debt, which could nevertheless reach a high level of 116% of GDP in 2021, according to the most recent figures, i.e., eighteen points of GDP more than in 2019, and nearly sixty points more than in 2007. Nevertheless, this unprecedented rise of public debt emerges in a context of historically low levels of interest rates (Ragot 2021), that are at or close to zero for maturities of up to ten years. It should be remembered that the French State raised, at the beginning of 2021, a record amount of seven billion fifty-year at a fixed rate of 0.59%, attracting in the process orders for seventy-five billion. The peculiarity of this period, therefore, is that despite historically high debt levels, interest payments for France have never been so low in the past forty years. Since 2007, the effective cost of debt has been decreasing because of falling effective interest rates. This tendency towards subdued interest rates is likely to persist, in a situation of structural excess savings. This, in turn, will keep central bank policy rates close to the current zero or negative rates over the medium run.
The widespread increase of public debt is, of course, the unintentional result of the 2008 and COVID-19 crisis. But it is also the result of a political choice, made possible in an environment of low interest rates, in order to stabilise aggregate demand and avoid a sharp rise in unemployment. The near-zero interest rates on long maturities offers France a real opportunity to invest in projects with high economic, social, and environmental returns and to enhance its potential growth. This long-term investment policy, with returns larger than costs, would be a wise economic choice. Markets and the ECB are handing to France the opportunity to strengthen its economy and improve competitiveness, as well as the wellbeing and standard of living of its population, while at the same time improving sustainability, thanks to better long-term growth prospects. It would be a shame to let this opportunity slip. The new investment plan to “build the France of 2030”, presented in October by President Macron, goes in this direction, and this is a good thing for the French economy.
References
Cerniglia, F. and F. Saraceno (eds) (2020) A European Public Investment Outlook. Cambridge: Open Book Publishers, https://doi.org/10.11647/obp.0222.
Creel, J., E. Heyer and M. Plane (2011) “Petit Précis de Politique Budgétaire Par Tous Les Temps: Les Multiplicateurs Budgétaires Au Cours Du Cycle”, Revue de l’OFCE 116: 61–88, https://doi.org/10.3917/reof.116.0061.
Ducoudré, B., M. Plane, R. Sampognaro and X. Timbeau (2020) “The French Recovery Strategy―Setting the Course for a Climate-Neutral and Digital Future?”, Europa, Friedrich-Ebert-Stiftung, December.
Le Garrec, G. and V. Touzé (2020) “Le Multiplicateur d’investissement Public: Une Revue de Littérature”, OFCE Working Papers, December.
IMF (2021) IMF Fiscal Monitor: A Fair Shot, April, https://www.imf.org/en/Publications/FM/Issues/2021/03/29/fiscal-monitor-april-2021.
Plane, M. and F. Saraceno (2020) “Public Investment and Capital in France”, in F. Cerniglia and F. Saraceno (eds), A European Public Investment Outlook. Cambridge: Open Book Publishers, pp. 33–48, https://doi.org/10.11647/obp.0222.02.
Ragot, X. (2021) “More or Less Public Debt in France?”, OFCE Policy Brief 86, 9 March.
1 Our evaluation is focused only on the Plan de relance and doesn’t consider the emergency measures for 2020–21 which represent 7.2% of GDP. The main objectives of these short-term measures are to maintain revenues of households and firms, limit job destruction, and fund emergency health expenditures.