
7. Crowding In-Out of Public Investment1
© Chapter Authors, CC BY-NC-ND 4.0 https://doi.org/10.11647/OBP.0280.07
Introduction
Public investment stands apart as a fiscal instrument to boost growth. Not only can it boost economic activity in the short term, it can also increase the productive potential of the economy by raising the capital stock and thus productivity. This is particularly important for countries that seek to support economies through crises but that, at the same time, need to boost long-term growth and thus, protect fiscal space (IMF 2020). This is the situation many advanced economies face as they seek to kickstart their economies, after having shut them down in order to prevent the propagation of COVID-19. In Europe, the EU Recovery Fund is a €750 bn plan, financed at the EU-level, that has a strong focus on public investment.
This modern view of the effect of public investment owes a lot to Keynes. Prior to the publication of The General Theory of Employment, Interest and Money in 1936, the conventional wisdom was that an increase in public investment would lead to an equivalent decrease in private investment, so that the level of aggregate output would be unchanged. This concept of “crowding out” was challenged by Keynes: when prices are rigid in the short run, aggregate demand determines the level of output, and markets adjust via quantities rather than prices. Under this model, there is room for governments to support economic activity by increasing public investment. This argument is summarised by the concept of the “fiscal multiplier”:2 “when there is an increment of aggregate investment, income will increase by an amount which is k times the increment in investment” (Keynes 1936, p. 115).
The public “investment multiplier” can thus be defined as the ratio between the variation in output and the variation in public investment. In The General Theory, the main determinant of the multiplier is the marginal propensity to consume (MPC);3 that is, how much of their extra euros of disposable income households spend on consumption. When the MPC is close to unity, small changes in investment lead to large increases in economic activity because spending (and thus employment and workers’ incomes) reacts strongly to income. However, if the MPC is close to zero, the multiplier is low. Keynes thought that the MPC would fall between these two bounds but be closer to unity, which would imply a large public investment multiplier.
Arguments that run counter to this Keynesian view also have a long tradition, and include: the “Treasury view” of crowding out, according to which government borrowing to finance fiscal expansion would lead to a full crowding out of private investment,4 which is why deficits should be reduced to boost confidence (this view is echoed in the current debate on expansionary fiscal consolidation; see Alesina et al. 2019); the “Monetarist view” of Friedman (1957), according to which consumers respond only to changes in permanent income, and thus the impact of an unexpected temporary increase in income is going to be small; and the “Classical view”, according to which an expansionary fiscal policy cannot boost aggregate demand, because private agents have rational expectations and increase their savings in anticipation of a rise in future taxes (the “Ricardian equivalence”; see Ricardo 1820, and Barro 1974).
However, the Keynesian view has been mostly supported by the data, as this chapter will show. Section 2 of the chapter gives a few examples of the existing literature and reports the results of a meta-analysis of Gechert and Rannenberg (2018). Section 3 will present some of the conditions that can lead to strong crowding in. Section 4 provides information on EU structural funds and the EU Recovery Fund, and discusses, in light of the recent literature, whether the EU Recovery Fund is likely to crowd in private investment and private activity in the sectors most hit by the COVID-19 crisis.
7.1 Modern Estimations of the Fiscal Multiplier
The empirical literature of the effect of fiscal policy on growth has bloomed since the 2008 Global Financial Crisis (GFC). The renewed interest is due to the fact that many governments launched recovery plans to boost their economies during the GFC. Responses to the COVID-19 pandemic are benefiting from this experience (IMF 2020). Recent empirical estimations (summarised in the meta-analysis of Gechert and Rannenberg (2018); see Figure 1) find that the fiscal multiplier is relatively high for public investment, possibly because public investment has the potential to crowd in private investment and support long-term productivity growth. For instance, Abiad et al. (2016) use investment forecast errors produced by the IMF to identify the effect of government investment, and find that increasing public investment by 1% of GDP increases GDP by about 0.4 in the short term and by 1.4 in the medium term (i.e., a short-run multiplier of 0.4 and a medium-run multiplier of 1.4).
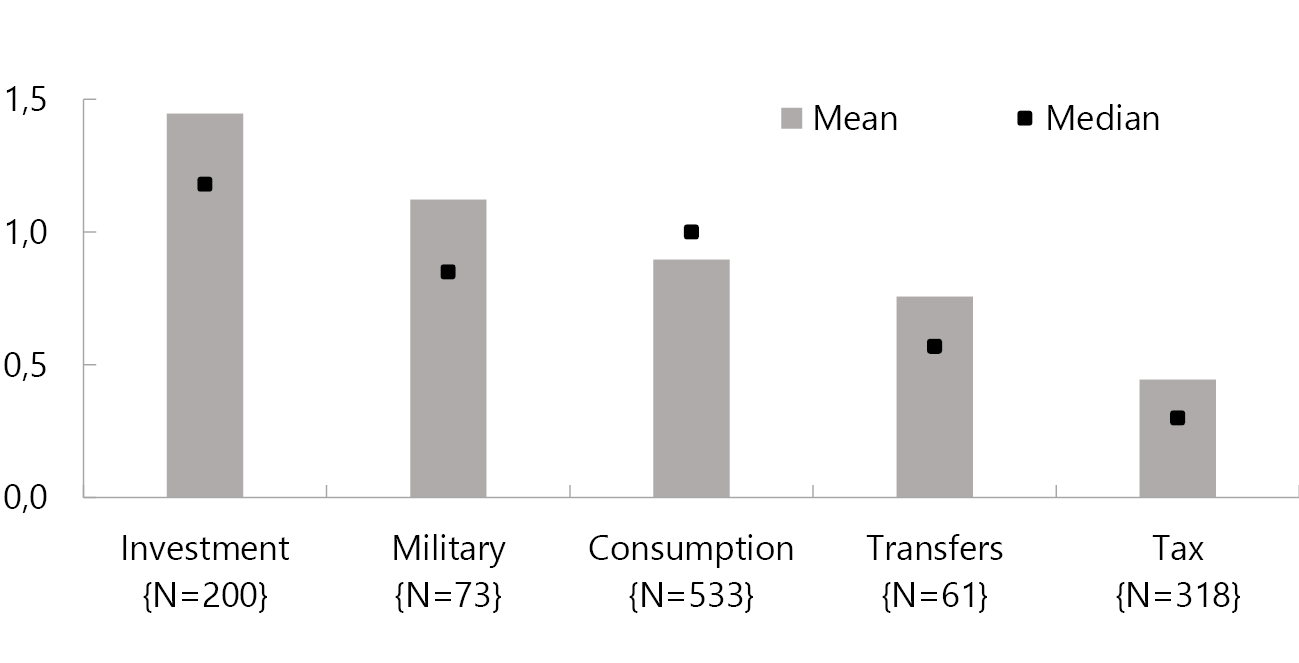
Fig. 1 Reported Fiscal Multipliers.
Source of data: Gechert and Rannenberg (2018).
Note: n denotes the number of papers.
Eden and Kraay (2014) estimated the causal effect of public investment on private investment by using the variation in loan disbursements from official creditors in thirty-nine low-income countries. They found that one additional dollar of public investment leads to an increase in private investment by about two dollars. Some estimations based on subnational data also found large fiscal multipliers for public investment. Leduc and Wilson (2012) use US state-level funding for highways and estimate a multiplier of public infrastructure of about 1.7. Coelho (2019) finds that EU structural funds have a multiplier of around 1.7.
7.2 Conditions under Which Crowding In Is More Likely
The above summary hides several factors that can affect the extent of crowding-in. Keynes had anticipated some of them: (i) in an open economy, part of the benefits of investment will accrue to foreign economies, lessening the effect of the multiplier on domestic economic activity; (ii) following a fiscal expansion, the increase in “confidence” could increase the preference for liquidity and thus decrease the MPC; (iii) when firms have limited capacity, any attempt to increase investment is likely to lead to an increase in inflation; and (iv) the central bank may respond by tightening monetary policy, which would reduce private investment.
Recent research has emphasised the role of business cycles and monetary conditions. A fiscal stimulus may be less effective during expansions, because at full capacity, the short-term effects of an increase in public investment on output are limited, leading to crowding out of private investment and private demand, and higher prices. Moreover, in times of recession, the proportion of credit-constrained households and firms which can adjust spending in response to a change in disposable income is higher. Most of the literature finds that fiscal multipliers are larger during recessions, when there is economic slack, than during expansions (Gechert and Rannenberg 2018; Baum et al. 2012; Auerbach and Gorodnichenko 2013). Auerbach and Gorodnichenko (2013) reported a fiscal multiplier of up to 3.5 during downturns and a statistically insignificant multiplier during upturns, in a sample of OECD countries over the period from 1985 to 2010.
Public investment multipliers also tend to be larger when monetary conditions are accommodative (Erceg and Lindé 2014; Christiano, Eichenbaum, and Rebelo 2011; Coenen et al. 2012). In particular, multipliers are larger when interest rates do not increase in response to the fiscal expansion (for instance, because the economy would need negative interest rates that are much below the feasible policy interest rate, which is, in practice, close to zero). The literature on the effect of temporary government purchases suggests that accommodative monetary conditions increase the size of fiscal multipliers by a factor of two to three. Relatedly, multipliers tend to be larger in countries that follow a fixed exchange rate regime (which includes members of a currency union), because monetary policy does not offset the fiscal policy shock, thus remaining more accommodative. Empirical estimates find that countries that follow a fixed exchange rate regime have long-run fiscal multipliers that are larger by a third (Born et al. 2013; Ilzetzki et al. 2013; Karras 2011).
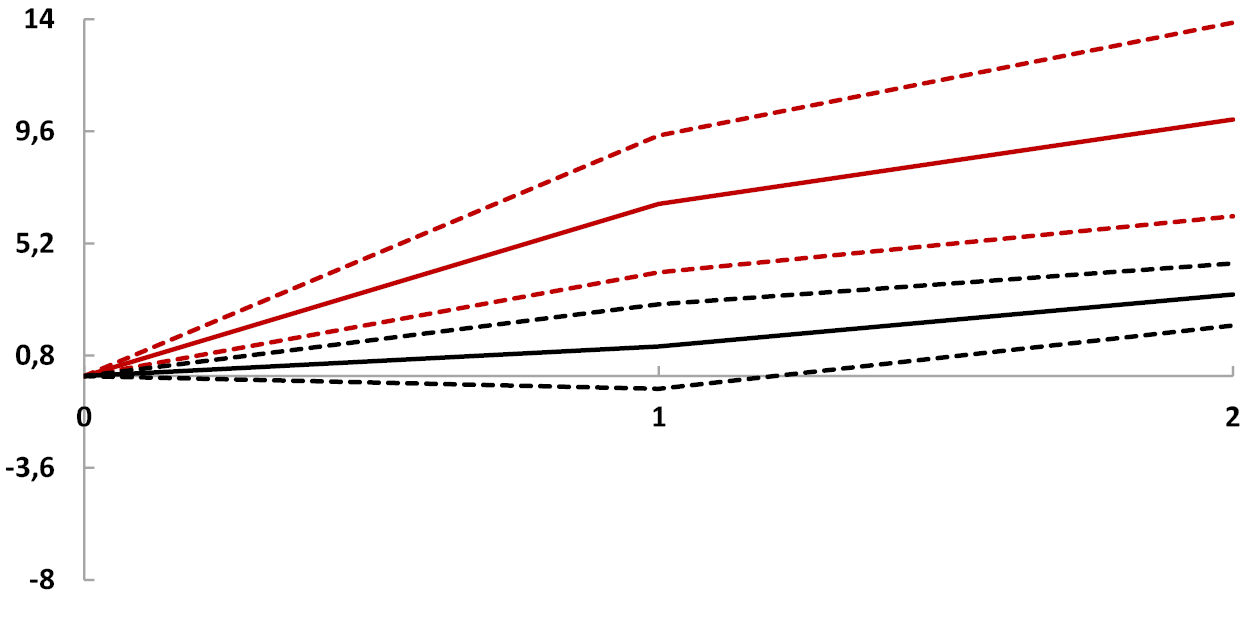
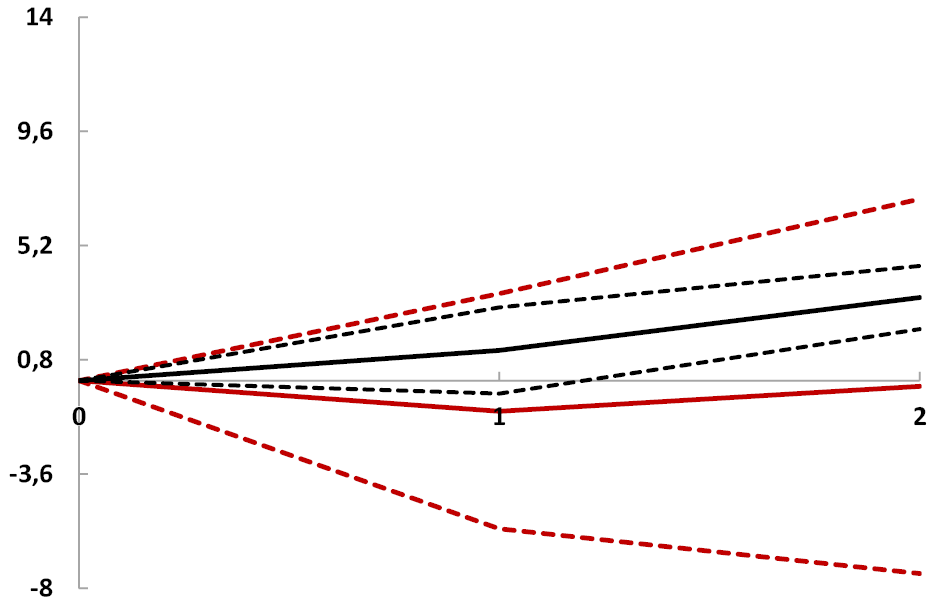
In periods of high macroeconomic uncertainty, public investment can also crowd in private investment if it affects private sector confidence. This is important at the current juncture, as the medium-term economic outlook crucially hinges on the race between a mutating virus and the deployment of effective vaccines. Uncertainty has been found to reduce firm-level investment (see Guiso and Parigi 1999, or Bloom 2014, for a review), and some have suggested that high levels of uncertainty could also make firms and consumers less responsive to fiscal stimulus (Bloom et al. 2018; Alloza 2018). At the same time, uncertainty could increase the fiscal multiplier if public investment shocks improve private agents’ expectations about the economic outlook, thereby generating a positive and stronger private response (Farmer 2010; Bachmann and Sims 2012). Indeed, Gbohoui (forthcoming) finds that public investment shocks boost private sector confidence during periods of high uncertainty, leading to large multipliers of up to 2.7 over two years, compared to a multiplier of 0.6 in a linear version of the model (Figure 2). The crowding in of private investment is also stronger in periods of high uncertainty. Private investment increases by more than 10% over a period of two years, after an initial public investment increase of 1% of GDP. A possible reason behind this result is that public investment shocks signal future improvement in productivity, driving up the private sector’s expectations about future growth, which leads to higher private investment. During periods of low uncertainty, public investment shocks do not seem to have effects on the economy. These results extend to a panel of countries, the findings by Arčabić and Cover (2016) for the US, and Berg (2019) for Germany, that reported fiscal multipliers larger than two during periods of high uncertainty.
|
Response under high uncertainty (red, based on non-linear model) vs. average response (black). |
Response under low uncertainty (red, based on non-linear model) vs. average response (black) |
|
|
Fig. 2 Uncertainty and Crowding-In Effects: Public Investment on Private Investment.
Source of data: Gbohoui (forthcoming, IMF Working Paper).
Note: Macroeconomic uncertainty is measured by the standard deviation of GDP growth rate forecasts across professional forecasters as published by Consensus Economics, using the spring vintage for each year. Investment shocks are identified as forecast errors of public investment spending relative to GDP. t=1 is the year of the shock; non-linear (linear) estimates are plotted in red (black); dashed lines denote 90% confidence bands. The effects represent the response, in percentage change, to an unexpected increase of public investment by 1% of GDP.
The composition of the investment package also matters for its effect on private investment, especially in the long run. For instance, crowding-in effects can be larger if the package prioritises sectors with large positive externalities (Arrow 1962; Romer 1986) or if it fosters innovation (Moretti et al. 2019; Agenor et al. 2015). From a theoretical standpoint, the private sector’s response to increases in public investment should be larger when newly installed public capital complements private capital (Aschauer 1989). For example, Fernald (1999) found that US industries that are more vehicle intensive have a disproportionate increase in productivity after the construction of roads (see also Lanau 2017). In recent years, the literature also suggests that public spending on environmentally friendly investment is likely to crowd in more private investment. Batini et al. (2021), for instance, find an impact multiplier of 1.2 for renewable energy investment and of 4.1 for nuclear energy investment, but the multiplier is only 0.65 for “brown” energy investment.
The quality of public investment, which will depend on the institutional, legal, and regulatory frameworks, is also fundamental. Short-term multipliers are likely to be lower when resources are diverted—for instance, because of corruption—and public inefficiencies in project planning, allocation, and implementation can result in less productive public capital in the long term.5 Even though there is no fully satisfactory metric of public investment “quality”, several measures and indexes are commonly employed. Among these, the IMF Public Investment Management Assessment (PIMA) score summarises information on institutional designs drawn from all three stages of the investment cycle (planning, allocation, and implementation), while the IMF Public Investment Efficiency Indicator (PIE-X) estimates the relationship between the public capital stock and indicators of access to and the quality of infrastructure assets.6 The empirical literature has confirmed that fiscal multipliers are higher in countries with strong public investment management (Abiad, Furceri, and Topalova 2016; Myamoto et al. 2020).
In addition, recent research has noted that crowding in is unlikely to materialise if public or private balance sheets are weak. A higher level of public debt is associated with low or even negative fiscal multipliers in the long run, a result obtained at both the country level (Ilzetzki et al. 2013) and the subnational level (Huang et al. 2020). Using firm-level data across sixty-nine countries, Huang et al. (2018) documented a negative correlation between public debt and corporate investment. One possible explanation is that public debt increases the correlation between investment and cashflow for firms that are credit constrained.
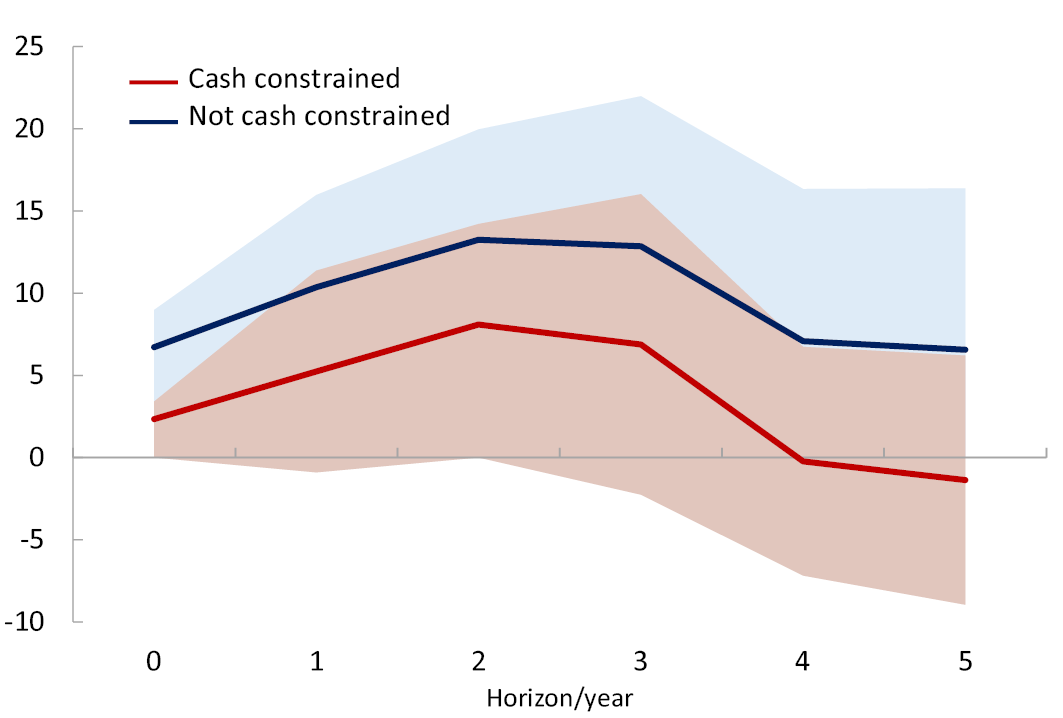
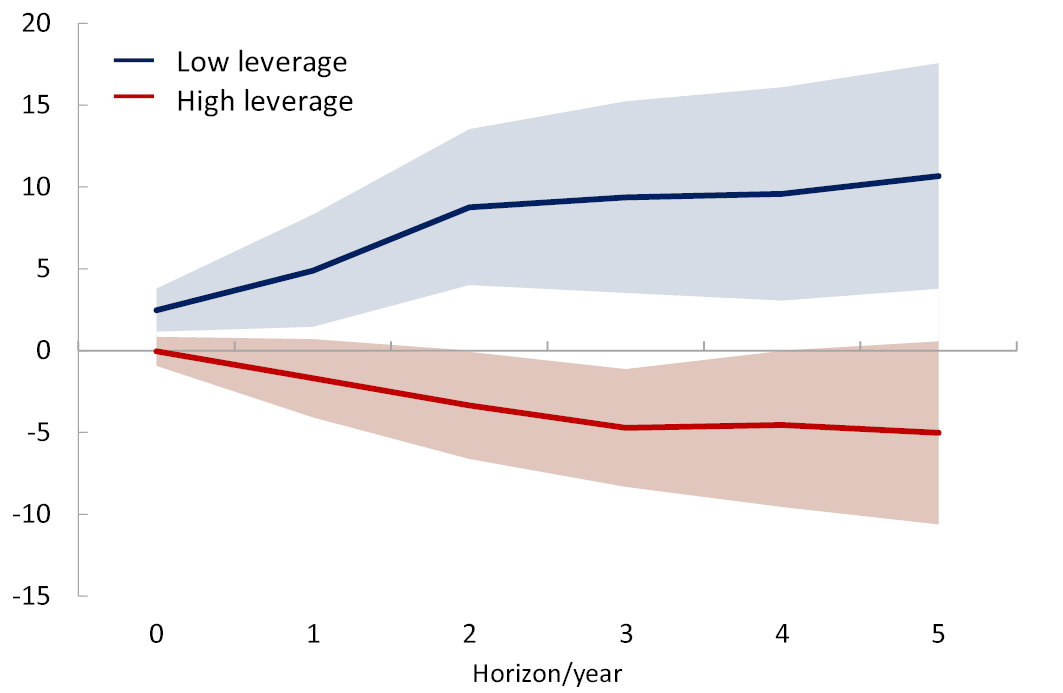
Finally, the effect of an increase in public investment on private investment also depends on the strength of corporate balance sheet. Espinoza, Gamboa-Arbelaez, and Sy (2020) show that financial constraints matter for the effect of public investment on corporate investment. In particular, the authors find that an increase of public investment by 1% is associated with an increase in net investment rate of private firms by 2.3% on average, but for firms that are not liquidity constrained, net investment increases by 6.7%. Similarly, high leverage can discourage firms to invest, because new investment financed by additional debt could induce future low cashflows (Myers 1977), a theory confirmed by the data (Figure 3).
|
1. By liquidity constraint |
2. By leverage |
|
|
Fig. 3 Effect of Public Investment on Private Firms’ Net Investment (in Percentage Change of an Increase of Public Investment by 1%)
Source of data: Espinoza, Gamboa-Arbelaez, and Sy (2020).
7.3 Lessons for the European Union
7.3.1 Public Investment and EU-Financed Investment in the Post-COVID Recovery
The pivotal role of the European funds in directing and supporting economies and investment has recently gained the spotlight, with the finalisation, in 2020, of a Recovery Fund (Next Generation EU, NGEU) to both buffer the negative effects of the COVID-19 pandemic, and to promote a transition towards more sustainable and more efficient means of production, through the disbursement of loans and grants. Given the heterogeneity in the intensity of the impact of the COVID-19 pandemic across countries and regions, the current programme sits well within the Cohesion Policy objective of ensuring medium-term income convergence in the EU. The concern is that the pandemic had highly asymmetric regional effects (OECD 2020), which have depended on the degree of exposure to tradable sectors and global value chains, and the reliance on the tourism industry. Of particular relevance is the disruption suffered by the agri-food sector (European Parliament 2020a), which exemplifies the fragility of complex production networks in the face of a systemic shock. Importantly, the crisis is showing that peripheral (still-converging) regions are suffering more than others (European Commission 2020a).
The NGEU offers an unprecedented mechanism to counteract a major crisis episode (through the Recovery and Resilience Facility, RFF), both in terms of resources and characteristics; for instance, the firepower of NGEU amounts to approximately €750 bn, committed over a period going from 2021 to 2024, which adds to the planned 2021–27 EU budget, for a total sum of around €1.85 tn (approximately 13% of EU GDP). NGEU is financed by borrowing on capital markets, in stark contrast with the regular EU budget, which has historically been funded using the EU’s own resources. The European Commission projects the total economic impact generated by the RRF to be approximately 1.2% of 2019 EU real GDP, over the 2021–22 forecast horizon (European Commission 2021).
NGEU financing is primarily tilted towards public investment, which constitutes 87% of the total allocated expenditure (D’Alfonso 2020). NGEU could thus push future private investment towards economic sectors that are likely to be essential to ensure resilience and prosperity, such as digital communication, transportation infrastructure, sustainable farming, and clean energy. In this sense, the current crisis offers an unprecedented opportunity for public policy to advance its footprint on fundamental challenges, such as climate change and the erosion of natural ecosystems, by steering the national investment away from a production system strongly unbalanced toward polluting and unsustainable activities (see European Energy Agency 2021).
NGEU adds to the funds that the EU traditionally employs to reduce disparities between development levels and to promote the catch-up of lagging regions. As of today, the EU relies on five major funds: the European Regional Development Fund (ERDF), the European Social Fund (ESF), the Cohesion Fund (CF), the European Agricultural Fund for Rural Development (EAFRD), and the European Maritime and Fisheries Fund (EMFF). Together, these funds currently make up over half of the EU funding budget, and they are commonly referred as the European Structural Investment (ESI) Funds. Importantly, these funds finance both public investment and private investment.
ESI Funds are allocated under different “banners”. The lion’s share of ESI payments is classified under three objectives: payments associated with the Convergence Objective (formerly known as Objective 1) are aimed at stimulating growth in lagging regions (and can only be allocated in regions with a GDP per capita below 75% of the EU average), while payments associated with the Regional Competitiveness and Employment Objective (formerly known as Objective 2) are allocated to regions in structural decline; finally, payments associated with the European Territorial Cooperation Objective (formerly known as Objective 3) are disbursed to support education and employment policies in regions not included under Objective 1. ESI Funds are integrated into an overarching cohesion policy, dating back to 1988. Since then, the EU has gone through five programming periods (Multiannual Financial Frameworks, MFF), that usually lasted seven years each. In the case of the last programme (2014–20), the total budget (including EU financing and national co-financing) equalled approximately €650 bn―around 4% of EU GDP―of which €450 bn was from the EU only.7
Figure 4 describes the evolution of ESI Funds’ (modelled) expenditures across all MFFs to date. The figure highlights the extension of payments beyond the end of each MFF, a feature which stems from a decommitment rule, which allows the recipients to spend the funds after each programme’s end date. Interestingly, the 2014–20 period shows a significant slowness in disbursements. Despite this trend, 94% of the budgeted European Structural and Investment Funds (ESIF) had been allocated by the end of June 2020, and 47% had already been spent, on average.8 Figure 5 summarises these dynamics, by showing the share of EU funds payments as a percentage of the planned amount, for all EU countries. The issue of slow spending of EU funds can be attributed to several factors, including low project approval rate and delays in execution in some countries, but also the decommitment rule itself; these patterns are relevant from a policymaker perspective, since they raise concerns on the effectiveness of ESI Funds to provide an effective short-term stabilisation tool against unexpected adverse macroeconomic shocks (see Carrion Alvarez 2020).
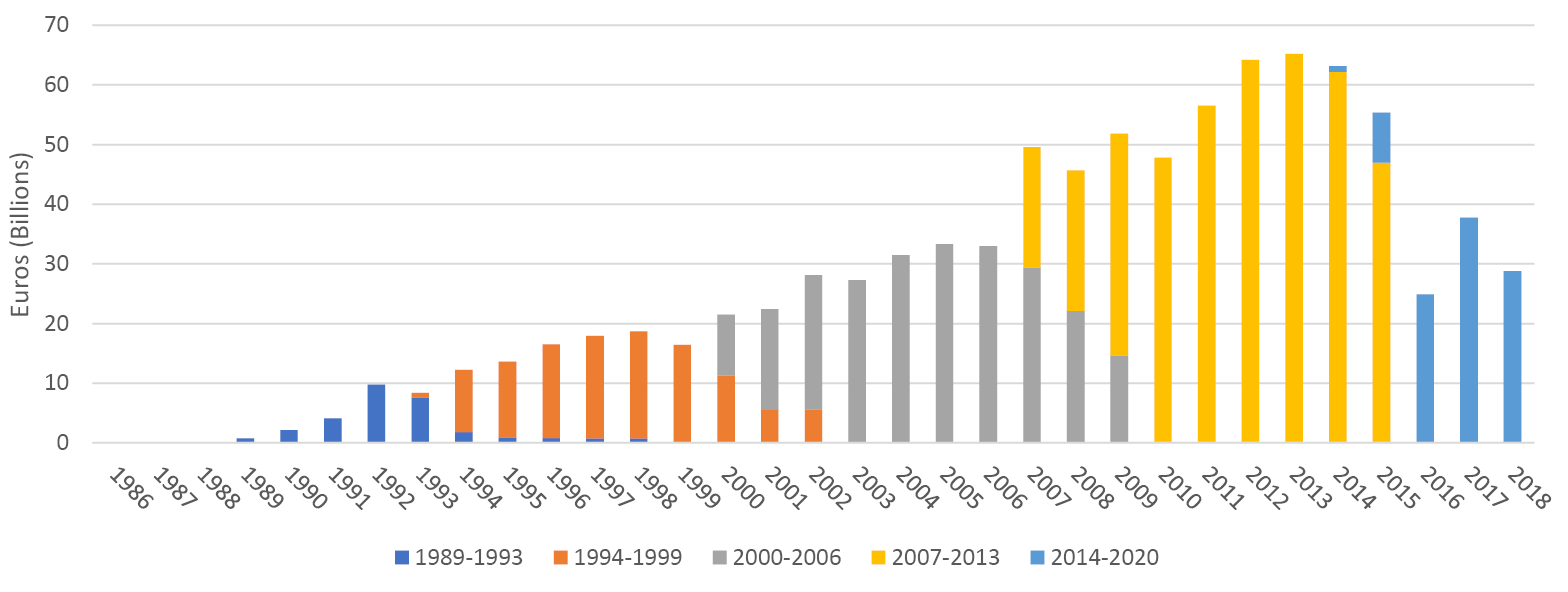
Fig. 4 ESI Funds Modelled Expenditures.
Source of data: Annual EU budget payments (EUR) made by programme period, available at https://cohesiondata.ec.europa.eu/Other/Historic-EU-payments-regionalised-and-modelled/tc55-7ysv.
Within the context of the ongoing pandemic, many regulations surrounding the use of EU funds have been amended to allow for more flexibility and to increase the speed of project implementation (European Parliament 2020b). Among the major amendments is the temporary suspension of the principle of additionality, which originally required ESI Funds not to replace the national or equivalent expenditure by a member state. While co-financing might prevent crowding out of private capital in normal times, this concern is unwarranted in a crisis, when private investment is depressed because of ongoing uncertainty. Thus, the NGEU framework does not include the need for co-financing. Other amendments to ESI Funds include the exemption from the need to comply with thematic concentration requirements and the possibility of receiving EU support on expenditures related to operations fostering crisis-response capacity to the COVID-19 outbreak.
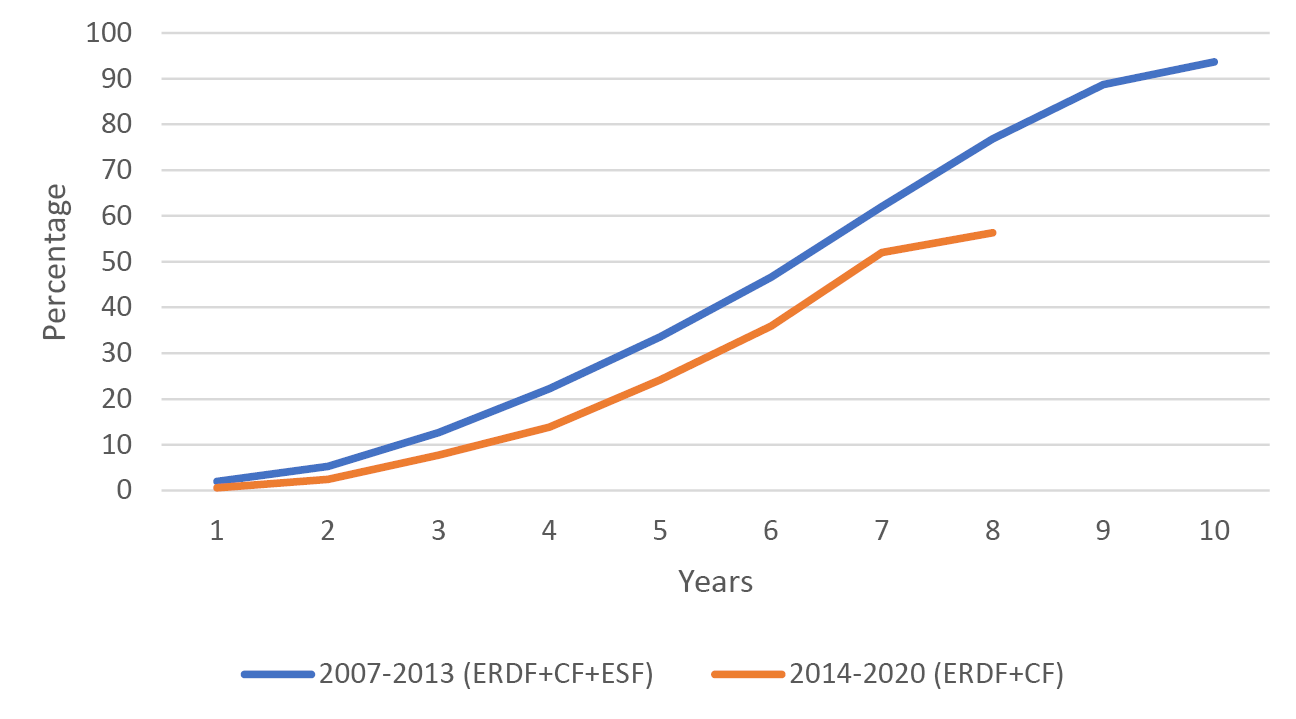
Fig. 5 Historical ESI Funds Payments as a % of Planned Amounts.
Source of data: Author’s calculations.
Note: Absorption rates for the 2007–13 MFF are from the Commission’s “SF 2007–2013 Funds Absorption Rate” dataset available at https://cohesiondata.ec.europa.eu/2007-2013-Finances/SF-2007-2013-Funds-Absorption-Rate/kk86-ceun/data; the 2014–20 data is based on the Commission’s “Regional Policy 2014–2020 EU Payment Details by EU Countries” dataset available at https://cohesiondata.ec.europa.eu/2014-2020-Finances/Regional-Policy-2014-2020-EU-Payment-Details-by-EU/vs2b-dct3/data.
7.3.2 The Crowding In Effects of EU Funds
Given the size and scope of the EU investment policy for growth and regional convergence, it is essential to quantify the impact of such programmes on growth and both private and total investment; indeed, a requirement for accessing the EU Recovery and Resilience funds has been that member states provide detailed plans that also include a description of how the EU funds will contribute to promoting the EU’s economic, social, and territorial cohesion and also mitigate the social and economic impact of the crisis (see European Commission 2020b).
A large literature has estimated the growth effects of EU funds at a regional level; for example, Hagen and Mohl (2010) estimated that a 1% increase of Objective 1 payments leads to a small but positive impact on the regional GDP per capita by approximately 0.5%. A more positive assessment was provided by Becker, Egger, and Von Ehrlich (2010), who found that for every euro spent on Objective 1 transfers, GDP increases by €1.20. A common denominator in both studies is that having access to Objective 1 status does not immediately lead to higher growth, and several years are needed to show significant effects. Coelho (2019) analysed the response of output to Objective 1 EU funds, at the regional level, over the period 2000–13 and found large regional output multipliers, averaging 1.7 on impact in the poorest regions, and with a cumulative effect reaching a value of 4 after three years (after adjusting for co-financing). Canova and Pappa (2021) offered a more nuanced approach by studying ERDF and ESF funds separately, and finding that, on average, in the case of ERDF (ESF), an increase corresponding to 1% of regional GVA, increased GVA cumulatively by 1 (5.1)%, employment growth by 0.9 (1.6)%, and investment growth by 1.3 (4.3)%, cumulatively over a three-year horizon. The authors also underscored how these average figures hide significant heterogeneities across time and space.
In this respect, the literature also highlighted that these multipliers depend on the initial level of economic development. Becker, Egger, and Von Ehrlich (2013), for example, concluded that only in regions where there is sufficient human capital, and enough institutional quality, do transfer programmes increase growth (see also Breidenbach, Mitze, and Schmidt 2016, and Ederveen, De Groot, and Nahuis 2006).
There are very few studies that move beyond regional multipliers to estimating national multipliers of EU funds. In Durand and Espinoza (2021), which uses national data to assess the crowding-in effect of ESI Funds,9 shocks to investment are computed using associated disbursements from all ESI Funds, following an identification strategy based on an instrumental variable approach first proposed by Kraay (2014), which exploits the time lags between commitments and disbursements of funds. The study also investigates country heterogeneity by looking at crowding-in effects in a selected group of CEE countries where the multiplier would be expected to be large given the fixed exchange rate regime and high quality of institutions.10 The results, presented in Figure 6, summarise the main findings for the EU. The figure shows that ESIF funds crowd in private investment, increase total investment and GDP (with a multiplier of around 1.2), but do not increase employment.11
In addition to analysing aggregate multipliers, Durand and Espinoza (2021) further highlight significant heterogeneities in estimated multipliers across economic sectors. Understanding the heterogeneous impact of EU funds is particularly pressing in the context of both the NGEU and the MFF. Figure 7 reports the responses of EU total investment following ESI Funds shocks, by highlighting only those economic sectors where either the contemporaneous or 1Y multipliers are found to be statistically significant (at the 10% level).
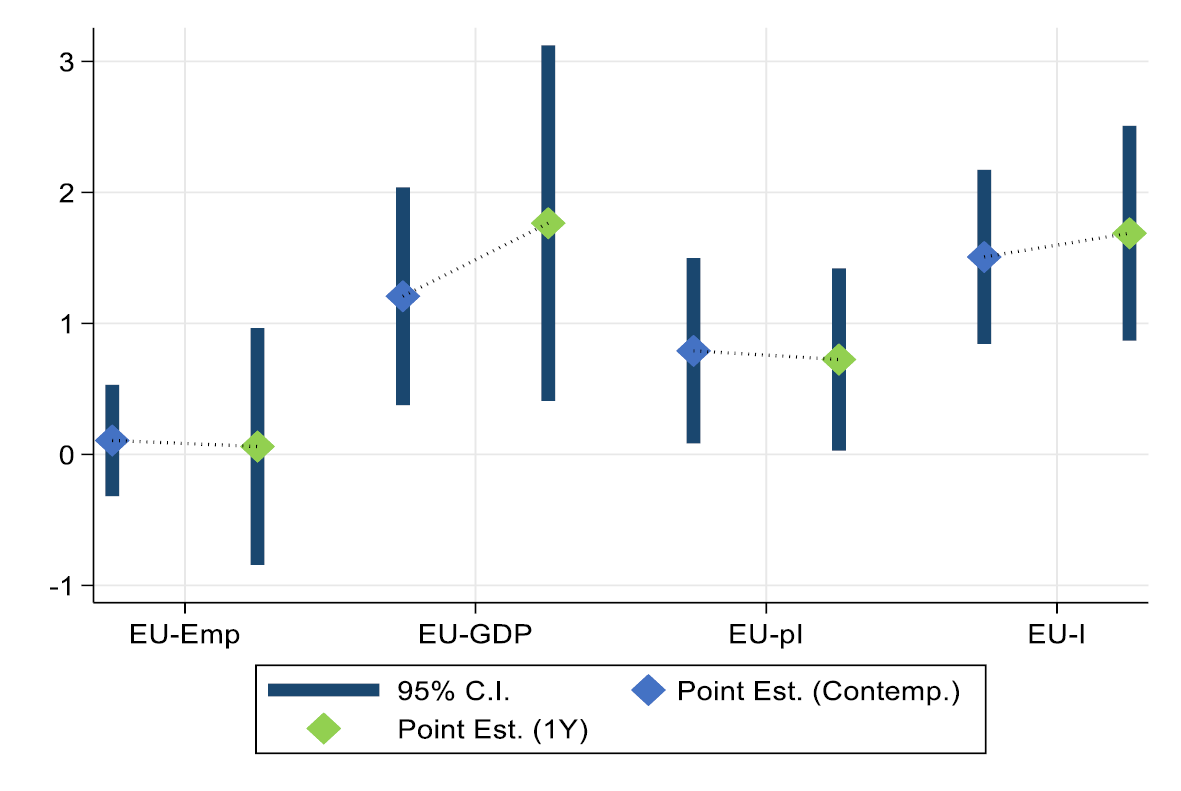
Fig. 6 ESI Funds Multipliers in EU.
Source of data: Durand and Espinoza (2021), and author’s calculations.
Note: EU-GDP refers to the EU-wide impact of a 1% increase in ESI Funds disbursements on GDP. Similar interpretations apply for the case of total investment (I) and private investment (pI). The coefficients are subject to uncertainty, as illustrated by the bars surrounding the point estimates.
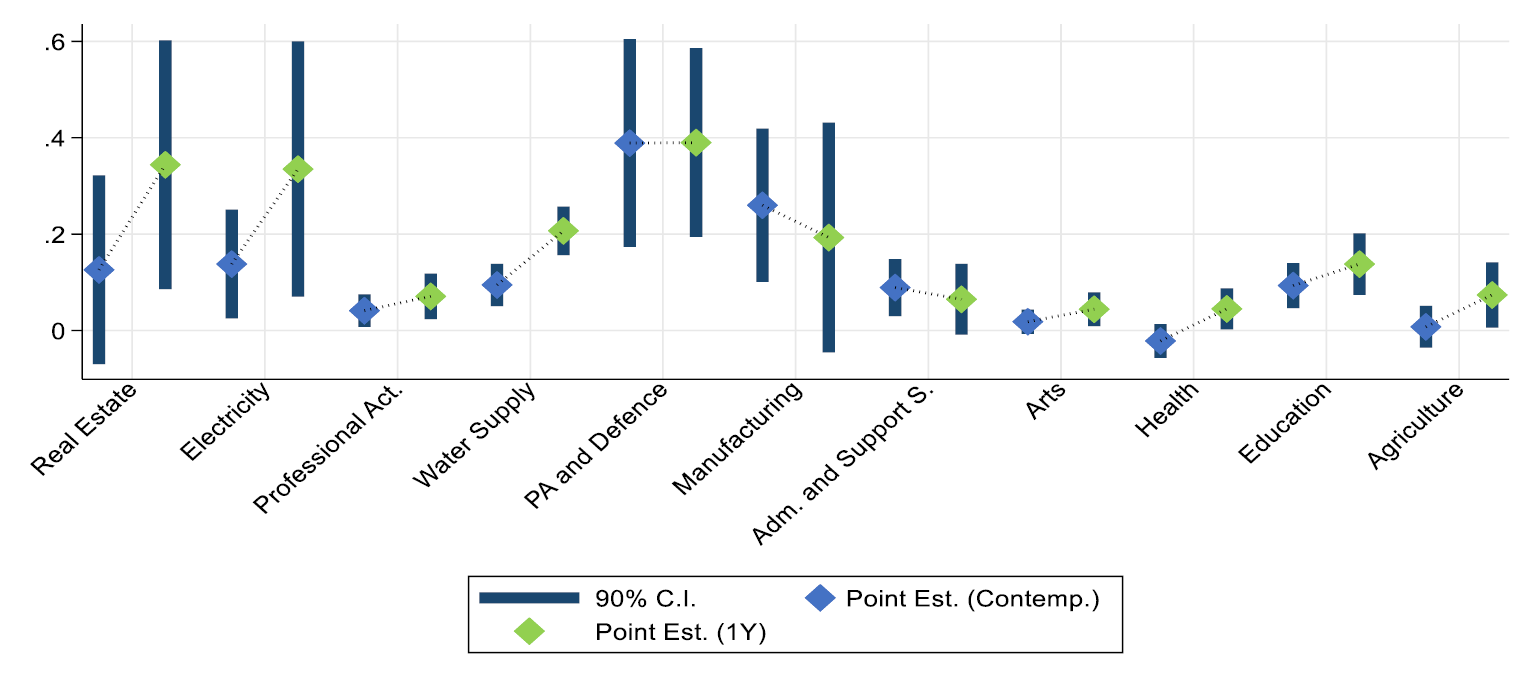
Fig. 7 Total Investment ESI Funds Multipliers in EU across Economic Sectors.
Source of data: Durand and Espinoza (2021), and author’s calculations.
Note: The figure shows the EU-wide impact of a 1% GDP increase in ESI Funds disbursements on total investment across economic sectors (based on the NACE Rev. 2 classification); as an example, the figure suggests that a 1% GDP increase in ESI Funds contemporaneously increases investment in Water Supply by approximately 0.2% of GDP, after one year. The figure only includes the list of economic sectors which contain statistically significant multipliers. The sectors are ordered from left to right based on the degree of labour intensity (defined as sectoral employment/sectoral Gross Value Added). The coefficients are subject to uncertainty, as illustrated by the bars surrounding the point estimates.
An interesting result is that, overall, the list of economic sectors includes many labour-intensive activities such as agriculture, manufacturing, education, and health, which were all hit by the pandemic.
The composition of the funding package itself is also likely to affect crowding in. This is particularly relevant, given that the EU resources are allocated toward a wide variety of economic sectors, with different potentials for crowding in; reassuringly, the NGEU funding programme is well aligned with the theoretical arguments that we reviewed in the previous sections, by focusing on financing activities with potentially large externalities for the rest of the economy, and those that can foster innovation. More precisely, the package supplements short-term support to crisis-stricken sectors, such as manufacturing and health, with longer-term packages, which are tilted towards research and innovation (via Horizon Europe), digital transition (Digital Europe Programme), transportation and energy efficiency (Connecting Europe Facility), and addressing market failures in investment (InvestEU). In parallel to these programmes, the EU will remain engaged in more traditional themes such as regional cohesion (also through REACT-EU), recovery and resilience, security and defence, border and migration, and an efficient European public administration (European Council 2020).
The EU is also extensively engaged in climate actions, as exemplified by the 2030 climate target and the 2050 climate neutrality goal, as part of the so-called European Green Deal. Concerning climate change, the EU recently established a rule that programmes and instruments should contribute to mainstream climate actions and to the achievement of an overall target of at least 30% of the total amount of the EU’s budget and of NGEU expenditures supporting climate objectives.12 In this respect, the EU also established a Just Transition Fund to address the social and economic consequences of the objective of reaching EU climate neutrality. By implementing these directives, the EU is on the right track towards achieving strong multipliers.13
To better appreciate the importance of the composition of the stimulus package, it is useful to review what the existing empirical evidence suggests with respect to sectoral public investment shocks. Durand and Espinoza (2021) follow the Classification of the Functions of Government (COFOG) to study the impact of sectoral public investment on aggregate outcomes, including total investment, in the EU. Their analysis shows strong crowding-in effects across a broad range of sectors (in fact, out of ten COFOG categories, only the category “GF10: Social Protection” does not display significance at both horizons). Importantly, it also suggests that the upcoming NGEU and 2021–27 MFF, with its focus on key themes such as environmental protection and health, is well positioned to give rise to strong multiplier effects.
7.4 Conclusion
The literature and the new results presented in this chapter lend support to the view that the 2021–27 European Multiannual Financial Framework and the recovery packages will be effective in boosting the post-pandemic economy. However, policymakers should remain aware of the long-term implications of public investment, as well as of the potential drawbacks of a governance framework which, given the historical levels of slow absorption, inevitably limits the timely availability of these resources to address unexpected shocks (Bruegel 2020).
These two observations give rise to a tension between efficiency and speed; in particular, policymakers must recognise that increasing absorptions of EU funds should not come at the cost of lower consideration for the value of money being spent, as seems to have been the case in recent years (see European Court of Auditors 2018). Importantly, while speed might be crucial during a time of crisis, the magnitude of the EU funds (especially when giving rise to further debt, as is the case with the NGEU) will inevitably bring long-term implications, both in terms of fiscal sustainability and in terms of long-term economic growth and development, and resilience against future crises. Although it is possible to optimise that trade-off by financing first maintenance spending and smaller and simpler projects (IMF 2020), transformational projects will take more time to implement, and the portfolio of investments will thus have to be carefully balanced to take into consideration the timeliness of an investment stimulus.
References
Abiad, A., D. Furceri, and D. Topalova (2016) “The Macroeconomic Effects of Public Investment: Evidence from Advanced Economies”, Journal of Macroeconomics, 50(C): 224–40.
Agénor, P.-R. and K. Neanidis (2015) “Innovation, Public Capital, and Growth”, Journal of Macroeconomics, 44(C): 252–75.
Alesina A., C. Favero and F. Giavazzi (2019) Austerity: When It Works and When It Doesn’t. Princeton: Princeton University Press.
Alloza, M. (2018) Is Fiscal Policy More Effective in Uncertain Times or during Recessions? Banco de España Working Papers No 1730.
Arčabić, V. and J. Cover (2016) Uncertainty and the Effectiveness of Fiscal Policy. EFZG Working Papers Series No 1611, Faculty of Economics and Business, University of Zagreb.
Arrow, K. (1962) “Economic Welfare and the Allocation of Resources for Invention”. In National Bureau Committee for Economic Research, Committee on Economic Growth of the Social Science Research Council (eds), The Rate and Direction of Inventive Activity: Economic and Social Factors, pp. 609–26. Princeton University Press.
Aschauer, D. A. (1989) “Does Public Capital Crowd-Out Private Capital?”, Journal of Monetary Economics, 24(2): 171–88.
Auerbach, A., and Y. Gorodnichenko (2013) “Fiscal Multipliers in Recession and Expansion”, in A. Alesina and F. Giavazzi (eds), Fiscal Policy after the Financial Crisis, pp. 63–98. University of Chicago Press.
Bachmann, R. and E.R. Sims (2012) “Confidence and the Transmission of Government Spending Shocks”, Journal of Monetary Economics, 59 (3): 235–49.
Batini, N., M. Di Serio, M. Fragetta, G. Melina and A. Waldron (2021) Building Back Better: How Big Are Green Spending Multipliers?, IMF Working Paper 2021/087.
Barro, R.J. (1974) “Are Government Bonds Net Wealth?’’, Journal of Political Economy, 82(6): 1095–117.
Baum, A., M. Poplawski-Ribeiro and A. Weber (2012) Fiscal Multipliers and the State of the Economy, IMF Working Paper 2012/286.
Becker, S.O., P.H. Egger and M.V. Ehrlich (2010) “Going NUTS: The Effect of EU Structural Funds on Regional Performance”, Journal of Public Economics, 94(9–10): 578–90.
Becker, S.O., P.H. Egger and M.V. Ehrlich (2013) “Absorptive Capacity and the Growth and Investment Effects of Regional Transfers: A Regression Discontinuity Design with Heterogeneous Treatment Effects”, American Economic Journal: Economic Policy, 5.4 (2013): 29–77.
Berg, T. (2019) “Uncertainty and the Effectiveness of Fiscal Policy in Germany”, Macroeconomic Dynamics, 23(4): 1442–470.
Berg, A., E.F. Buffie, C. Pattillo, R. Portillo, A.F. Presbitero and L.F. Zanna (2019) “Some Misconceptions about Public Investment Efficiency and Growth”, Economica, 86(342): 409–30.
Bloom, N. (2014) “Fluctuations in Uncertainty”, The Journal of Economic Perspectives, 28(2): 153–75.
Bloom, N., M. Floetotto, N. Jaimovich, I. Saporta-Eksten and S.J. (2018) “Really Uncertain Business Cycles”, Econometrica, 86(3): 1031–065.
Born, B., F. Juessen and G.J. (2013) “Exchange Rate Regimes and Fiscal Multipliers”, Journal of Economic Dynamics and Control, 37(2): 446–65.
Breidenbach, P., T. Mitze and C.M. Schmidt (2016) “EU Structural Funds and Regional Income Convergence: A Sobering Experience”, RUHR Economic Papers n.608.
Bruegel (2020) Will European Union Countries be Able to Absorb and Spend Well the Bloc’s Recovery Funding? Bruegel Blog Post, written by Zsolt Darvas, https://www.bruegel.org/2020/09/will-european-union-countries-be-able-to-absorb-and-spend-well-the-blocs-recovery-funding/.
Canova, F. and E. Pappa (2021) What are the Likely Macroeconomic Effects of the EU Recovery Plan? Pompeu Fabra University.
Carrión Á. M. (2020) What the Absorption of Structural Funds says about the EU Recovery Plan. Funcas Europe, https://www.funcas.es/articulos/what-the-absorption-of-structural-funds-says-about-the-eu-recovery-plan/ .
Christiano, L., M. Eichenbaum and S. Rebelo (2011) “When Is the Government Spending Multiplier Large?”, Journal of Political Economy, 119(1): 78–121.
Coelho, M. (2019) “Fiscal Stimulus in a Monetary Union: Evidence from Eurozone Regions”, IMF Economic Review, 67(3): 573–617.
Coenen, G., C. Erceg, C. Freedman, D. Furceri, M. Kumhof, R. Lalonde, D. Laxton, J. Lindé, A. Mourougane, D. Muir, S. Mursula, C. de Resende, J. Roberts, W. Roeger, S. Snudden, M. Trabandt and J. in’t Veld (2012) “Effects of Fiscal Stimulus in Structural Models”, American Economic Journal: Macroeconomics, 4(1): 22–68.
D’Alfonso, A. (2020) Next Generation EU―A European Instrument to Counter the Impact of the Coronavirus Pandemic. European Parliamentary Research Service Briefing.
Durand, L. & R. Espinoza (2021) The Fiscal Multiplier of European Structural Investment Funds: Aggregate and Sectoral Effects with an Application to Slovenia, IMF Working Paper 2021/118.
Eden, M. and A. Kraay (2014) Crowding In and the Returns to Government Investment in Low-Income Countries, Policy Research Working Papers, World Bank. WPS6781.
Ederveen, S., H. L. F. De Groot and R. Nahuis (2006) “Fertile Soil for Structural Funds? A Panel Data Analysis of the Conditional Effectiveness of European Cohesion Policy”. Kyklos 59(1): 17–42.
European Council (2020) Special Meeting of the European Council―Draft Conclusions, https://www.consilium.europa.eu/media/45109/210720-euco-final-conclusions-en.pdf.
European Court of Auditors (2018) Commission’s and Member States’ Actions in the Last Years of the 2007–2013 Programmes Tackled Low Absorption but Had Insufficient Focus on Results, Special Report 17/2018.
European Commission (2021) European Economic Forecast, Spring 2021, Institutional Paper 149, May 2021.
European Commission (2020a) Identifying Europe’s Recovery Needs, Commission Staff Working Document.
European Commission (2020b) Guidance to Member States―Recovery and Resilience Plans, Commission Staff Working Document.
European Energy Agency (2021) Industrial Production in Europe, Indicator Assessment, https://www.eea.europa.eu/data-and-maps/indicators/industrial-pollution-in-europe-3/assessment.
European Parliament (2020a) Protecting the EU Agri-Food Supply Chain in the Face of COVID-19. Brief-European Parliamentary Research Service.
European Parliament (2020b). Specific Flexibility Measures for ESI Funds in Response to the Coronavirus Outbreak. European Parliamentary Research Service.
Erceg, C. and J. Lindé (2014) “Is There a Fiscal Free Lunch in a Liquidity Trap?”, Journal of the European Economic Association, 12(1): 73–107.
Espinoza R., J. Gamboa-Arbelaez and M. Sy (2020) The Fiscal Multiplier of Public Investment: The Role of Corporate Balance Sheet, IMF Working Paper 2020/199.
Farmer, R. (2010) “10 Questions: Economist Roger Farmer”, UCLA Today.
Fernald. J.G. (1999). “Roads to Prosperity? Assessing the Link between Public Capital and Productivity”, American Economic Review, 89(3): 619–38.
Friedman, M. (1957). A Theory of the Consumption Function. Princeton University Press.
Gechert, S. and A. Rannenberg (2018) ‘’Which Fiscal Multipliers Are Regime-Dependent? A Meta-Regression Analysis’’, Journal of Economic Surveys, 32(4): 1160–182.
Gbohoui, W., forthcoming. The Fiscal Multiplier of Public Investment: The Role of Economic Confidence. IMF Working Paper.
Guiso, L. and G. Parigi (1999). “Investment and Demand Uncertainty”, Quarterly Journal of Economics, 114: 185–227.
Hagen, T. and P. Mohl (2010) “Do EU Structural Funds Promote Regional Growth? New Evidence from Various Panel Data Approaches”, Regional Science and Urban Economics, 40(5): 353–65.
Hawtrey, R. G. (1925). “Public Expenditure and the Demand for Labour”, Economica, 13(1925): 38–48.
Hepburn, C., B. O’Callaghan, N. Stern, J. Stiglitz, and D. Zenghelis (2020) “Will COVID-19 Fiscal Recovery Packages Accelerate or Retard Progress on Climate Change?”, Oxford Review of Economic Policy, 36(Supplement_1): 359–81.
Huang Y., U. Panizza and R. Varghese (2018). ‘’Does Public Debt Crowd Out Corporate Investment? International Evidence’’, CEPR Discussion Paper 12931.
Huang Y., M. Pagano and U. Panizza (2020), ‘’Local Crowding Out in China’’, Journal of Finance, 75(6): 2855–898.
Ilzetzki, E., E. Mendoza and C. Vegh (2013) “How Big (Small?) are Fiscal Multipliers?”, Journal of Monetary Economics, 60: 239–54.
International Monetary Fund (2020). “Policies for the Recovery”, International Monetary Fund, Fiscal Monitor, Washington, D.C.
Kahn, R.F. (1931) ‘’The Relation of Home Investment to Unemployment’’, Economic Journal, June.
Karras, G. (2011) “Exchange-Rate Regimes and the Effectiveness of Fiscal Policy”, Journal of Economic Integration, 26(1), 29–44.
Keynes, J.M. (1936) The General Theory of Employment, Interests and Money. London: Macmillan.
Kraay, A. (2014) “Government Spending Multipliers in Developing Countries: Evidence from Lending by Official Creditors”. American Economic Journal: Macroeconomics, 6(4): 170–208.
Lanau, S. (2017) The Growth Return of Infrastructure in Latin America, IMF Working Paper 17/35.
Leduc, S. and D. Wilson (2012) “Roads to Prosperity or Bridges to Nowhere? Theory and Evidence on the Impact of Public Infrastructure Investment”, NBER Macroeconomics Annual, 27: 89–142.
Miyamoto, H., N. Gueorguiev, J. Honda, A. Baum and S. Walker (2020) “Growth Impact of Public Investment and the Role of Infrastructure Governance”, in G. Schwartz, M. Fouad, T. Hansen and G. Verdier (eds), Well Spent: How Strong Infrastructure Governance Can End Waste in Public Investment. Washington, DC: International Monetary Fund.
Moretti E., C. Steinwender and J.V. Reenen (2019) The Intellectual Spoils of War? Defense R&D, Productivity and International Spillovers, NBER Working Papers 26483.
Myers, S. (1977) ‘’Determinants of Corporate Borrowing’’, Journal of Financial Economics, 5(2): 147–75.
OECD (2020) The Territorial Impact of COVID-19: Managing the Crisis across Levels of Government, OECD Policy Responses to Coronavirus (Covid-19) Policy Paper.
Ricardo, D. (1820). The Essay on the Funding System. Timeless Books.
Romer, P. (1986). “Increasing Returns and Long-Run Growth”, The Journal of Political Economy, 94(5): 1002–037.
Snowdon B. and H. R. Vane (2005) Modern Macroeconomics. Cheltenham; Northampton, MA. Edward Elgar Publishing, Inc.
Wolff, G. B. (2020) Without Good Governance, the EU Borrowing Mechanism to Boost the Recovery Could Fail. Bruegel Opinion Piece, https://www.bruegel.org/2020/09/without-good-governance-the-eu-borrowing-mechanism-to-boost-the-recovery-could-fail/.
1 The views expressed in this chapter are those of the authors and do not necessarily represent the views of the Central Bank of Chile or its Board members, the IMF, the IMF Executive Board or IMF management.
2 Even if the concept of multiplier is associated with Keynes, it was first was developed first by Kahn (1931). However, Kahn’s focus was on the “employment multiplier”: by how much does aggregate employment increase when public investment increase? See Kahn (1931) and Snowdon and Vane (2005).
3 MPC = 1-1/k
4 Ralph G. Hawtrey (1925), then a senior official at the Treasury, harshly repopularised the Treasury view: ‘’The public works are merely a piece of ritual, convenient to people who want to be able to say that they are doing something, but otherwise irrelevant’’.
5 However, Berg et al. (2019) note that the relationship between fiscal multiplier and the efficiency of public investment is complicated in theory, because the marginal productivity of capital should be increasing in investment inefficiencies if one realises that inefficient investment results in less capital, and thus a higher marginal product of capital.
6 Other measures that can be used to quantify public investment quality measures include the International Country Risk Guide (ICRG) indexes, the World Economic Forum Global Competitiveness Report survey on the wastefulness of government spending, the IMF Tax Administration and Diagnostic Assessment Tool (TADAT), the Public Expenditure and Financial Accountability (PEFA), and the IMF Fiscal Transparency Code (FTI).
7 European Commission (2021x) “European Structural and Investment Funds 2014-2020. 2020 Summary report of the programme annual implementation reports covering implementation in 2014-2019.” European Commission Strategic Reports.
8 See the EU Open Data Portal here: https://cohesiondata.ec.europa.eu/overview.
9 In Durand and Espinoza (2021) ESI disbursements are computed using data from the major funds throughout the sample years starting in 1989, depending on data availability. This is in contrast with much of the previous literature, which instead focuses only on specific funds.
10 This group is composed of Croatia, the Czech Republic, Estonia, Latvia, and Slovenia. Durand and Espinoza (2021) show that in this group of countries, multipliers on investments and total investments are relatively higher when compared to the EU-wide multipliers.
11 Notice that all coefficients are subject to uncertainty, as illustrated by the bars surrounding the point estimates in Figure 6. In Durand and Espinoza (2021), the estimated multipliers also include the effects driven by co-financing, which is approximately equal to 40% on average.
12 See questions and answers on the MFF and Next Generation EU, available at: https://ec.europa.eu/commission/presscorner/detail/en/qanda_20_935.
13 This argument is further backed by the results from an international survey of experts, including senior officials from finance ministries and central banks, who expressed the desirability of green projects in creating more jobs and delivering higher short-term returns, when compared to more traditional fiscal stimulus (see Hepburn et al. (2020)).