1. Challenges for Public Investment in the EU: The Role of Policy, Energy Security and Climate Transition
© 2022 Chapter Authors, CC BY-NC 4.0 https://doi.org/10.11647/OBP.0328.01
Introduction
The war in Ukraine poses new challenges for public investment in the EU. We describe these challenges and the expected evolution of public investment in the first section of this chapter. By raising uncertainty and increasing energy and other input costs, the war depresses the macroeconomic environment. Concerns about high levels of public debt have re-emerged for some countries and tightened financial conditions in particular in Southern Europe. New demands arise for current expenditure, such as to contain the impact of higher energy costs. This might detract governments from investment spending. Public investment itself is forced to move away from investments that increase average growth, and towards those that primarily increase resilience to future shocks, such as investments in energy security and military equipment. Despite these challenges, public investment is to continue to increase over the coming years, supported by substantial EU funds. The challenge remains the effective deployment of those funds.
A key area for public investment since the start of the war in Ukraine is improving the security of energy supply. In the second part of this chapter, we describe the challenges that member states face and the EU-level response, the REPowerEU programme. Rapidly reducing the dependence on Russian fossil fuels is a tall order that can be addressed only with co-ordinated policies and efforts both at the national and EU-wide levels. The cost may not be overwhelming, but it comes on top of large investment needs related to the transition to a net-zero carbon economy. Solidarity within the European Union is a key ingredient for successfully overcoming these challenges.
The current challenges for public investment may well persist for some time. They should not distract from the long-term goal of setting the EU economy on a greener, more sustainable path. On the contrary, they should be taken as an opportunity to increase the coherence of the design of a more secure, greener, and more integrated EU energy market and should accelerate its implementation.
1.1 Public Investment in the EU: Trends and Outlook
1.1.1 Public Investment Is Facing New Challenges
In the late 2010s, public investment had picked up after a range of policy reforms. The long decline in public investment that followed the global financial crisis (GFC) and the European sovereign-debt crisis had created large investment needs. The EU fiscal framework appeared to have the unintended consequence of encouraging member states to reduce public investment spending relative to other expenditures during fiscal consolidations. Reforms made the EU fiscal framework more flexible. More emphasis was placed on stepping up public investment in particular in R&D, digital technologies, and mitigating climate change. The European Fund for Strategic Investments (EFSI) provided a new source of funding.
The support for public investment became clearly visible when COVID-19 hit the global economy in 2020. EU fiscal policy responded1 in two phases, addressing short- and longer-term needs. The activation of the general escape clause of the Maastricht Treaty and the relaxation of state aid rules enabled national authorities to provide debt-financed emergency support. In turn, the Recovery and Resilience Fund (RRF) was designed to strengthen the EU’s growth potential in the longer term by steering public expenditure towards investment.
Now a new adverse shock has hit the European economy: the war in Ukraine. The war will make the implementation of existing investment plans more difficult and risks to absorb resources for current spending and for investments in resilience. Inflation and, in some EU member states, higher wage growth are driving up the costs of investments in infrastructure and energy efficiency. A sharp increase in demand and persistent supply chain disruptions delay the delivery in particular of green and digital investments. Governments throughout the EU are increasing current expenditure to reduce the pressure of higher energy prices on households’ and firms’ budgets. Large investments in resilience, such as in military capacity and diversification of gas supplies, would have been unnecessary had the geopolitical situation not changed. A new EU programme, RePowerEU, is providing some support (see the section on the security of energy supply and the climate transition).
1.1.2 Despite these Challenges, Public Investment Will Continue to Increase
Against this background, member states forecast that their public investment will grow just above GDP over the coming years (Figure 1.1 and Figure 1.2).2 For Central and Eastern European countries (CEE), this means that the ratio of investment to GDP will remain just below its historical high of 5%, whilst it will remain stable at around 3.5% in Northern and Western European countries (NW), and will almost reach that level in Southern European countries (SE).
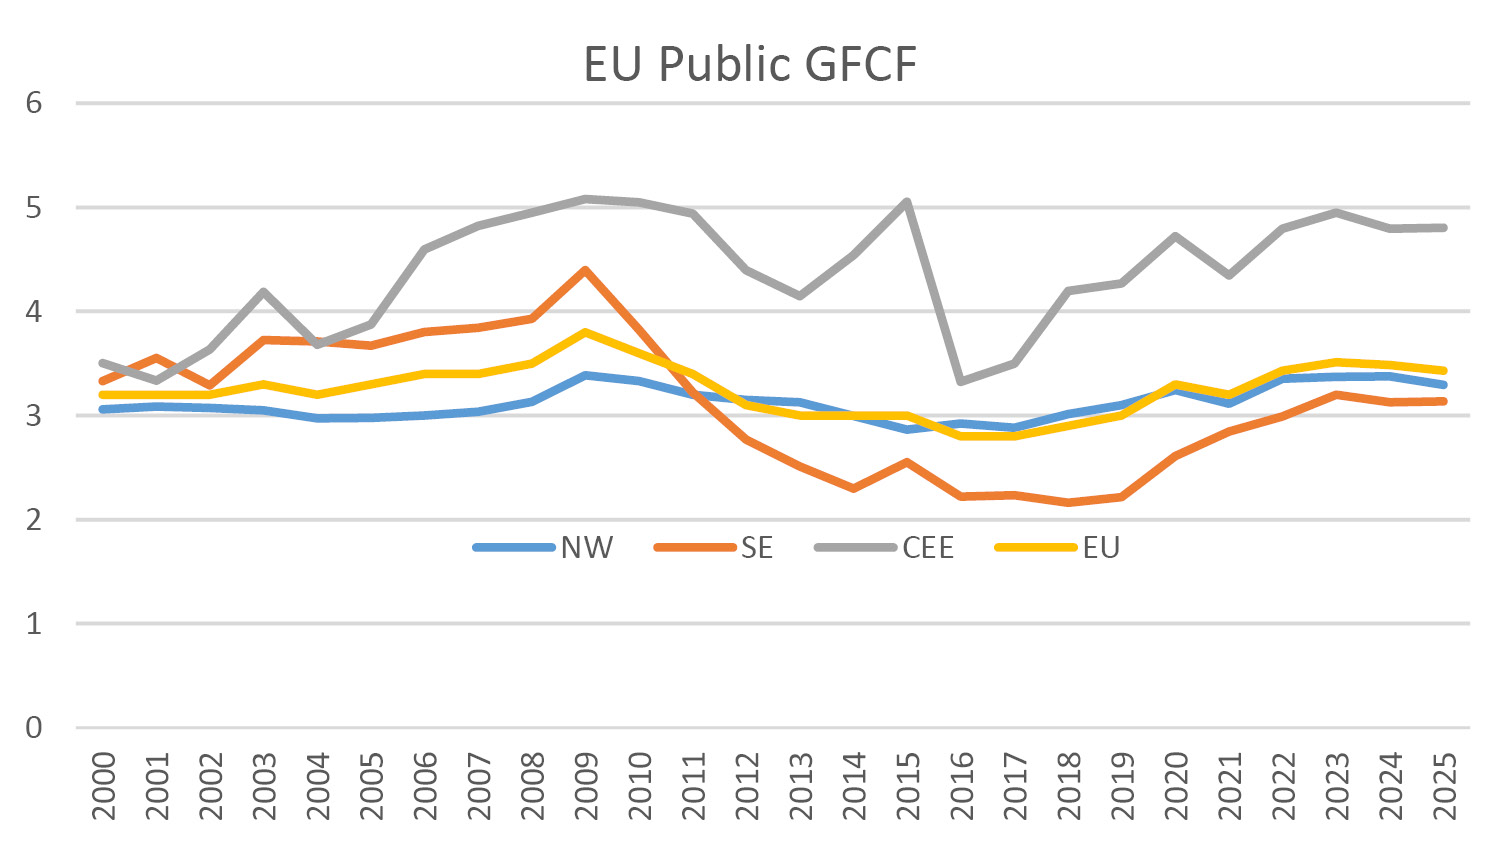
Fig. 1.1 Public investment, % GDP.
Source: AMECO online, EIB calculation based on MS Stability and Convergence plans
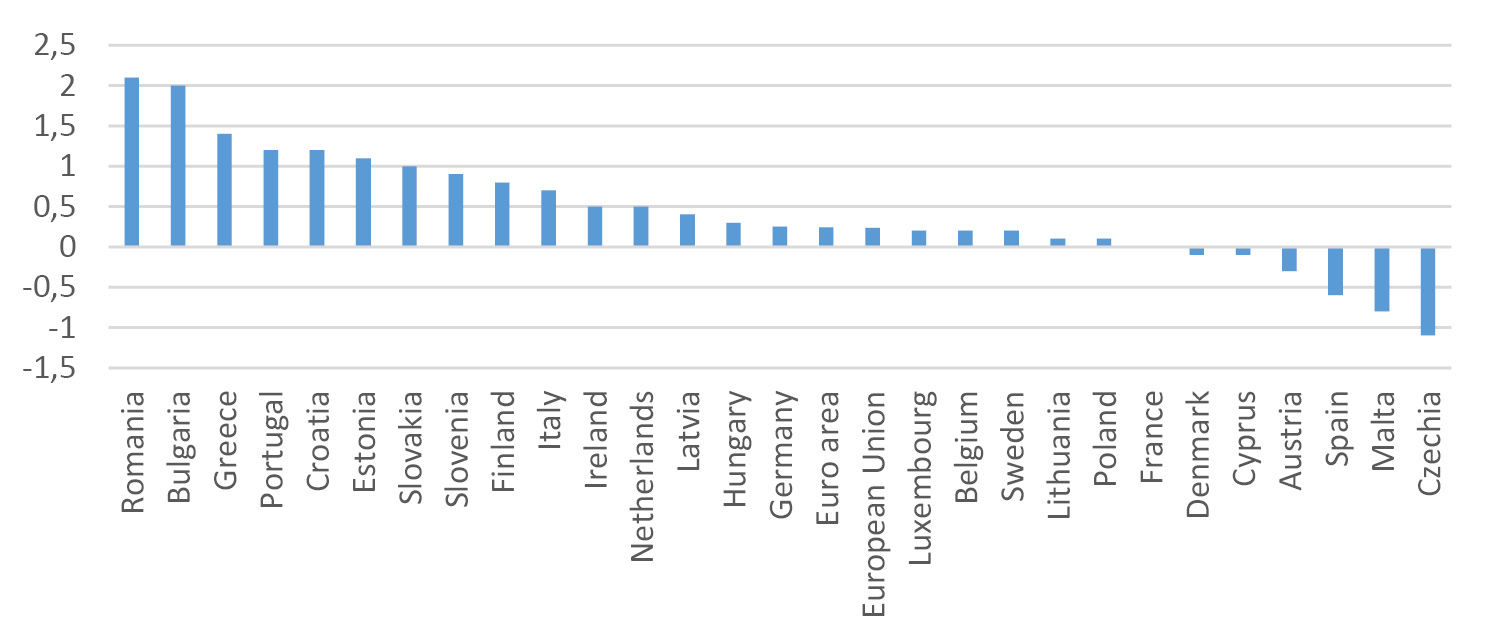
Fig. 1.2 Change in the ratio of public investment / GDP between 2025 and 2021.
Source: AMECO online, EIB calculation based on MS Stability and Convergence plans.
Public investment spending is set to rise in particular in Central and Southern Europe. Most of these countries expect to receive large allocations from EU Structural Funds and the RRF relative to their GDP. The boost to investment is likely to be large, particularly in the short run because funds from the 2014–2020 budget period need to be spent by the end of 2023, and RRF resources by the end of 2026. For some countries in Eastern Europe, grants from the RRF and the cohesion funds add up to over 25% of their 2021 GDP (Figure 1.3). Additional support will be available in the form of loans under the RRF. In Italy, grants and loans from the RRF will cover half of the expenditures on public investment for 2024–2025 (Table 1.1).3
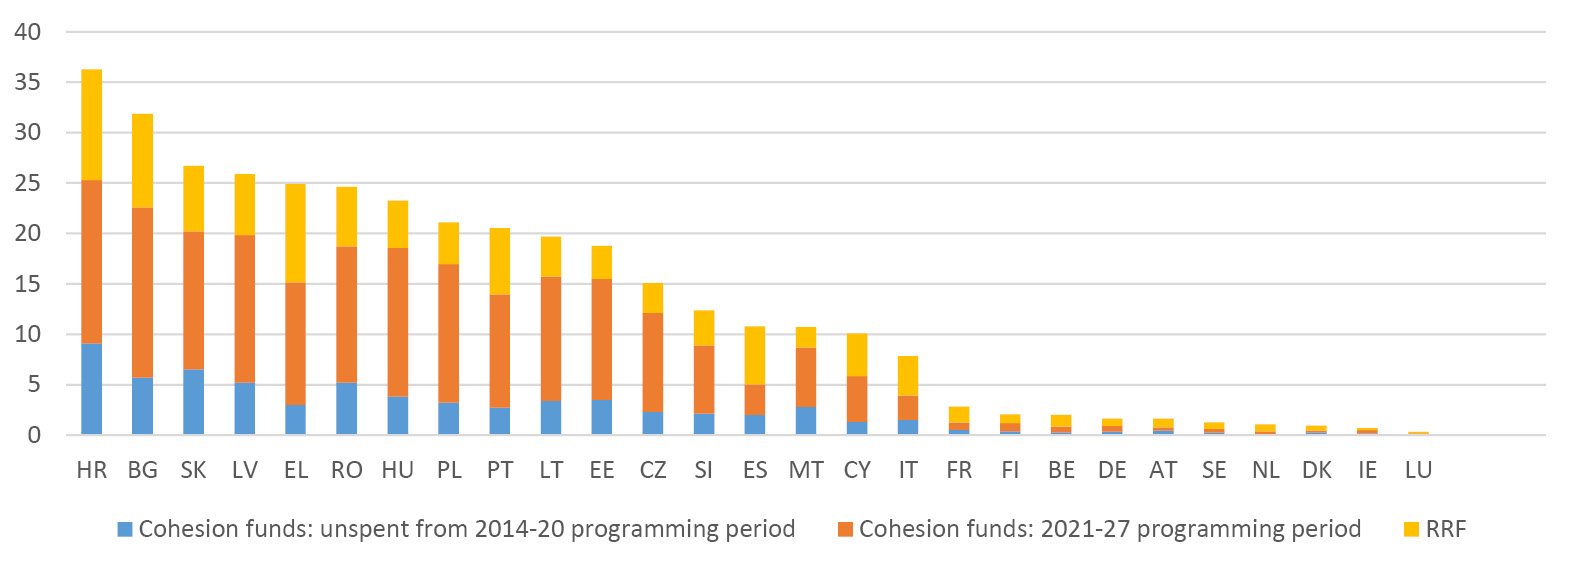
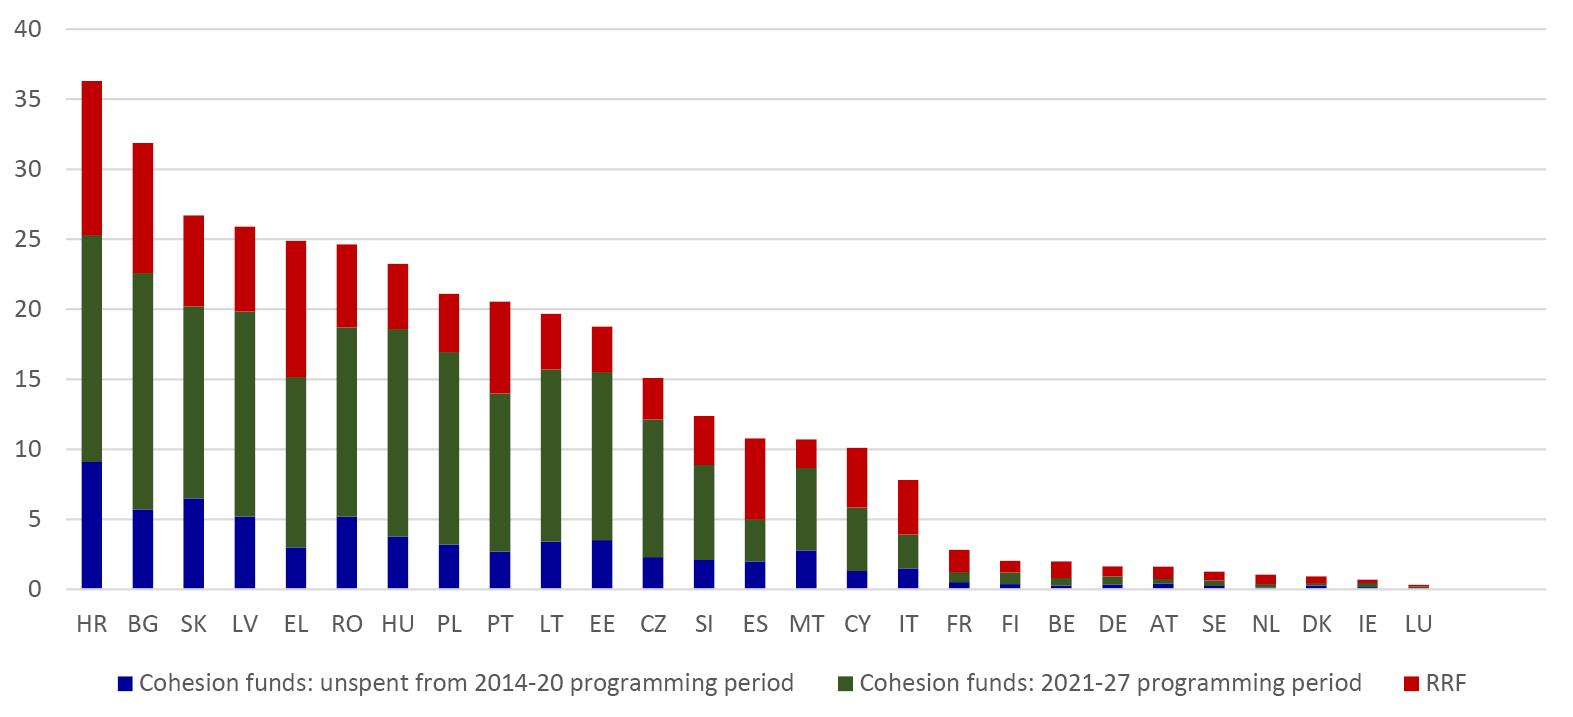
Fig. 1.3 Key EU grant programmes to support investment, % of 2021 GDP.
Source: European Commission and EIB. Data as of 31 August 2022.
Table 1.1 General Government Investment, as a % of GDP
|
2021 |
2022 |
2023 |
2024 |
2025 |
||
|
Bulgaria |
GFCF |
3.3 |
4.8 |
5.4 |
5.3 |
5.3 |
|
of which RRF |
0.0 |
0.5 |
1.3 |
1.1 |
1.0 |
|
|
Estonia |
GFCF |
5.7 |
7.5 |
7.6 |
7.4 |
6.8 |
|
of which RRF |
0.0 |
0.1 |
0.4 |
0.3 |
0.1 |
|
|
Greece |
GFCF |
3.6 |
5.5 |
4.9 |
5.1 |
5.0 |
|
of which RRF |
0.1 |
0.9 |
0.9 |
1.0 |
0.8 |
|
|
Italy |
GFCF |
2.9 |
3.1 |
3.6 |
3.5 |
3.6 |
|
of which RRF |
0.1 |
0.9 |
1.2 |
1.7 |
1.7 |
|
|
Portugal |
GFCF |
2.5 |
3.2 |
3.6 |
3.7 |
3.7 |
|
of which RRF |
0.0 |
0.6 |
0.8 |
0.7 |
0.6 |
|
|
Slovenia |
GFCF |
4.7 |
6.4 |
6.6 |
5.8 |
5.6 |
|
of which RRF |
0.2 |
0.3 |
0.6 |
0.8 |
0.7 |
Source: AMECO online, MS Stability and Convergence plans
Most member states have already received some of their RRF funding. At the end of August 2022, all but six member states had received 13% of their allocation as pre-funding following the European Commission’s approval of their Recovery Plans (Figure 1.4). The four large Southern European states plus Slovakia, Croatia and France, had also received additional funds whose disbursement depended on the achievement of milestones and targets from their Recovery Plan. Relative to their GDP, payouts were particularly large in Greece, followed by Croatia, Spain, and Italy.
The timely implementation of the RRF still faces substantial hurdles. First, even though all RRF-funded investments have to be implemented by 2026, across the EU only 5% of the milestones (for policy reforms) and targets (for investments) in member states’ Recovery Plans had been met by the end of August. Second, some projects may be delayed by persistent supply chain disruptions, such as for renewable energy, and by shortages of labour, such as for investments in construction. Finally, some investments may require additional funding because the price of the investment goods has increased since the plans were finalised. This is the case in particular for investments related to the green transition. That said, the awards of investments linked to the RRF in the EU’s central procurement database appears to be picking up, suggesting that the implementation of investment projects is starting to gain speed (see Figure 1.9 below).
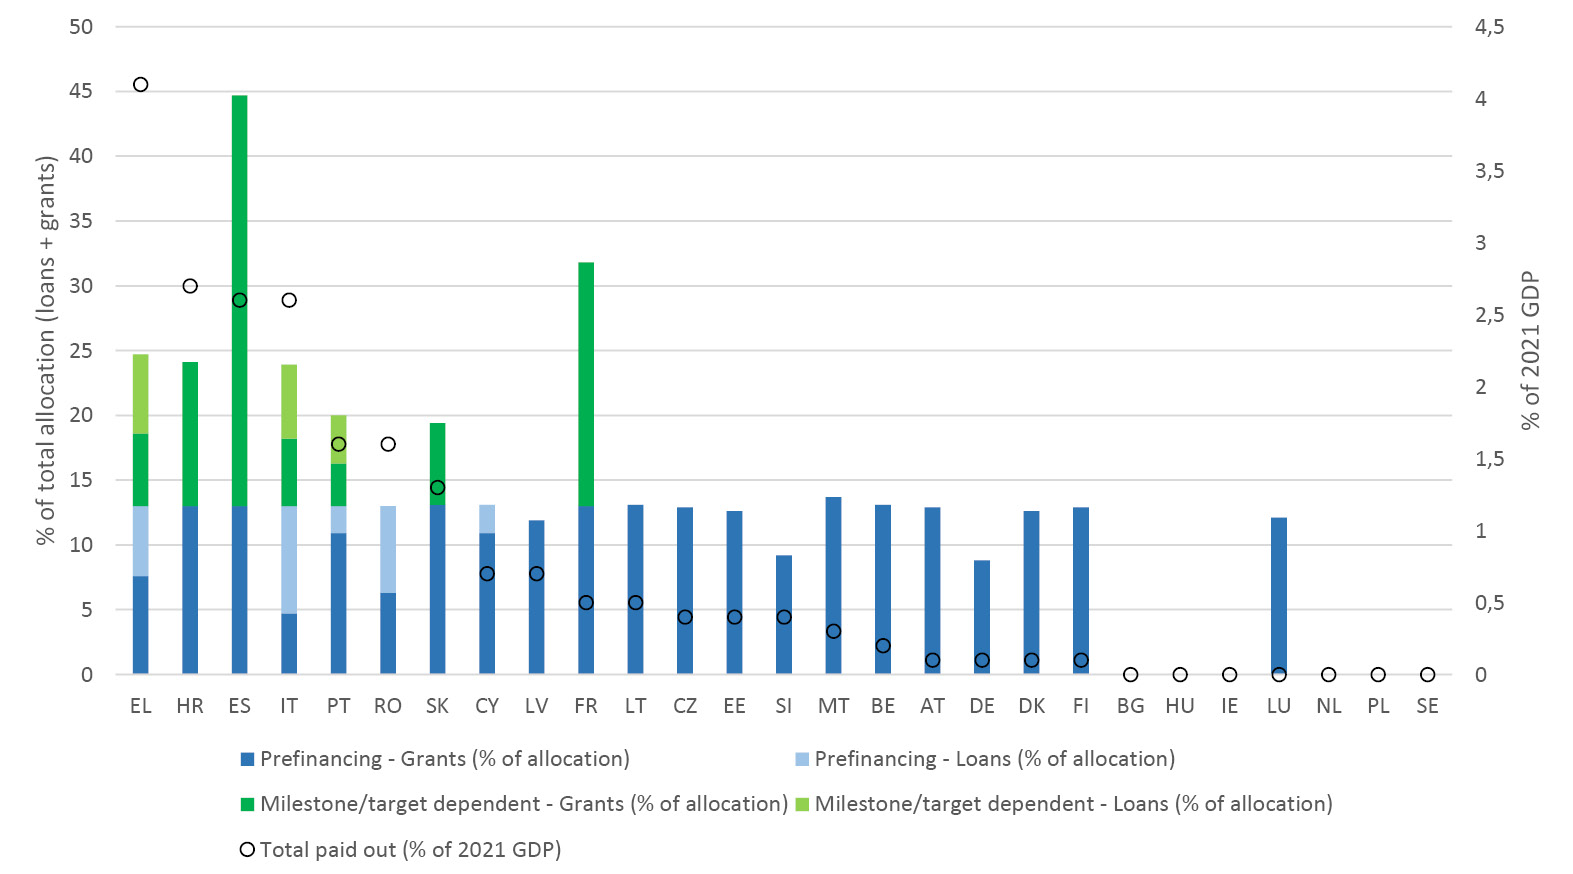
Fig. 1.4 Payouts from the Recovery and Resilience Fund.
Source: European Commission and EIB. Data as of 31 August 2022.
1.2 Local Government Investment Is Catching up
Considering the challenges of public investment, it is crucial to understand what is happening to public investment according to the different levels of government at which it is decided. Eurostat publishes data on public investment for central, state and local governments. Because state governments only exist in federal government systems (Austria, Belgium, Germany, and Spain), we collapse state and local governments into one category. Figure 1.5 shows the evolution of the share of GDP for the two categories of investment, normalising it at 100 in the year 2005. It is well known, particularly in the SE countries, that the decline in public investment in the aftermath of the twin crises of the GFC and the European sovereign-debt crisis was particularly severe at the local level.
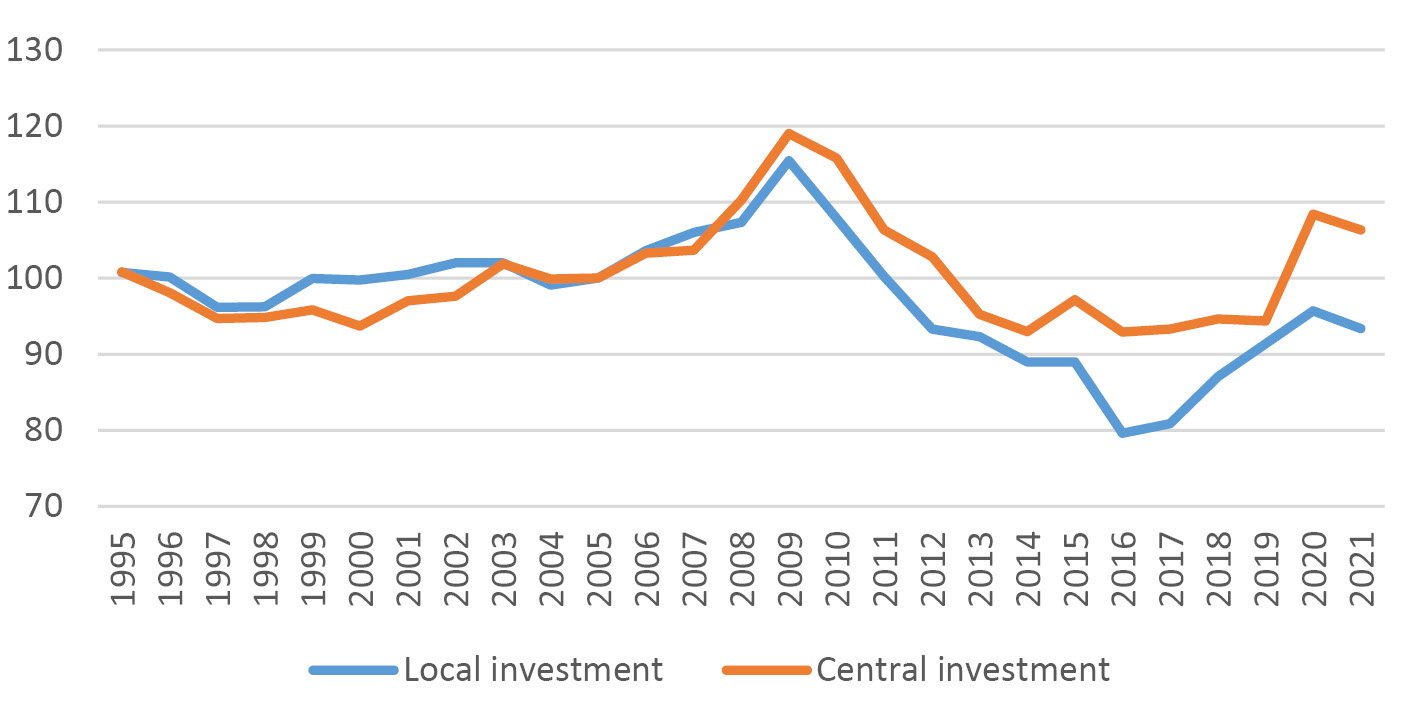
Fig. 1.5 Local and central government investment (2005=100).
The decline in local government investment was longer and steeper. It remains to be seen to what degree the RRF promotes an increase of capital stock of regions and territories. It may well be the case that the impacts of public investment on growth and potentially on private investment depends on the level of government that invests. Using Eurostat data for the twenty-seven EU countries, the aggregate multiplier of local investment appears to be larger and seems to have a more persistent impact on growth (Figure 1.6).4
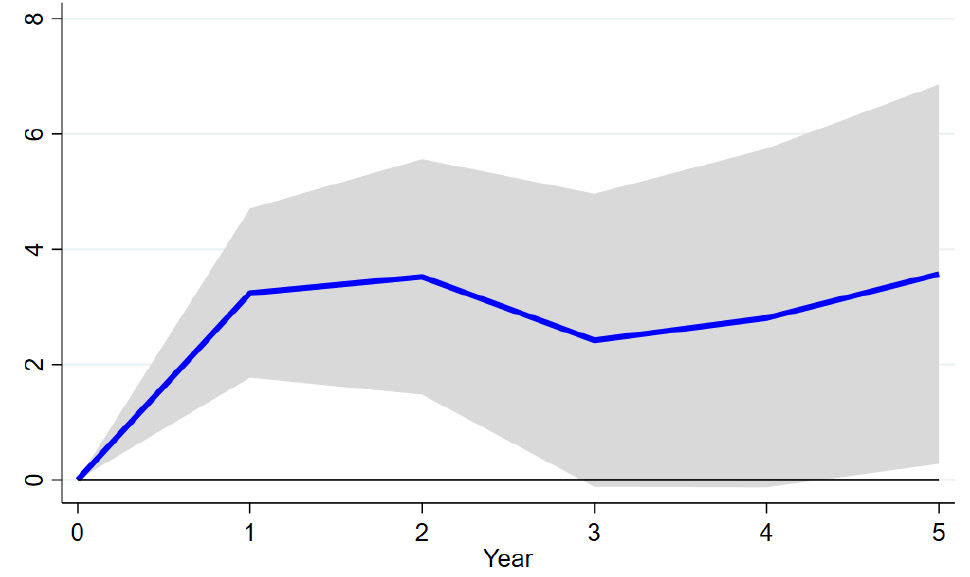
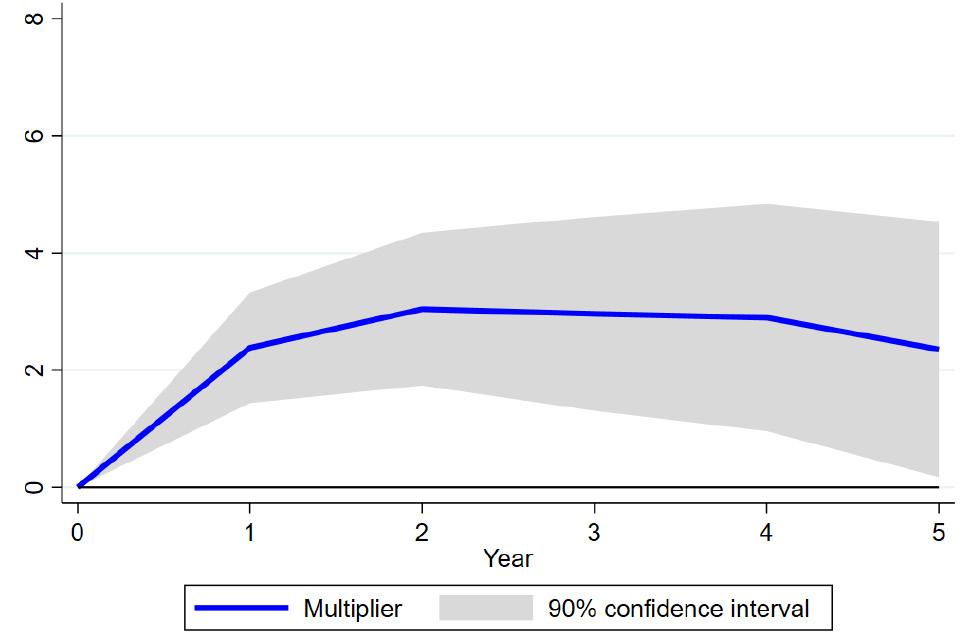
Fig. 1.6 Multiplier of GDP in response to public investment at different level of Government.Source: Brasili et al. (forthcoming).
While it is difficult to quantify the distribution of the RRF by government level, the contribution of the measures to social and territorial cohesion, one of the six policy pillars that the EC suggested for RRF, is a reasonable proxy. According to the EC scoreboard,5 10% of the measures have social and territorial cohesion as the main pillar, and for 35%, it is the secondary pillar.
The EC scoreboard also includes a detailed list of the measures that have already satisfied certain milestones or targets. Meeting these milestones and targets is a condition for further disbursements from the RRF. As per 1 September 2022, the scoreboard includes 282 measures, 88 of which are classified as investment measures, while the other 194 are reforms. Considering the whole set of measures, 12 include social and territorial cohesion as their only pillar, and 106 other measures include it as one among a range of pillars.
1.3 Public Investment on Digital Services Is on the Rise
Government procurement notices provide an interesting snapshot of the composition of investment-related public sector spending across the EU. (Because of restricted coverage and data quality issues, they should only be regarded as indicative of public spending.6) One noticeable development, to some degree driven by the pandemic, is that the share of procurement for digital goods and services has increased. Over the past few years, awards related to construction investments comprised around two thirds of public authorities’ investment-related procurement awards (Figure 1.7). About 15% were awarded for digitalisation projects (mostly IT services) and 10% for transport equipment. Since the pandemic, however, the share of awards for digitalisation has increased substantially, driven by an expansion of IT services procurement (Figure 1.8). With its focus on digital investment, the RRF has also incentivised additional spending on digitalisation.7 By 2022Q2, out of around €21bn contract awards linked to the RRF, €15bn were for digital goods or services (Figure 1.9).
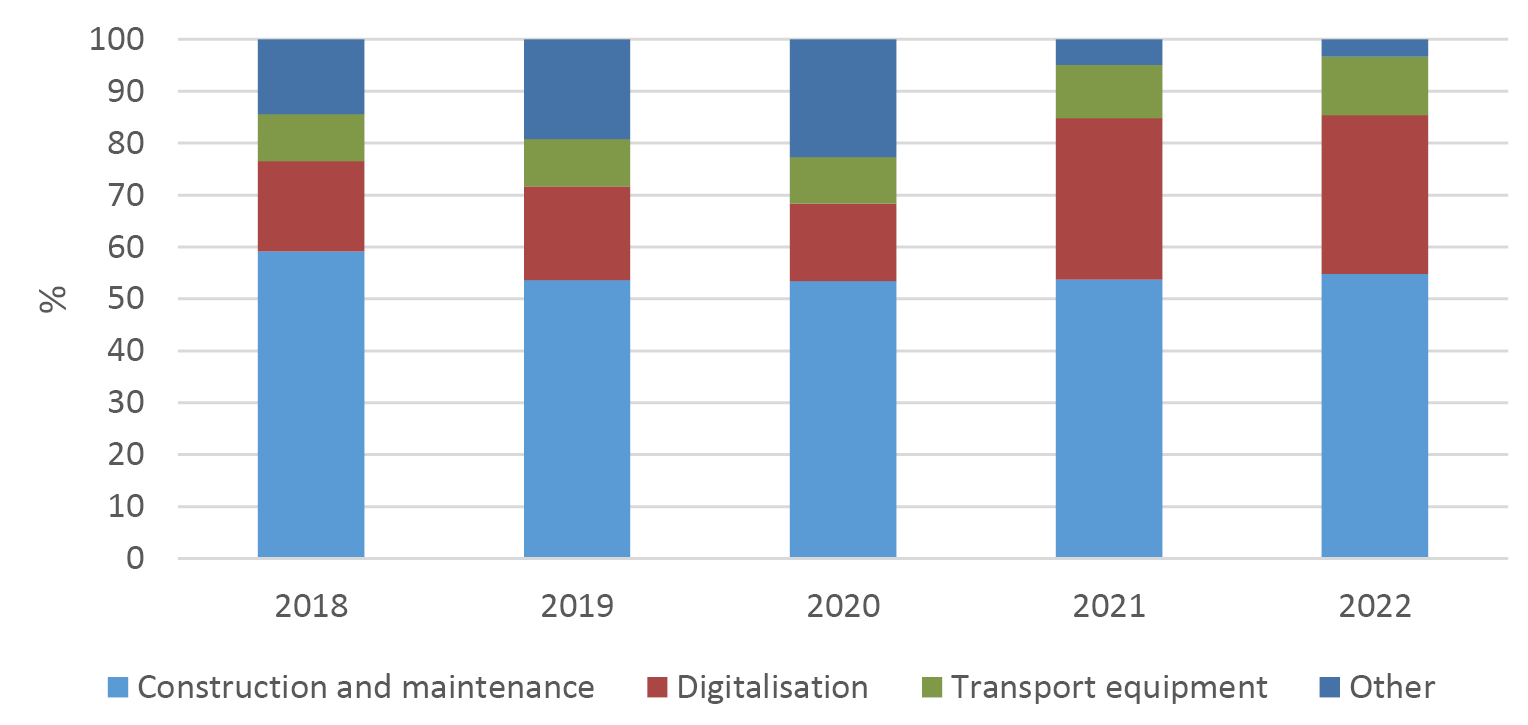
Fig. 1.7 Contract awards for public investment.
Source: EIB estimates based on TED Public Procurement Database. 2022 awards included up to the end of June.
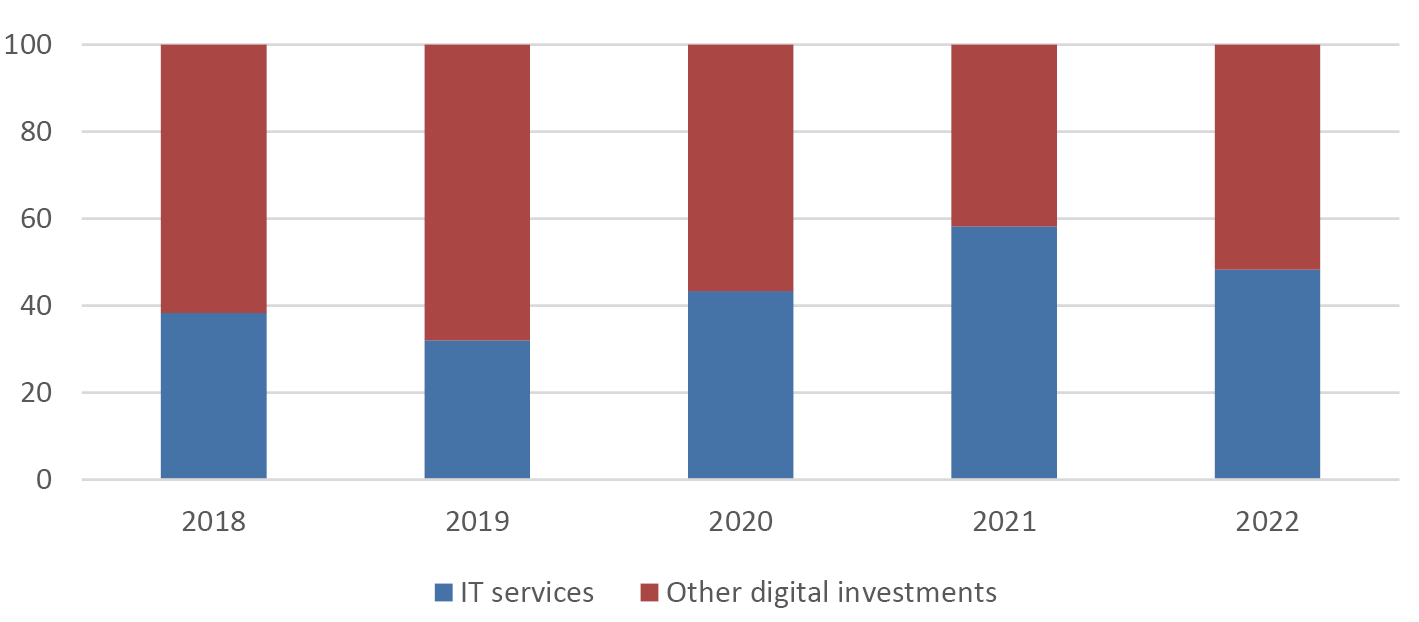
Fig. 1.8 Contract award for digital public investment.
Source: EIB estimates based on TED Public Procurement Database. 2022 awards included up to the end of June.
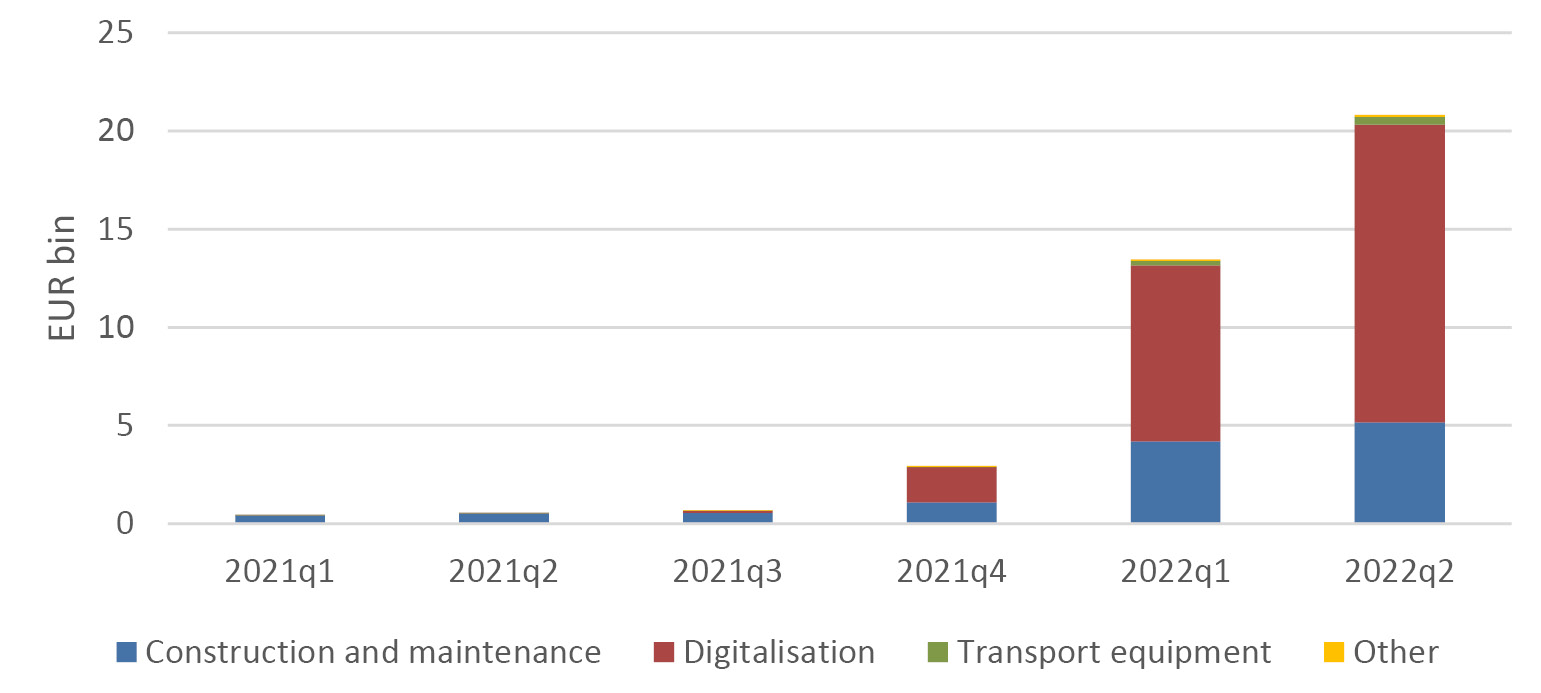
Fig. 1.9 Cumulative value of contract awards for public investment linked to the RRF.
Source: EIB estimates based on TED Public Procurement Database.
1.4 Capital Transfers Are Set to Remain above Average
Public investment does not only involve gross fixed capital formation in the public sector, but also capital transfers to the private sector. These capital transfers take the form of participation in and support of private-sector investment by the public sector. The recent increase in capital transfers reflects the intention of maintaining a larger role for public policy as a provider of investment incentives for the private sector (Figure 1.10; the spikes during 2010 and 2012 were largely caused by public-sector support for financial institutions). They also receive support through the RRF (Table 1.2).
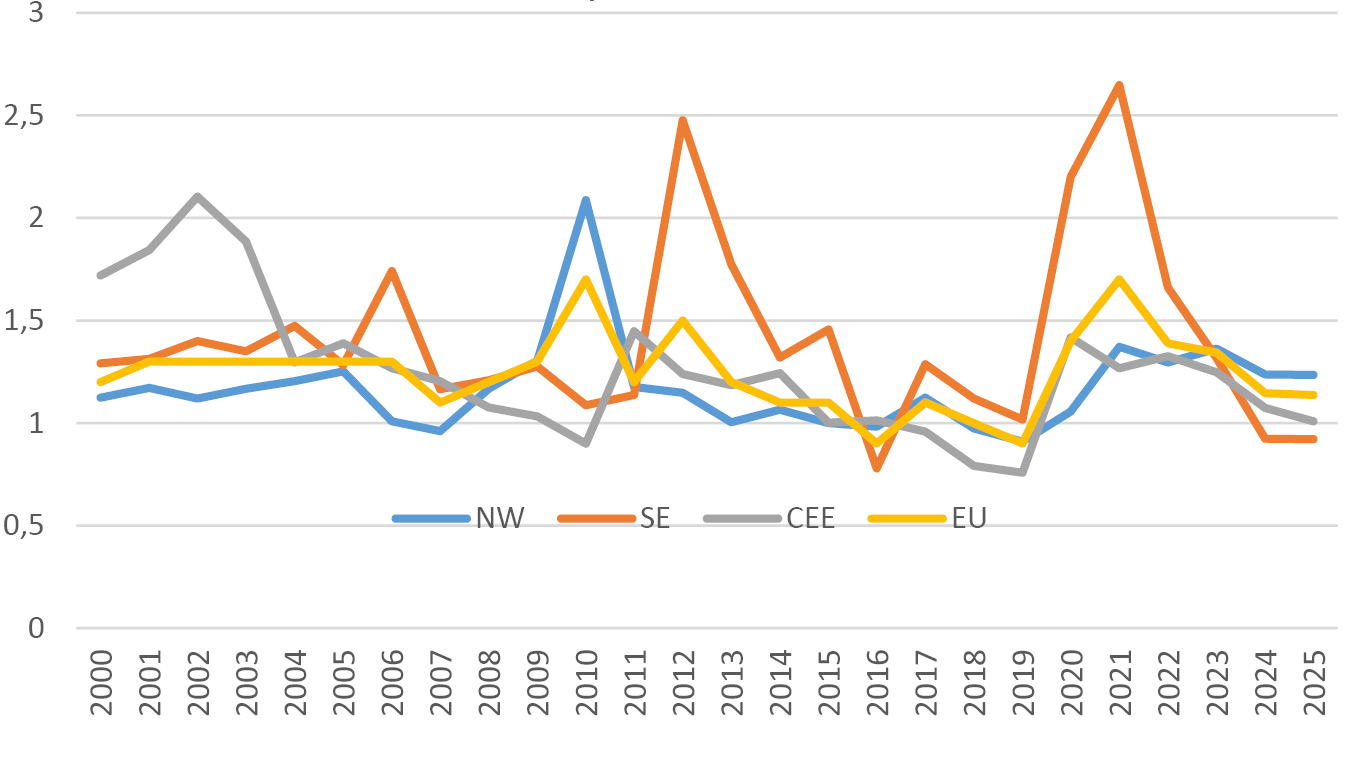
Fig. 1.10 EU capital transfers, % GDP.
Source: AMECO online, EIB calculation based on MS Stability and Convergence plans.
Table 1.2 General Government capital transfers, % GDP
|
2021 |
2022 |
2023 |
2024 |
2025 |
||
|
Germany |
Capital Transfers |
1.9 |
1.8 |
1.8 |
1.8 |
1.8 |
|
of which RRF |
0.1 |
0.1 |
0.1 |
0.1 |
0.1 |
|
|
Estonia |
Capital Transfers |
5.7 |
7.5 |
7.6 |
7.4 |
6.8 |
|
of which RRF |
0.0 |
0.1 |
0.4 |
0.3 |
0.1 |
|
|
Spain |
Capital Transfers |
2.1 |
1.2 |
0.9 |
0.6 |
0.6 |
|
of which RRF |
1.0 |
1.2 |
0.9 |
0.1 |
0.0 |
|
|
Italy |
Capital Transfers |
3.1 |
2 |
1.7 |
1.1 |
1.1 |
|
of which RRF |
0.1 |
0.3 |
0.5 |
0.1 |
0 |
|
|
Hungary |
Capital Transfers |
3.7 |
2.8 |
4.1 |
3.6 |
3.3 |
|
of which RRF |
0.55 |
0.64 |
0.8 |
1.03 |
0.45 |
|
|
Portugal |
Capital Transfers |
1.3 |
1.7 |
1.2 |
1.1 |
1 |
|
of which RRF |
0 |
0.4 |
0.4 |
0.4 |
0.3 |
Source: AMECO online, MS Stability and Convergence plans
1.5 Security of Energy Supply and the Climate Transition
Security of energy supply is an important issue in designing energy systems and as such it has always been a concern for policymakers and researchers alike (EIB 2007). It covers a wide range of issues, from designing a resilient electricity system to securing reliable import partners. The latter is a particularly difficult aspect for European countries, as most of them rely largely on imported fossil fuels. Furthermore, proximity to Russia, one of the biggest exporters of fossil fuels, has resulted in significant dependencies on Russian fossil fuels across the EU.
The oil crisis in 1973–1974 led to the development of a toolbox for risk management of energy supply security, consisting of mostly market-based tools, used by most Western consuming countries and international oil companies. These tools served the security of energy supply, especially petroleum, well in the period 1980–2000, and relied on relatively abundant oil supplies outside the OPEC. This market structure did not allow the national interests of oil producers to dictate trade on international markets.
With the concentration of oil and gas production in countries in the Middle East, the Caspian Sea region and Russia, where investment in extraction is politically rather than economically motivated, market conditions have changed significantly. The change is reinforced by the rise of high-growth economies like China, India and Brazil, whose demand for energy is increasing seemingly exponentially. Risks for energy supply security in the EU have thus increased.
These changes oblige net importers of fossil fuel to redesign their systems and policies so as to minimise supply disruptions. Frontloading policies and targets aimed at climate change mitigation can become a very important contributor to reducing energy dependence and enhancing energy supply security. The aim of climate-change mitigation policies is to de-carbonise the economy, effectively minimising the use of fossil fuels. As we explain here the EU plan to reduce dependence on Russian energy imports, REPowerEU, effectively frontloads those efforts required in order to achieve a net zero-carbon economy.
1.6 Energy Dependence Indicators
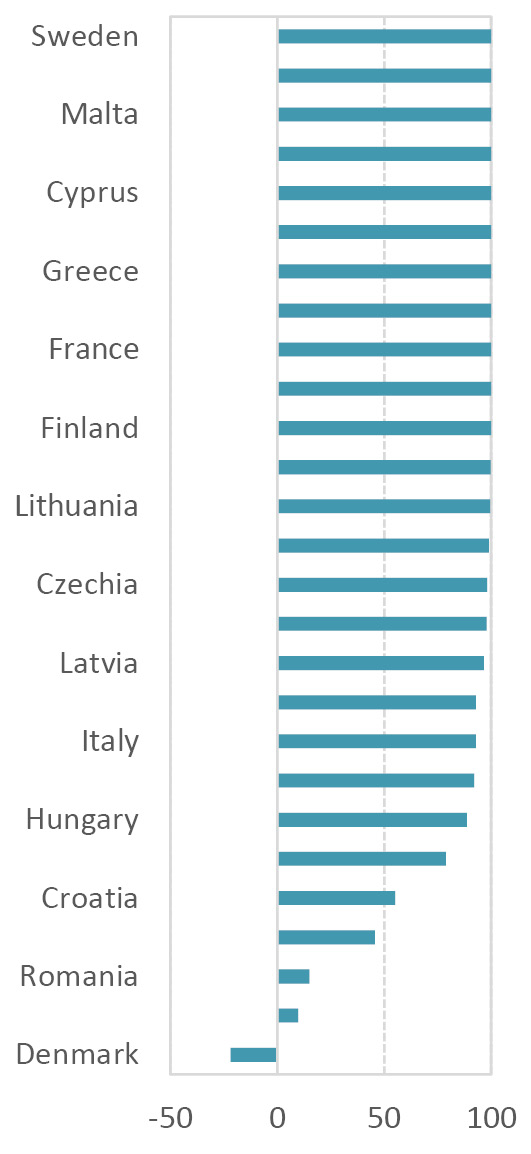
The state of energy import dependence can be mapped with the help of several indicators (EC 2014). While the fossil-fuel import dependence of the EU is well known, there are wide differences between member states (MS). Updating the calculations in EC (2014), Figure 1.11 plots the average 2016–2020 net imports of fossil fuels, as a share of gross inland consumption by fuel, for EU MS. For nineteen MS, net imports of natural gas constitute more than 90% of gas consumption (Figure 1.11a). Thirteen of these import more than 80% of their natural gas from countries outside the European Economic Area (EEA). The number of countries with net import natural gas dependence above 90% has increased, up from seventeen, based on the average values for 2008–2012 (EC 2014).
The high and increasing import dependence on natural gas is even more worrying than that for petroleum and coal due to the structure of the gas market. More than 80% of natural gas imports in the EU are via pipelines, which grants a near monopolistic position for the exporter, at least in the short run. Quickly substituting a substantial portion of pipeline imports with liquefied natural gas (LNG) is virtually impossible due to capacity constraints, long-term contracts of LNG producers and low price elasticity of demand for many high-growth, mostly Asian economies.
|
a. Natural gas net imports, % of gross inland consumption of natural gas |
b. Total petroleum products net imports, % of gross inland consumption of total petroleum products |
c. Solid fuels net imports, % of gross inland consumption of solid fuels |
|
|
|
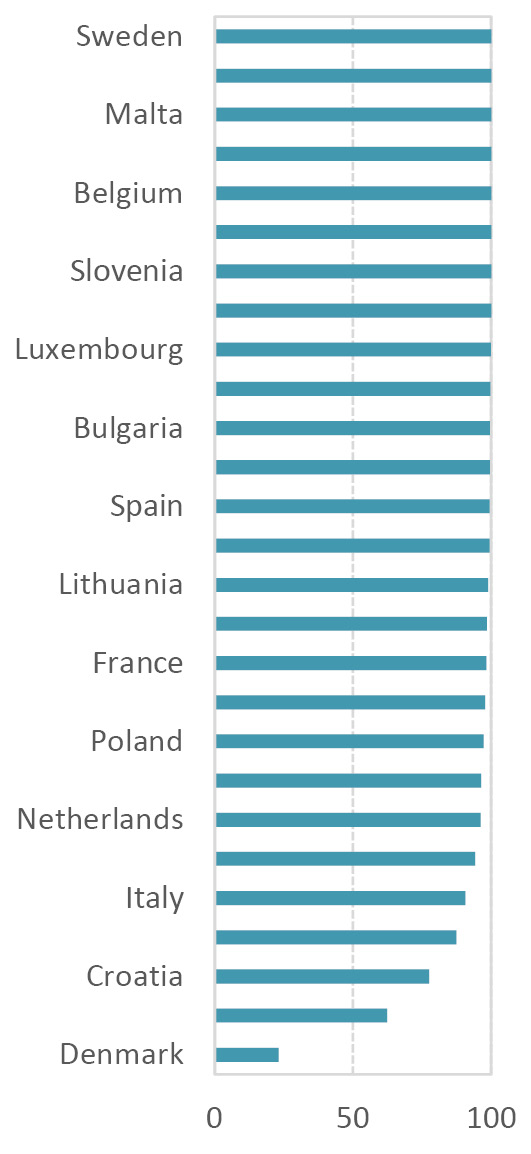
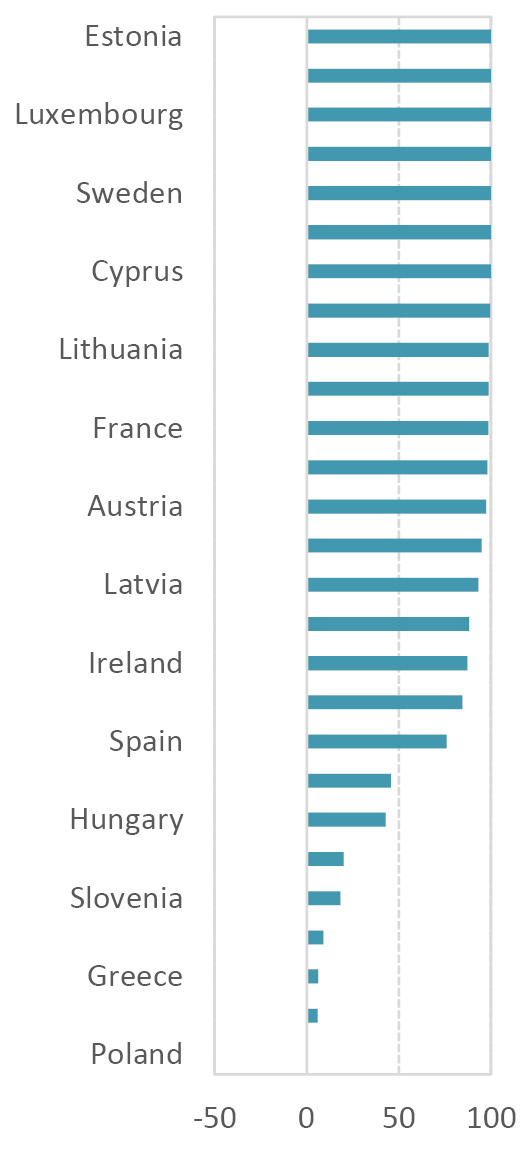
Fig. 1.11 Fossil fuel import dependence in the EU, average 2016–2020.
Source: Eurostat and EIB staff calculations.
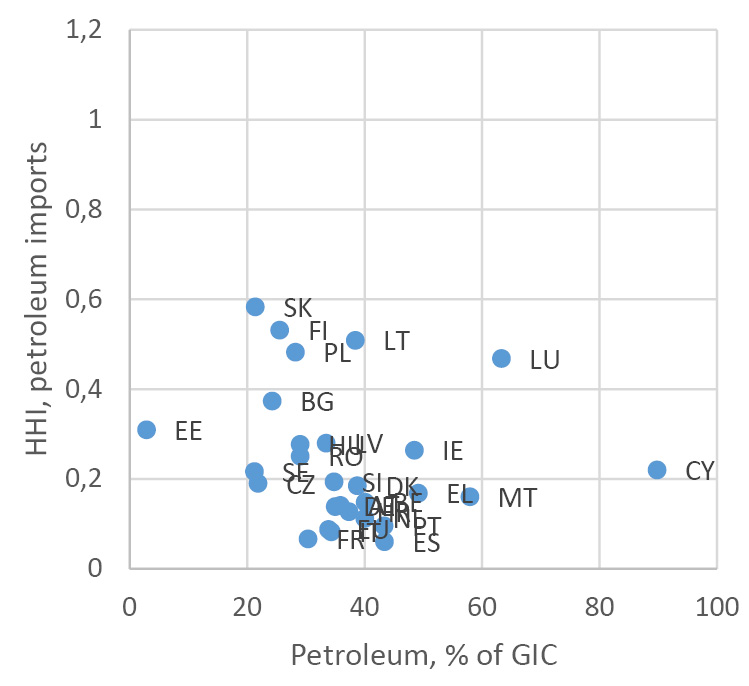
Producers of petroleum and solid fuels are more diverse and more geographically dispersed, and these fuels are more easily transported across large distances than gas. These features provide higher flexibility to switch among fuel suppliers. This flexibility notwithstanding, high import dependence and concentration of oil and coal suppliers is a fact for many EU countries. The net import dependence for petroleum products is above 90% in 24 MS. Eight of them import more than 80% of their total petroleum products from countries outside the EEA. The Herfindahl-Hirschman Index (HHI), a measure of market concentration, shows that imports of petroleum products are more diversified than those of gas and solid fuels.8 Moreover, twelve MS have diversified their sources of oil imports over the past ten years. That said, eight MS have an HHI value above 0.5. Regarding solid fuels, fifteen EU countries depend on imports for more than 90% of their solid fuel consumption and only one of them imports less than 80% from countries outside of the EEA. The HHI values show little diversification in many EU countries—twelve are above 0.5. Furthermore, thirteen countries have increased their HHI over the past ten years.
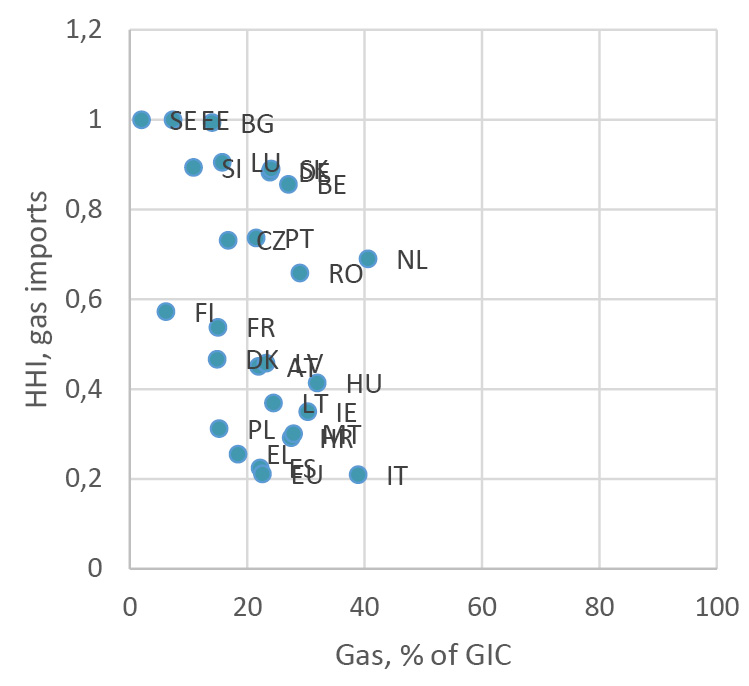
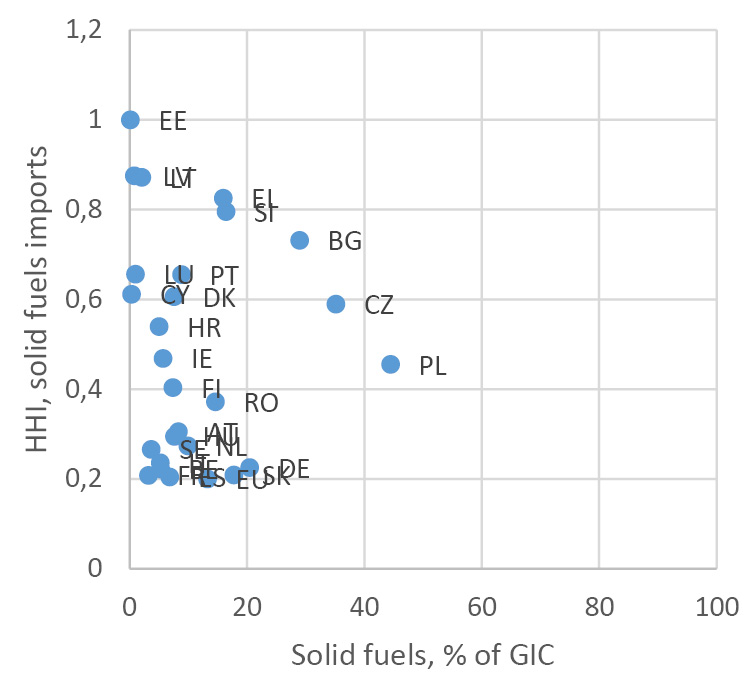
Fossil-fuel import dependence and the concentration of importers’ market shares are more worrying the higher the share of a given fuel in the energy mix of a country. Nearly half of EU MS have very high concentration indices of gas imports (Figure 1.12a), but those with the highest HHI values use less natural gas relative to other fuels. Over the past ten years, many of those countries that are most dependent have worked to diversify the sources of their gas imports. For petroleum products, there is much lower concentration of import sources (Figure 1.12b). Regarding solid fuels, their share of the energy mix has been declining over the few past years and is below 20% for the majority of EU countries.
Imports of solid fossil fuels are also very concentrated among a few importers across EU countries (Figure 1.12c), with twelve countries having an HHI above 0.5. While the use of solid fossil fuels is declining in the EU and is projected to decline even faster in the next decade, there are still countries that use a lot of coal and lignite in their energy mixes. From a pure security of supply perspective, solid fossil fuels are less problematic than coal and gas, as the number of exporting countries is much larger and transportation and storage are fairly easy.
|
a. Natural gas |
b. Total petroleum products |
|
|
|
c. Solid fuels |
|
|
Fig. 1.12 Share of fossil fuels in gross inland consumption (GIC) and concentration index (HHI) for the imports by type of fuel.
Source: Eurostat and EIB staff calculations.
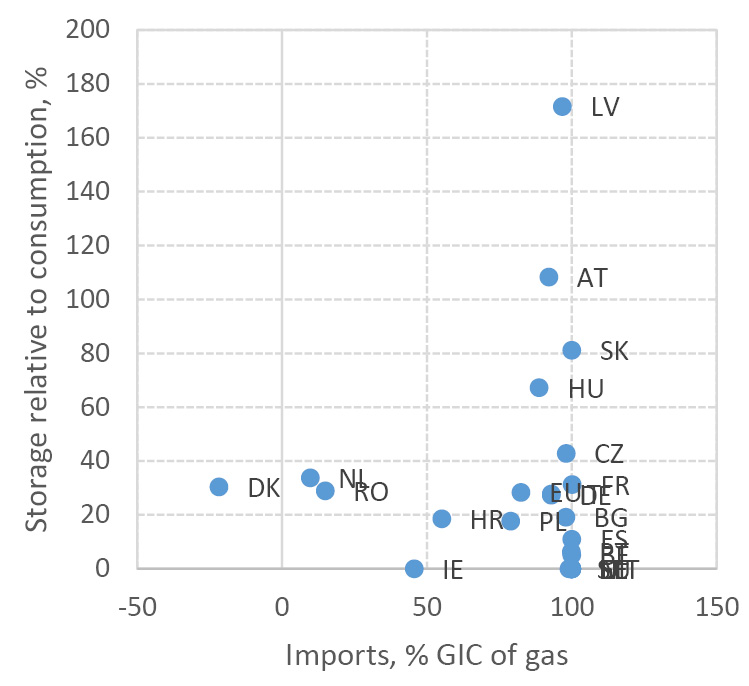
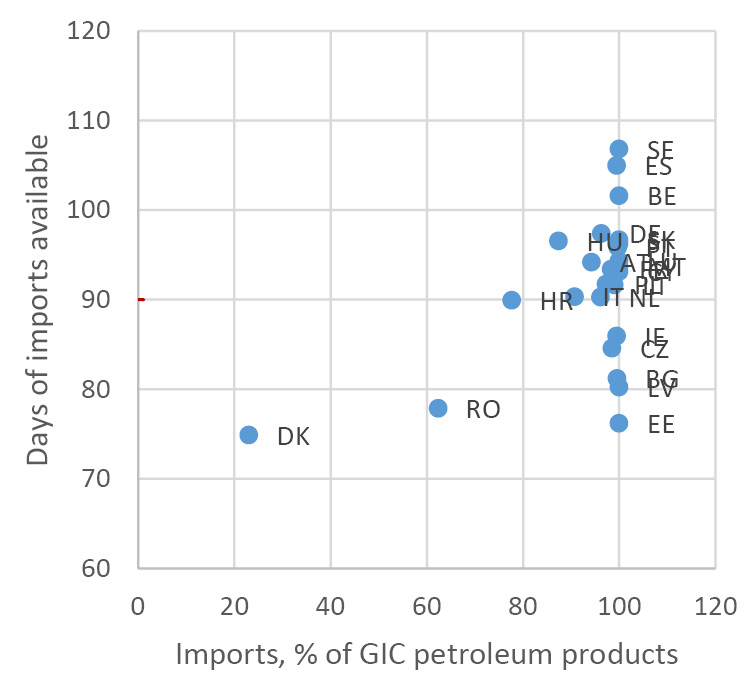
An important tool for smoothing short-term fluctuations in imports is the maintenance of fuel stocks. The importance of this approach grows with the level of a given country’s import dependence. Oil storage in the EU is governed by an EU law that mandates the obligation to maintain a minimum reserve of ninety days of average daily net imports of oil and petroleum products, or sixty-one days of daily average consumption, whichever of these two is greater (Council Directive 2009/119/EC). Such storage provides a buffer in the case of short-term supply disruptions (Figure 1.13b). Natural gas storage is much more heterogeneous. Not all countries have the capacity to store natural gas and, for some countries, existing capacity may be low relative to consumption (Figure 1.13a). Even fewer countries have the necessary infrastructure and geographic position to import LNG. This asymmetry in storage capacity and in the capacity to import LNG poses additional challenges to the security of gas supply within the EU, especially in the short term. In the medium term, the security of energy supply in the various EU countries would benefit from better connections between countries, new storage capacity, and clear fuel sharing agreements.
|
a. Natural gas storage and import dependence. |
b. Petroleum products emergency stocks and import dependence. |
|
|
Fig. 1.13 Oil and gas storage in the EU.
Source: Eurostat and EIB staff calculations.
The high import dependence of EU countries makes them more vulnerable to the volatility in energy markets caused by the war in Ukraine. Threats of disruptions and fuel shortages are looming large. An embargo on Russian fossil fuels poses substantial difficulties for many European countries, because Russia is also a large supplier of oil and coal for the EU. In 2020, Russian imports to the EU account for about 26% of crude oil imports and 49% of hard coal imports. The EU has already imposed partial bans on coal and oil imports from Russia, which have increased oil and coal prices. These increases have reinforced an upward trend in energy prices that appeared as early as during the second half of 2021. This was due to a confluence of several forces. First, the EU economy rebounded strongly following the easing of restrictions related to COVID-19. In addition, European weather conditions were not very favourable for renewable electricity generation, especially for wind generation. Finally, Russia was reluctant to supply additional quantities of gas on spot markets and deliberately drew down gas stocks from European gas storage facilities owned by Gazprom (IEA, 2021; EC, 2022c). Energy price increases have fuelled inflation around the world, reducing real incomes. The macroeconomic consequences are felt in the EU and elsewhere, as demand weakens and corporations face increasing cost pressures.
High energy prices and potential shortages of natural gas are having signficant negative effects on the European economy by reducing real disposable income, and consequently aggregate demand, and by increasing uncertainty. Weak aggregate demand and uncertainty, in turn, negatively affect investment. As a result, the likelihood of a recession in many EU countries starting in 2022 has increased substantially.
1.7 Improving Security of Energy Supply in the EU: REPowerEU
While diversifying oil and coal imports appears feasible, despite higher prices, diversification of gas imports remains a major challenge. According to Eurostat, in 2020, gas imports from Russia to the EU amounted to around 183 billion cubic metres (bcm), which constituted some 35% of EU total gas imports. Some 169 bcm (92%) came via pipelines and the rest was LNG. The European Commission estimates that it is possible to substitute around two thirds of Russian imports by the end of 2022 and, after implementing the REPowerEU package, to fully substitute Russian gas imports by the end of 2030 (EC, 2022b). With European gas infrastructure oriented towards gas imports via pipelines from Russia and relatively small LNG capacity, it becomes very difficult to diversify gas suppliers. Thus, diversification will ensure the substitution of about a third of Russian gas imports by the end of 2022. The remaining one third should be substituted with improved energy efficiency and reduced demand for energy.
After 2022, the last third of Russian imports could be gradually replaced by a number of different energy sources and savings. About 60 bcm can be replaced by diversification of imports, notably LNG (Figure 1.14). The use of green hydrogen and biogas could replace another 73 bcm. The remaining Russian gas imports could be substituted by stepping up energy efficiency and deployment of renewable energy sources, as well as further electrification of industrial processes.
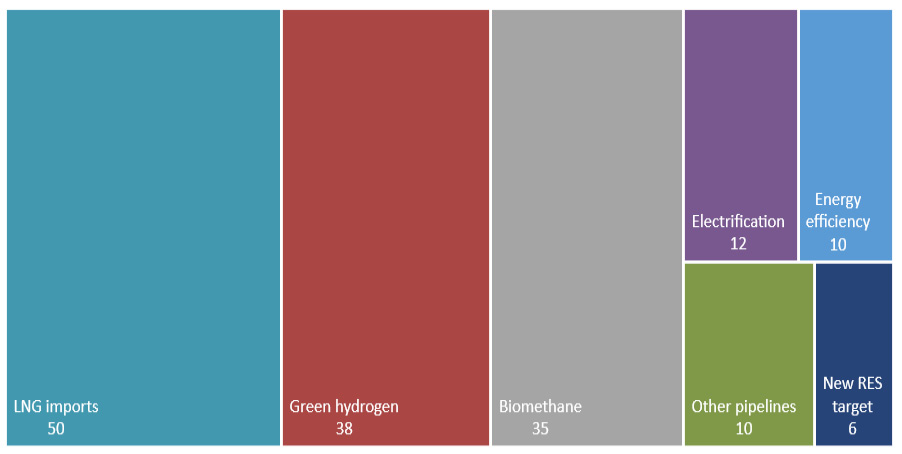
Fig. 1.14 Replacing natural gas imports from Russia by 2030, billion cubic metres.
Source: European Commission. The target for Renewable energy sources (RES) is expected to increase from 40% to 45% by 2030 (new RES target in the figure).
The REPowerEU plan is ambitious and comes on top of the EC Fit for 55 policy package, which aims to reduce greenhouse gas (GHG) emissions in the EU by 55% relative to 1990 by 2030. The measures of REPowerEU can be classified broadly in three main categories: energy savings, diversifications of fossil fuels suppliers and acceleration of the transition to renewable energy sources. Some of these measures involve the implementation of large and complex investment projects. Others are easier to implement. In the short term, by the end of 2022, the focus will be on the latter.
One such measure is the diversification of gas imports away from Russia. This could be achieved mostly through increased LNG imports, as well as pipeline imports from Azerbaijan and Algeria. This diversification also comes with a requirement to fill gas storage capacity to at least 80% by the beginning of the winter 2022–2023. Common purchases of gas via the EU energy platform will help achieve better deals. Energy saving measures, such as nudging citizens and businesses to reduce energy consumption, where possible, are another short-term measure with a potentially significant effect. Ramping up the production of biogas is a further route to achieving this measure.
In the medium to long term, measures will focus on investment in renewable generation capacity and transmission infrastructure, both for electricity and natural gas, with the requirement that gas infrastructure shall be used later for transport of hydrogen and other renewable gases. A concrete step towards the promotion of renewable projects is the proposed increase of the target for renewable electricity generation from 40% to 45% by 2030. Increasing the target for energy efficiency from 9% to 13%, another proposal in REPowerEU, will help to reduce energy demand in the medium term. Measures to decarbonise industry using more hydrogen and biogases are also envisaged.
The European Commission estimates that these measures will cost about €300bn by 2030, of which some €210bn should be spent by 2027. Compared to investment needs for the implementation of the Fit for 55 policy package, this amount is not so large, but it is nevertheless in addition to this ambitious policy initiative. Financing will come from various sources, like additional grants and unused loans from the Recovery and Resilience Facility, from transfers of up to 12.5% from Cohesion Funds and the European Agricultural Fund for Rural Development, and from selling GHG emission permits from the market stability reserve.
There are significant bottlenecks in the implementation of REPowerEU and these are addressed via a number of measures. Planned rapid deployment of solar capacity should be supported by initiatives like the mandatory installation of rooftop photovoltaics for all new commercial and public buildings by 2025 and for new residential buildings from 2029. Furthermore, an initiative to identify and promote “go-to areas” for renewable energy infrastructure, with fast-tracked permitting, short planning times, and without foregoing environmental due diligence, should help speed up the deployment of renewable generation capacity.
The significant scale-up of new renewable generation capacity requires the availability of skilled workers to install and maintain it. Similarly, more skilled workers are needed to install and maintain other technologies available to consumers and industries, like heat pumps or hydrogen installations. The EC plans to address this problem with retraining and reskilling programmes such as Pact for Skills, ERASMUS+ and the Joint Undertaking on Clean Hydrogen.
1.8 Conclusion
The need for investment remains huge: In addition to the resources needed for REPowerEU, the EC assessed that the (existing) investment needs amount to €650 billion per year up to 2030 for the twin transition, of which €520 billion accounts for the green transition alone. This amounts to 20% of EU GFCF in 2021, or 4.5% of GDP in 2021. But the question of whether public investment will increase sufficiently to meet these investment needs has become less certain since the war in Ukraine began. In addition, public investment might focus more on increasing the economy’s resilience to shocks. Certain investments in resilience, such as in military resilience, have little or no impact on average growth.
Member states predict that their public investment expenditures will rise over the coming years. The EU will provide substantial support in particular for Eastern and Southern European countries. The challenge is now to effectively deploy those funds. The fact that only 3% of the targets and milestones of the RRF have been met so far, when all investments need to be implemented by the end of 2026, illustrates the difficulties that member states face in implementing the projects. Financial conditions have become constrained, particularly for Southern European countries, and may reduce their ability to fund investment spending domestically.
Since the start of the Ukraine war, investments in energy security have become a new priority. Clearly, REPowerEU is well co-ordinated with policy actions related to the EU 2050 target of a net-zero carbon economy and the intermediate target of a 55% reduction of GHG by 2030. It stresses the role of EU leadership and co-ordination, but also emphasises the important role of national governments. Political economy constraints, however, may undermine the ambitious plan. Until now, the responses of national governments to skyrocketing energy prices, partly caused by the war in Ukraine, have been mixed, and have not always aligned with the green transition, or in some cases have even outright postponed it. The increasing share of coal electricity generation, as a reaction to high natural gas prices is one such development. The implementation of policies, providing general subsidies for fossil fuel consumption in many countries, is another. While these are inefficient because part of the subsidy ends up with the sellers, they are also detrimental to the goal of reducing the use of fossil fuels.9
At the macroeconomic level, the focus of public policy needs to remain on stimulating investment in the private sector. This support does not necessarily have to involve subsidies. Turning the proposals of the Fit for 55 policy package into legislation will go a long way in incentivising private investment. An important element of generating investment will be the continued implementation of reforms that lower the barriers for private-sector investment. Some of the necessary policy reforms also feature in member states’ plans for implementing the Recovery and Resilience Fund. Aside from regulatory reforms, streamlining administrative processes is one pathway that member states have already embarked on in order to accelerate the green and digital transitions.
References
Brasili, A., G. Musto and A. Tueske (forthcoming) “Complementarities between Public and Private Investment in European Regions”, presented at the workshop: Scarring, hysteresis, and investment in Europe in Bruges Nov. 23–24.
Cerniglia, F., F. Saraceno, and A. Watt (2021) A European Public Investment Outlook, Cambridge: Open Book Publishers, https://doi.org/10.11647/obp.0222.
EC. (2014) “Member States’ Energy Dependence: An Indicator-Based Assessment”, European Economy Occasional Papers 196, European Commission: Brussels, https://ec.europa.eu/economy_finance/publications/occasional_paper/2014/pdf/ocp196_en.pdf.
EIB (2007) “An Efficient, Sustainable and Secure Supply of Energy for Europe”, EIB Papers 12, https://www.eib.org/en/publications/eibpapers-2007-v12-n02.
EIB (2022) “Recovery as a Springboard for Change”, EIB Investment Report 2021/2022, European Investment Bank: Luxembourg, https://www.eib.org/en/publications/investment-report-2021.
EC (2022a) Fiscal Policy Guidance for 2023, European Commission: Brussels, https://ec.europa.eu/info/sites/default/files/economy-finance/com_2022_85_1_en_act_en.pdf.
EC (2022b) RePower EU Plan, Communication from the Commission to the European Parliament, the European Council, the Council, the European Economic and Social Committee and the Committee of the Regions, European Commission: Brussels, https://eur-lex.europa.eu/resource.html?uri=cellar:fc930f14-d7ae-11ec-a95f-01aa75ed71a1.0001.02/DOC_1&format=PDF.
EC (2022c) Quarterly Report on European Gas Markets, 14 (3). European Commission: Brussels, https://energy.ec.europa.eu/system/files/2022-01/Quarterly%20report%20on%20European%20gas%20markets%20Q3_2021_FINAL.pdf.
EC (2022d) Digital Economy and Society Index (DESI) 2022: Thematic Chapters.” European Commission: Brussels.
EFB (European Fiscal Board) (2019) Assessment of EU Fiscal Rules with a Focus on the Six and Two-pack Legislation. European Commission: Brussels, https://ec.europa.eu/info/sites/default/files/2019-09-10-assessment-of-eu-fiscal-rules_en.pdf.
IEA (2021) What is behind Soaring Energy Prices and What Happens Next?, International Energy Agency: Paris, https://www.iea.org/commentaries/what-is-behind-soaring-energy-prices-and-what-happens-next.
Pisani-Ferry, J. (2019) “When Facts Change, Change the Pact”, Project Syndicate, April 29, https://www.project-syndicate.org/commentary/europe-stability-pact-reform-investment-by-jean-pisani-ferry-2019-04?barrier=accesspaylog.
Pisani-Ferry, J. And O. Blanchard (2022). “Fiscal Support and Monetary Vigilance: Economic Policy Implications of the Russia-Ukraine War for the European Union”, Peterson Institute for International Economics Policy Brief 22–05, https://www.piie.com/publications/policy-briefs/fiscal-support-and-monetary-vigilance-economic-policy-implications.
1 See the EIB Investment Report 2021/2022 “Recovery as a Springboard for Change” and last year’s 2021 European Public Investment Outlook.
2 See the 2022 European Semester National Reform Programmes and Stability/Convergence Programmes, https://ec.europa.eu/info/business-economy-euro/economic-and-fiscal-policy-coordination/eu-economic-governance-monitoring-prevention-correction/european-semester/european-semester-timeline/national-reform-programmes-and-stability-or-convergence-programmes/2022-european_en.
3 We included in this table those countries from East Europe and South Europe that specified in their Stability and Convergence plan the share of public investment that is financed thanks to the RRF; those not included did not provide this information.
4 The multipliers have been estimated using local projections in a panel dataset of EU countries. Details are available from the authors.
5 Updated on the 25 plans endorsed by the EC as of 30/06/2022.
6 Because procurement award notices are classified according to criteria different from Eurostat national accounts, expert judgement was used to identify awards related to public investment. Procurement notices only have to be published above certain thresholds and the practice of voluntary publishing depends on the member state. Award notices suffer from errors and omissions and reporting practices differ across time and member states. Not all procurement notices for goods, services, or works partly funded by the RRF may have been designated as such by the tenderer. The information on procurement awards should therefore only be treated as indicative of trends in public investment.
7 See, for example, European Commission (2022d).
8 Herfindahl-Hirschman index (HHI) of market concentration is calculated by squaring the market share of each exporting country in a country’s imports and then summing the resulting numbers. It takes values between 0 and 1. It is difficult to determine a threshold value above which concentration is high. US competition authorities, for instance, consider markets with HHI above 0.25 as highly concentrated.
9 Pisani-Ferry and Blanchard (2022) argue that targeted transfers to lower-income citizens are a superior policy option.
