
2. Public Investment and Low-carbon Transition in France: Not Enough of a Good Thing?
© 2022 Chapter Authors, CC BY-NC 4.0 https://doi.org/10.11647/OBP.0328.02
Introduction
Infrastructure policies are an essential lever in efforts to reduce greenhouse gas emissions and adapt territories to the consequences of global warming. These policies cover many fields that structure our lifestyles, such as mobility, electricity production and transport, telecommunications, and water networks. They significantly influence the patterns of energy production and consumption in the territories, as well as their degree of resilience to natural hazards. Thus, given the need for environmental transition in France, significant investment will have to be made in the coming years to transform, renovate, and maintain infrastructures throughout the country. In view of the amounts involved, these investments imply major socio-economic changes on a national scale, which it seems essential to anticipate in order to inform political decisions regarding infrastructure.
2.1 Public Investment before the Pandemic: On a Downwards Trend since 2010
What is referred to as public capital covers a wide variety of assets, such as land, residential buildings, ports, dams, and roads, but also intellectual property rights. It is necessary to break down the “wealth of the state” into these different components to understand its dynamics, considering that price (most notably land price) and volume effects may play a significant role in explaining the evolution of the different components and of aggregate figures.
We use public data from the INSEE national accounts; our analysis covers the period 1978–2021 for the decomposition of net wealth and investment. INSEE reports the consolidated level (general government) and its components, distinguishing between the central government, local governments, social security administrations, and other government agencies.
Public investment in France has seen contrasting trends in recent decades. While it was rather dynamic until the late 2000s, at the turn of 2010, the fiscal stance changed, and a substantial part of the fiscal adjustment during the sovereign debt crisis was achieved by reducing capital expenditure. Indeed, the reduction of public investment has contributed to almost a third of fiscal consolidation even though investment only represented 6% of public expenditure. The share of public investment in GDP, which had largely been above 4% since the 1960s, fell below that level in 2011 and, during the period 2015–2018, reached its lowest level since 1952.
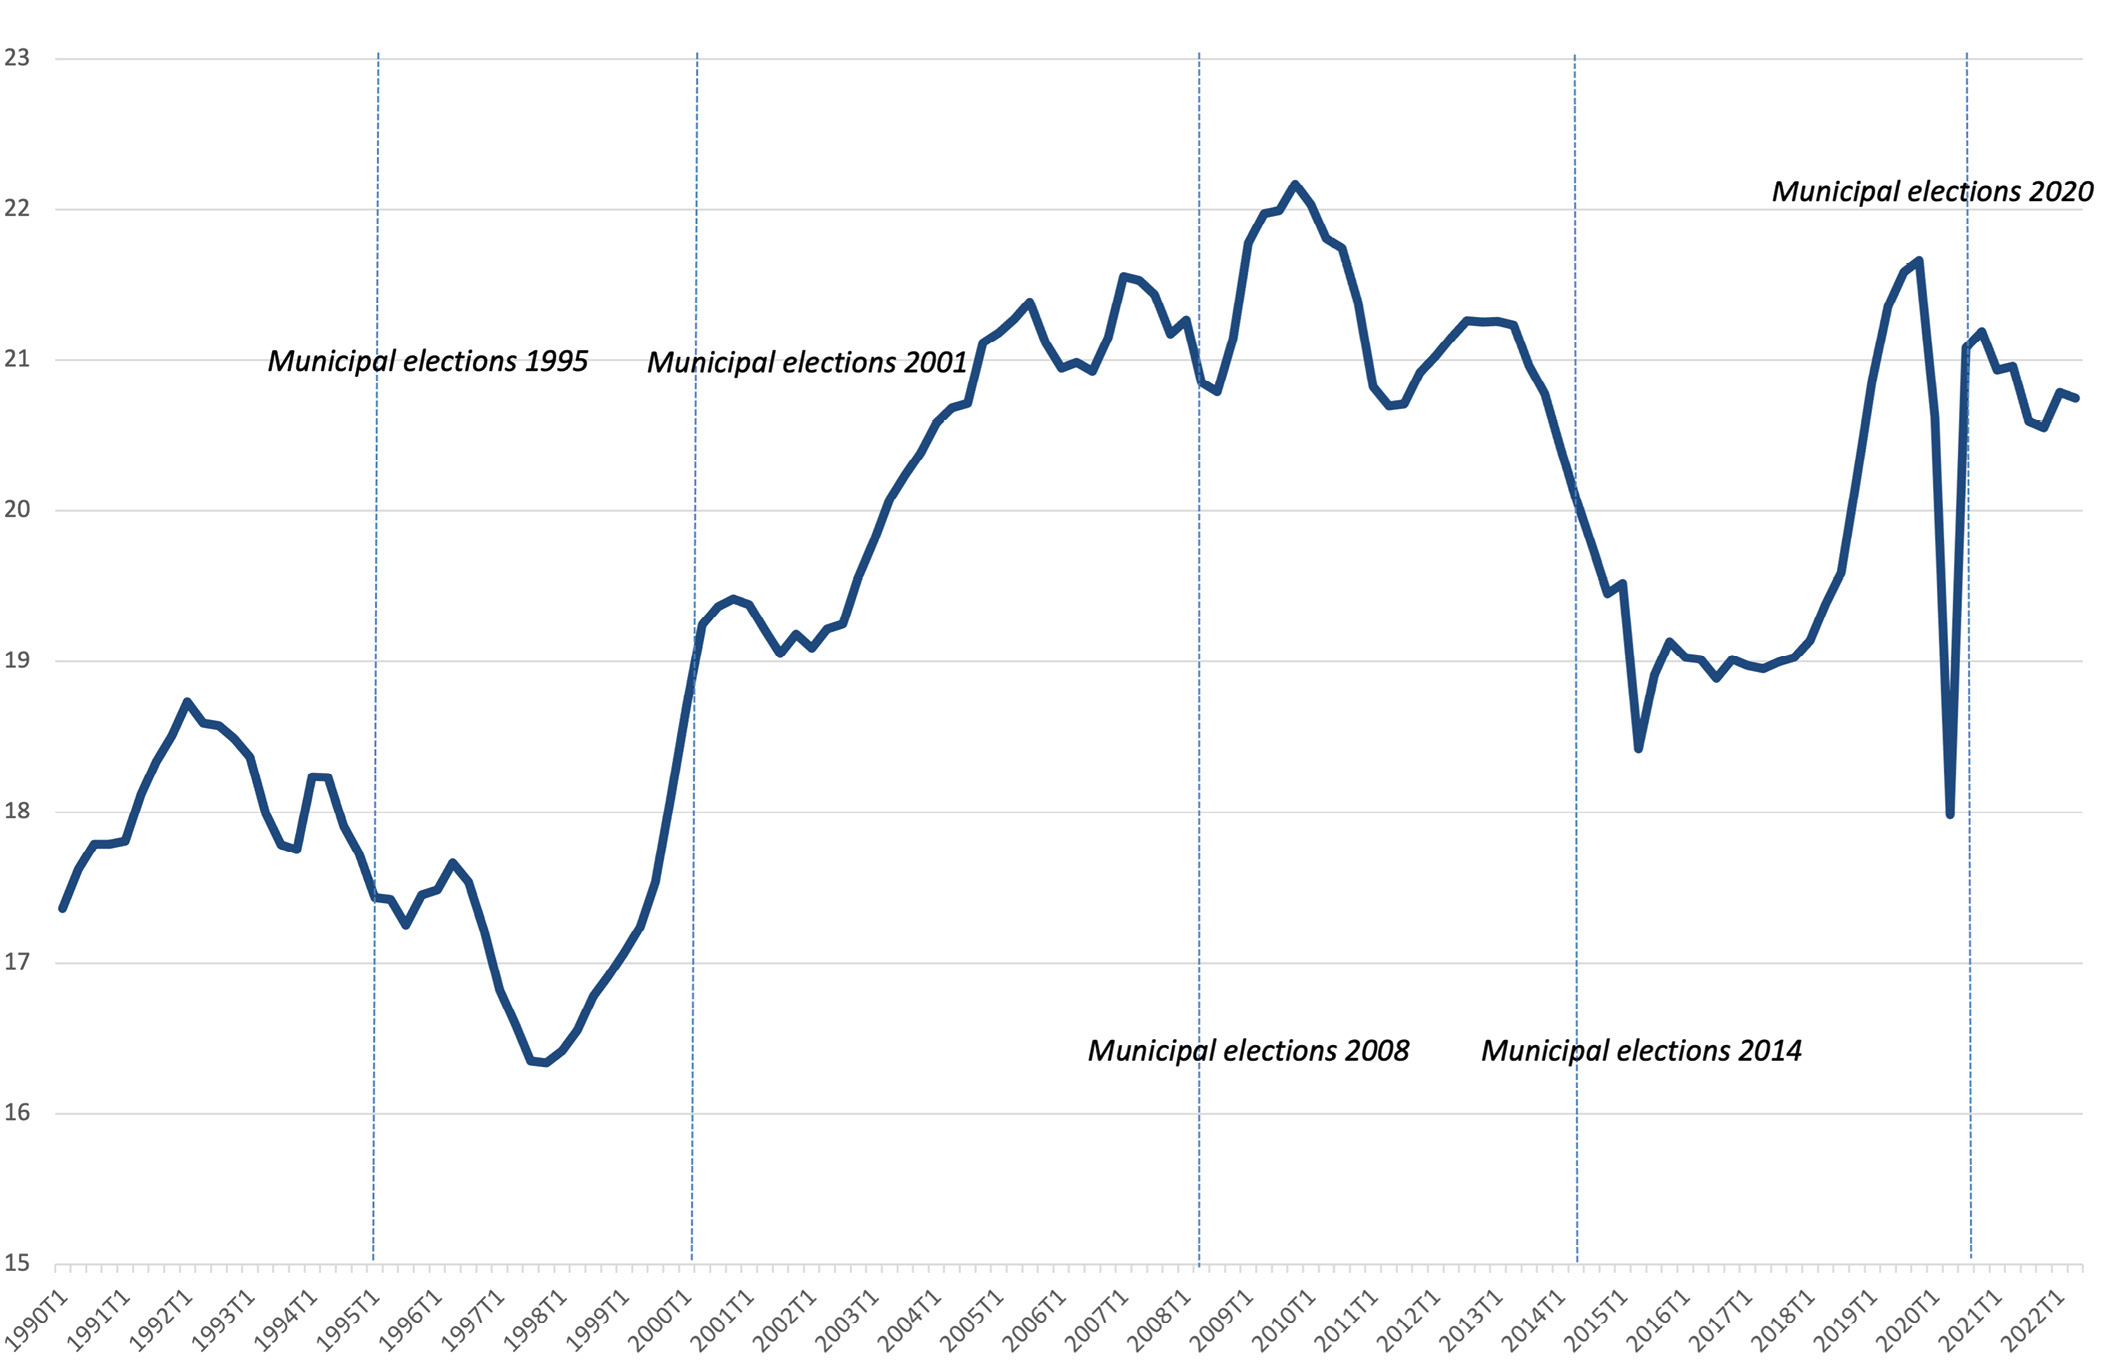
Fig. 2.1 General government investment Constant prices, in billions of euros.
Sources: Insee.
In 2021, the consolidated public sector had a positive net wealth despite the negative impact of the COVID-19 crisis (Table 2.1). Total assets held represented 169 % of GDP, of which 102 % was for non-financial assets. Financial liabilities totalled 154% of GDP. The net worth in 2021 was, therefore, 15 % of GDP, around 5,500 euros per capita.
Table 2.1 Decomposition of General Government Net Wealth
|
As a % of GDP |
In euros per head |
|||
|
1978 |
2007 |
2021 |
2021 |
|
|
Non-financial assets |
60.8 |
90.4 |
101.9 |
37 570 |
|
Financial assets |
27.6 |
52.6 |
67.2 |
24 780 |
|
Financial liabilities |
33.7 |
84.9 |
154.1 |
56 820 |
|
Net worth |
54.7 |
58.1 |
15.0 |
5 530 |
Source of data: INSEE and authors’ calculations.
While positive, the consolidated net wealth is close to its lowest level since 1978. Indeed, after reaching a record level in 2007 (58% of GDP), it has lost more than forty points of GDP in the space of fourteen years. The reasons for this sharp drop are to be found on the net financial liabilities (debt) side, which increased substantially while non-financial assets increased slightly (Figure 2.2).
This net worth is unevenly distributed among different levels of government. Indeed, it is very positive for local administrations (70% of GDP in 2021), very negative for the state (-73 % of GDP in 2021), and slightly positive for social security administrations and other government agencies (8% and 10% respectively). Broadly speaking, the central government―which runs recurrent deficits ―has accumulated public debt; low-debt local governments hold non-financial assets, be they land, buildings, or civil engineering works. With the economic and financial crisis from 2008 on, the net worth of the central government deteriorated considerably as public deficits and debt increased. On the other hand, the net worth of local governments remained high and relatively stable over the same period due to a stable value of non-financial assets and their debt.
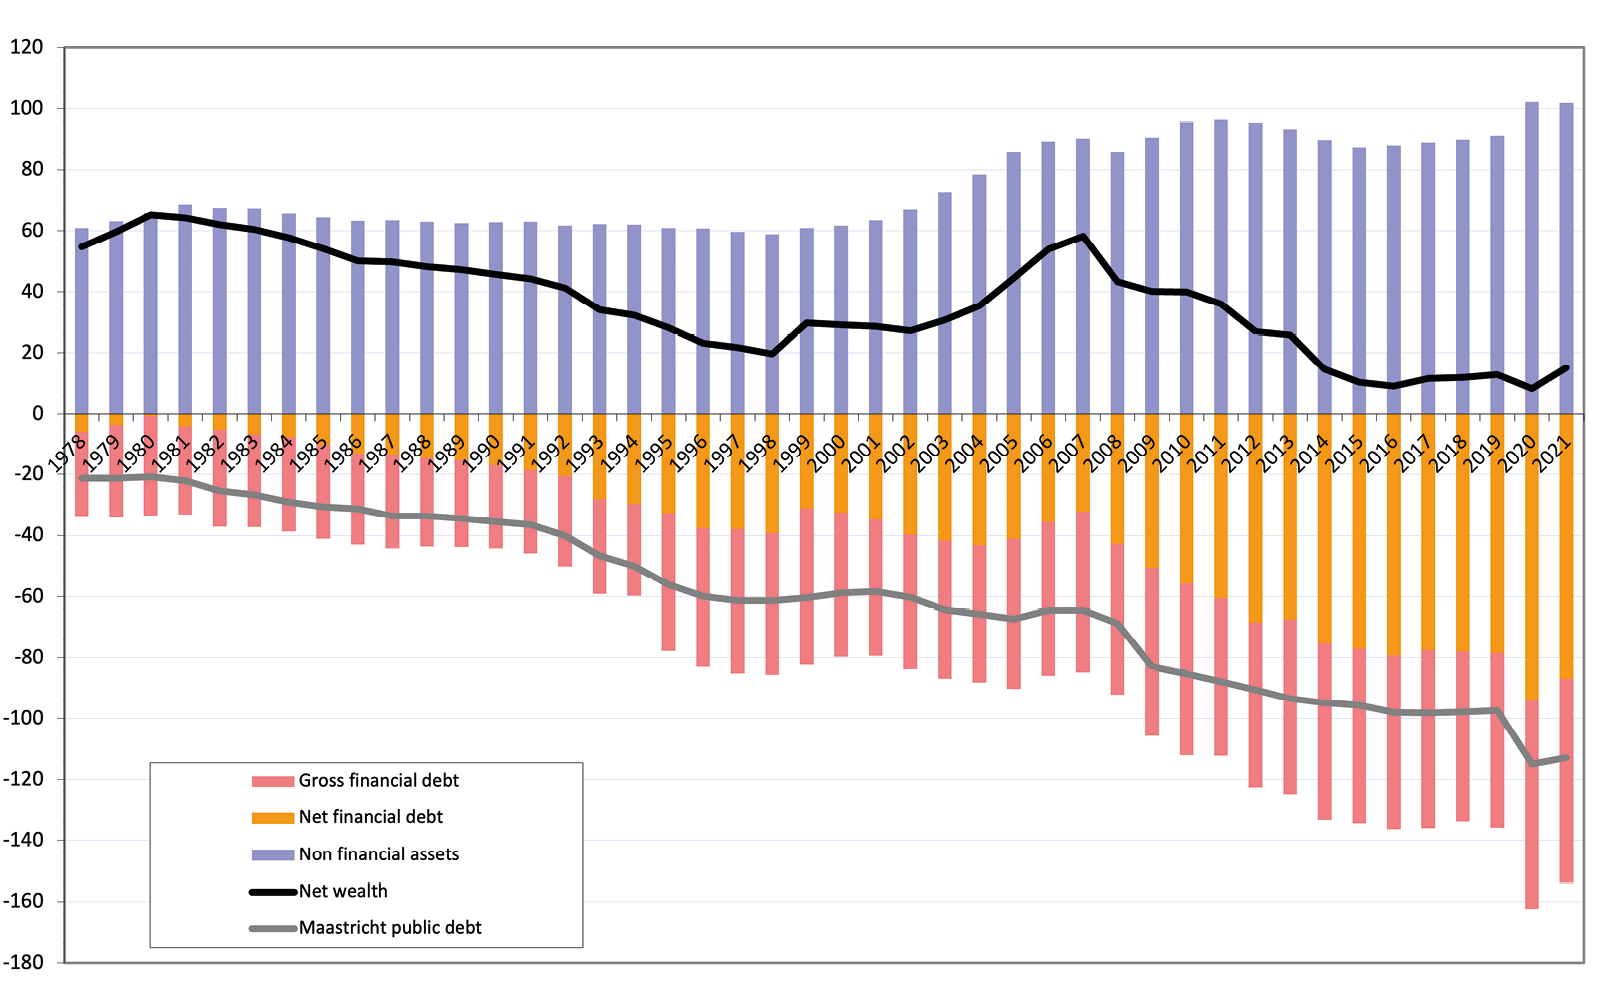
Fig. 2.2 Evolution of General Government Net Wealth as a Percentage of GDP.
Source of data: Insee. Figure created by the authors.
The analysis of gross investment needs to be complemented by the net flow of fixed assets (net investment) to assess the dynamics of the capital stock (abstracting from the effects of revaluation of the existing stock). Thus, if gross investment is greater (lower) than the depreciation of capital (consumption of fixed capital, CFC, in national accounts nomenclature), then net investment increases (decreases), and the stock of capital increases (decreases). Unlike fixed assets, non-produced NFAs (land) and inventories may experience changes in value but are not subject to the consumption of fixed capital. CFC only applies to fixed assets.
Over the period from the late 1970s to the first half of the 1990s, general government net investment was strong, averaging more than 1% of GDP per year (Figure 2.3). It even experienced a strong boom over the period 1987–1992, averaging above 1.4% of GDP per year. From 1993 to 1998, general government net investment declined sharply, reaching 0.5% of GDP in 1998, which amounted to a decrease of 1% of GDP in the space of six years. As in other European countries, this is mostly due to the effort to meet the Maastricht criteria in the run-up to the adoption of the euro: the cyclically adjusted deficit for France decreased from 4.6% of GDP in 1993 to 1.8% in 1998. Past this phase, net investment recovered, then fluctuated between 0.7% and 0.9% of GDP over the 2000–2010 period, without ever returning to the level observed during the 1980s and the first half of the 1990s. But it is mainly since 2011, following the Global Financial Crisis, that net investment has experienced a break. Then, it has been at its lowest level since the late 1970s, when wealth accounts were introduced.
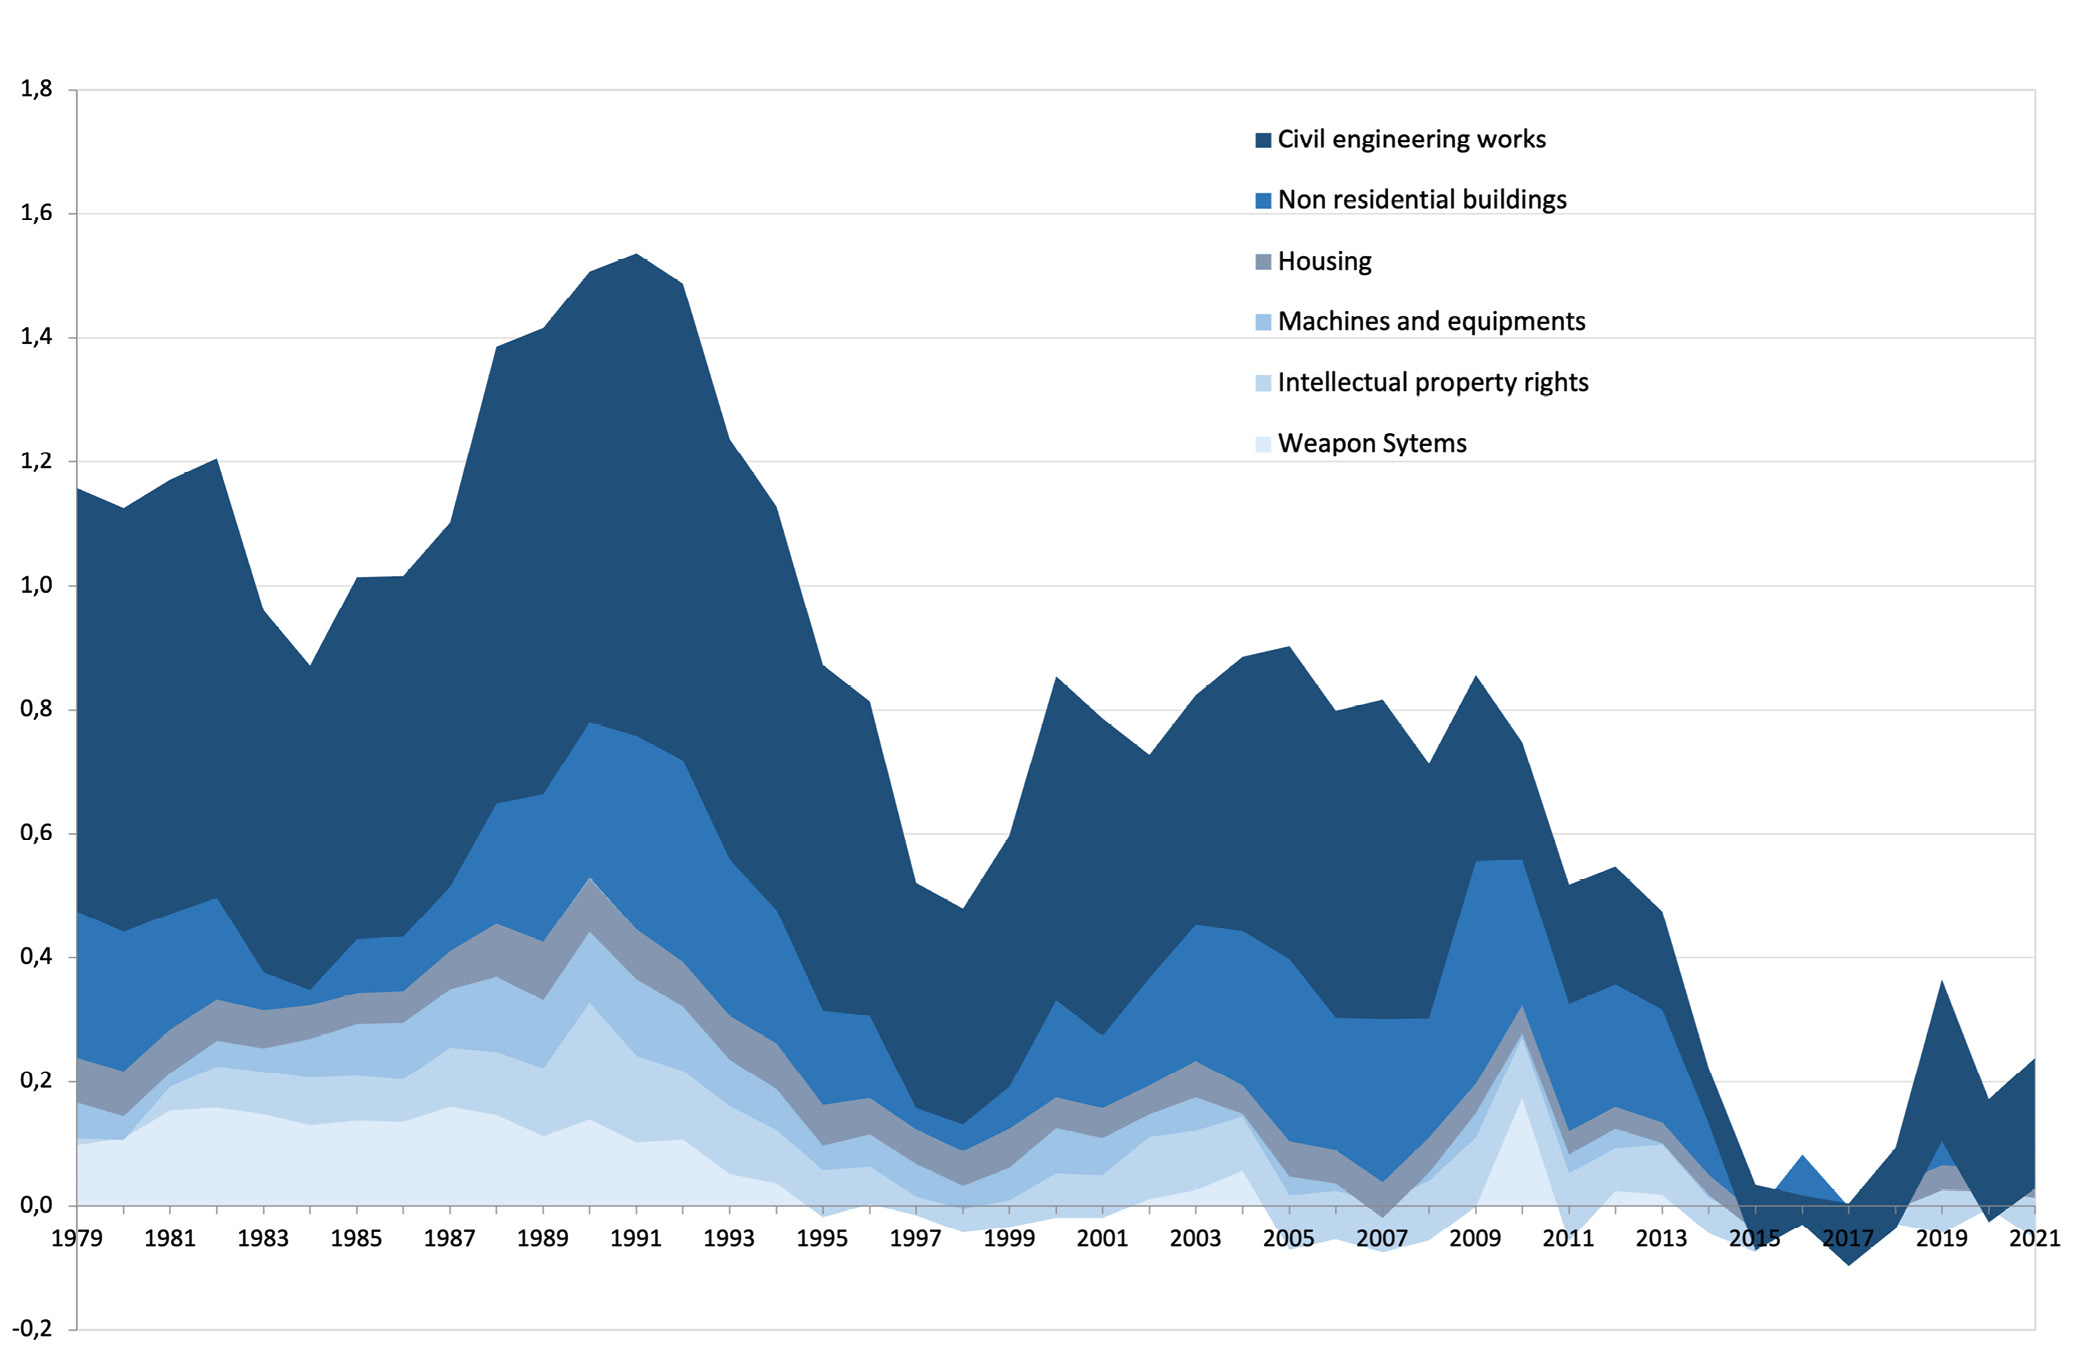
Fig. 2.3 Net General Government Investment by Component as a % of GDP.
Source of data: Insee. Figure created by the authors.
Thus, during the period 2014–2018, France spent about 0.7 percentage points (pp) of GDP (about 17 billion euros per year in constant 2021 euros) less on net investment than it did during the period 2000–2010, and 1.4 pp (approximately 35 billion euros per year in constant 2021 euros) less than during the period 1990–1992.
The picture that emerges from the analysis of stocks and flows is rather consistent and gives two main messages: the first is that public investment and the stock of capital have been largely affected by the macroeconomic cycle. In the two significant phases of fiscal consolidation―the run-up to adopting the euro in the 1990s and the aftermath of the sovereign debt crisis―investment was strongly reduced. Especially in the latter case, net investment turned negative to zero for all levels of government, thus reducing the stock of capital that, before the pandemic, had dropped to an all-time low. The second message that emerges, in particular from the analysis of stocks, is that despite these trends in investment, the capital stock in France is still significant (and larger than in other countries). One might ask then if the effort of consolidation, and the disproportionate burden that it has laid on public investment, at least led to more sustainable public finances.
If we compare the evolution over the last twenty years of non-financial assets’ net flows in relation to the primary net financial flow (financial assets―financial liabilities―interest expenses), which we consider here as a proxy of the net worth, two sub-periods clearly emerge. The first, which runs from 1996 to 2008, can be seen as a period in which the additional public net financial debt (excluding interest expense) was more than offset by the net accumulation of non-financial assets, leading to a positive net value in this period, which means that the general government stock of wealth increased in value over this period, even abstracting from price effects. The second period, which runs from 2009 to 2021, displays a new pattern in which the net debt increase is no longer offset by an increase in public non-financial capital, generating a sharp deterioration in government net worth. The economic and financial crisis has led to a sharp increase in public debt. The fiscal consolidation began to be implemented in 2011: while, on the one hand, it has partly reduced new financial commitments, on the other hand, it has been more than offset by a reduction in the net accumulation of non-financial assets. This is yet further proof that the burden of fiscal consolidation was disproportionately laid on the shoulders of public investment. The sharp reduction in net worth, therefore, casts doubt on the effectiveness of fiscal consolidation in strengthening the public finances outlook for France.
2.2 Public Investment during the Pandemic
A recovery in public investment began in the two years before the COVID-19 crisis, with an increase of nearly 14% between the end of 2017 and the end of 2019. This shift was linked to the electoral cycle of municipal elections and the government’s desire to preserve investment within the framework of the targeted budget contract with local communities. While a partial reversal in public investment was to be expected after the municipal elections, the drop observed in the first half of 2020 is out of proportion with that observed in previous electoral cycles (Figure 2.1).
Indeed, the COVID-19 crisis and the lockdown led to a drop of 11% in public investment during the first half of 2020 compared to the last half of 2019 (with a fall of 16% during the second quarter of 2020). By comparison, the three strongest half-yearly decreases observed for the previous seventy years were between 5% and 6%. The fall in public investment during the first half of 2020 was, therefore, twice as strong as the most severe reversals since 1950.
However, from the third quarter of 2020, public investment returned close to the pre-COVID-19 level and was, at the end of the year 2020, just 2 % under its level at the end of 2019, despite the second lockdown in November and December 2020. In addition, the government voted in September 2020 on a hundred-billion-euro recovery plan (Le Plan de Relance, see Plane and Saraceno 2021), partially financed (40 billion euros) with Next Generation EU funding. The Plan de Relance includes a section on public infrastructure, with particular emphasis on the thermal renovation of public buildings, with increased planned investment from the start of the year 2021. Moreover, a new investment plan, “Build the France of 2030”, was announced in October 2021. This latter plan is intended to meet the long-term challenges, in particular the ecological transition, through massive investment to help the future technological champions of tomorrow to emerge and to support the transitions of our sectors of excellence: energy, automotive, aeronautics, and even space. Investment is therefore considered by President Macron to be as central to reviving and strengthening the economy, as well as to meeting the major challenges of tomorrow, first and foremost that of ecological transition.
2.2.1 The Paradox of an Investment-less Investment Plan
Beyond the stated ambitions of the government, the macroeconomic analysis is rather disappointing. Indeed, while public investment could be expected to be a driving force behind the catch-up in activity that began in the summer of 2020, the data from national accounts show the opposite. True, public investment was 2% below its pre-crisis level at the end of 2020; but then it contracted throughout 2021 (-3% year-on-year at the end of 2021), reaching 5% less than at the end of 2019 (which represents more than one billion euros less investment per quarter compared to the pre-crisis situation). At the same time, GDP recovered by 4.9% (year-on-year at the end of 2021) and private investment by 4.2%, the latter being well above its pre-crisis level from the second quarter of 2021 (Figure 2.4). While the start of 2022 shows a slight rebound in public investment, it remains 4 % below its pre-crisis level in mid-2022.
This contrasts particularly with the pattern observed during the subprime crisis; at the time, the weak rebound had been driven in part by public investment, with private investment falling sharply during this period of crisis. Indeed, one year after the onset of the economic crisis (during the first quarter of 2008), public investment was at a higher level than its pre-crisis level and, after two years, was 4% above its level at the start of 2008 (before the drop documented above, during the fiscal consolidation period). Conversely, two years after the start of the subprime crisis, private investment was 12% below its pre-crisis level, and GDP was still at -3%.
The contrast between the evolution of investment during the quarters following the start of the COVID-19 crisis and the subprime crisis is striking. If the measures taken by public authorities in support of incomes and of firms’ liquidity during the COVID-19 crisis have made it possible to preserve private investment, the evolution of public investment is more surprising; its weak dynamism is surprising given the recovery and investment plans announced.
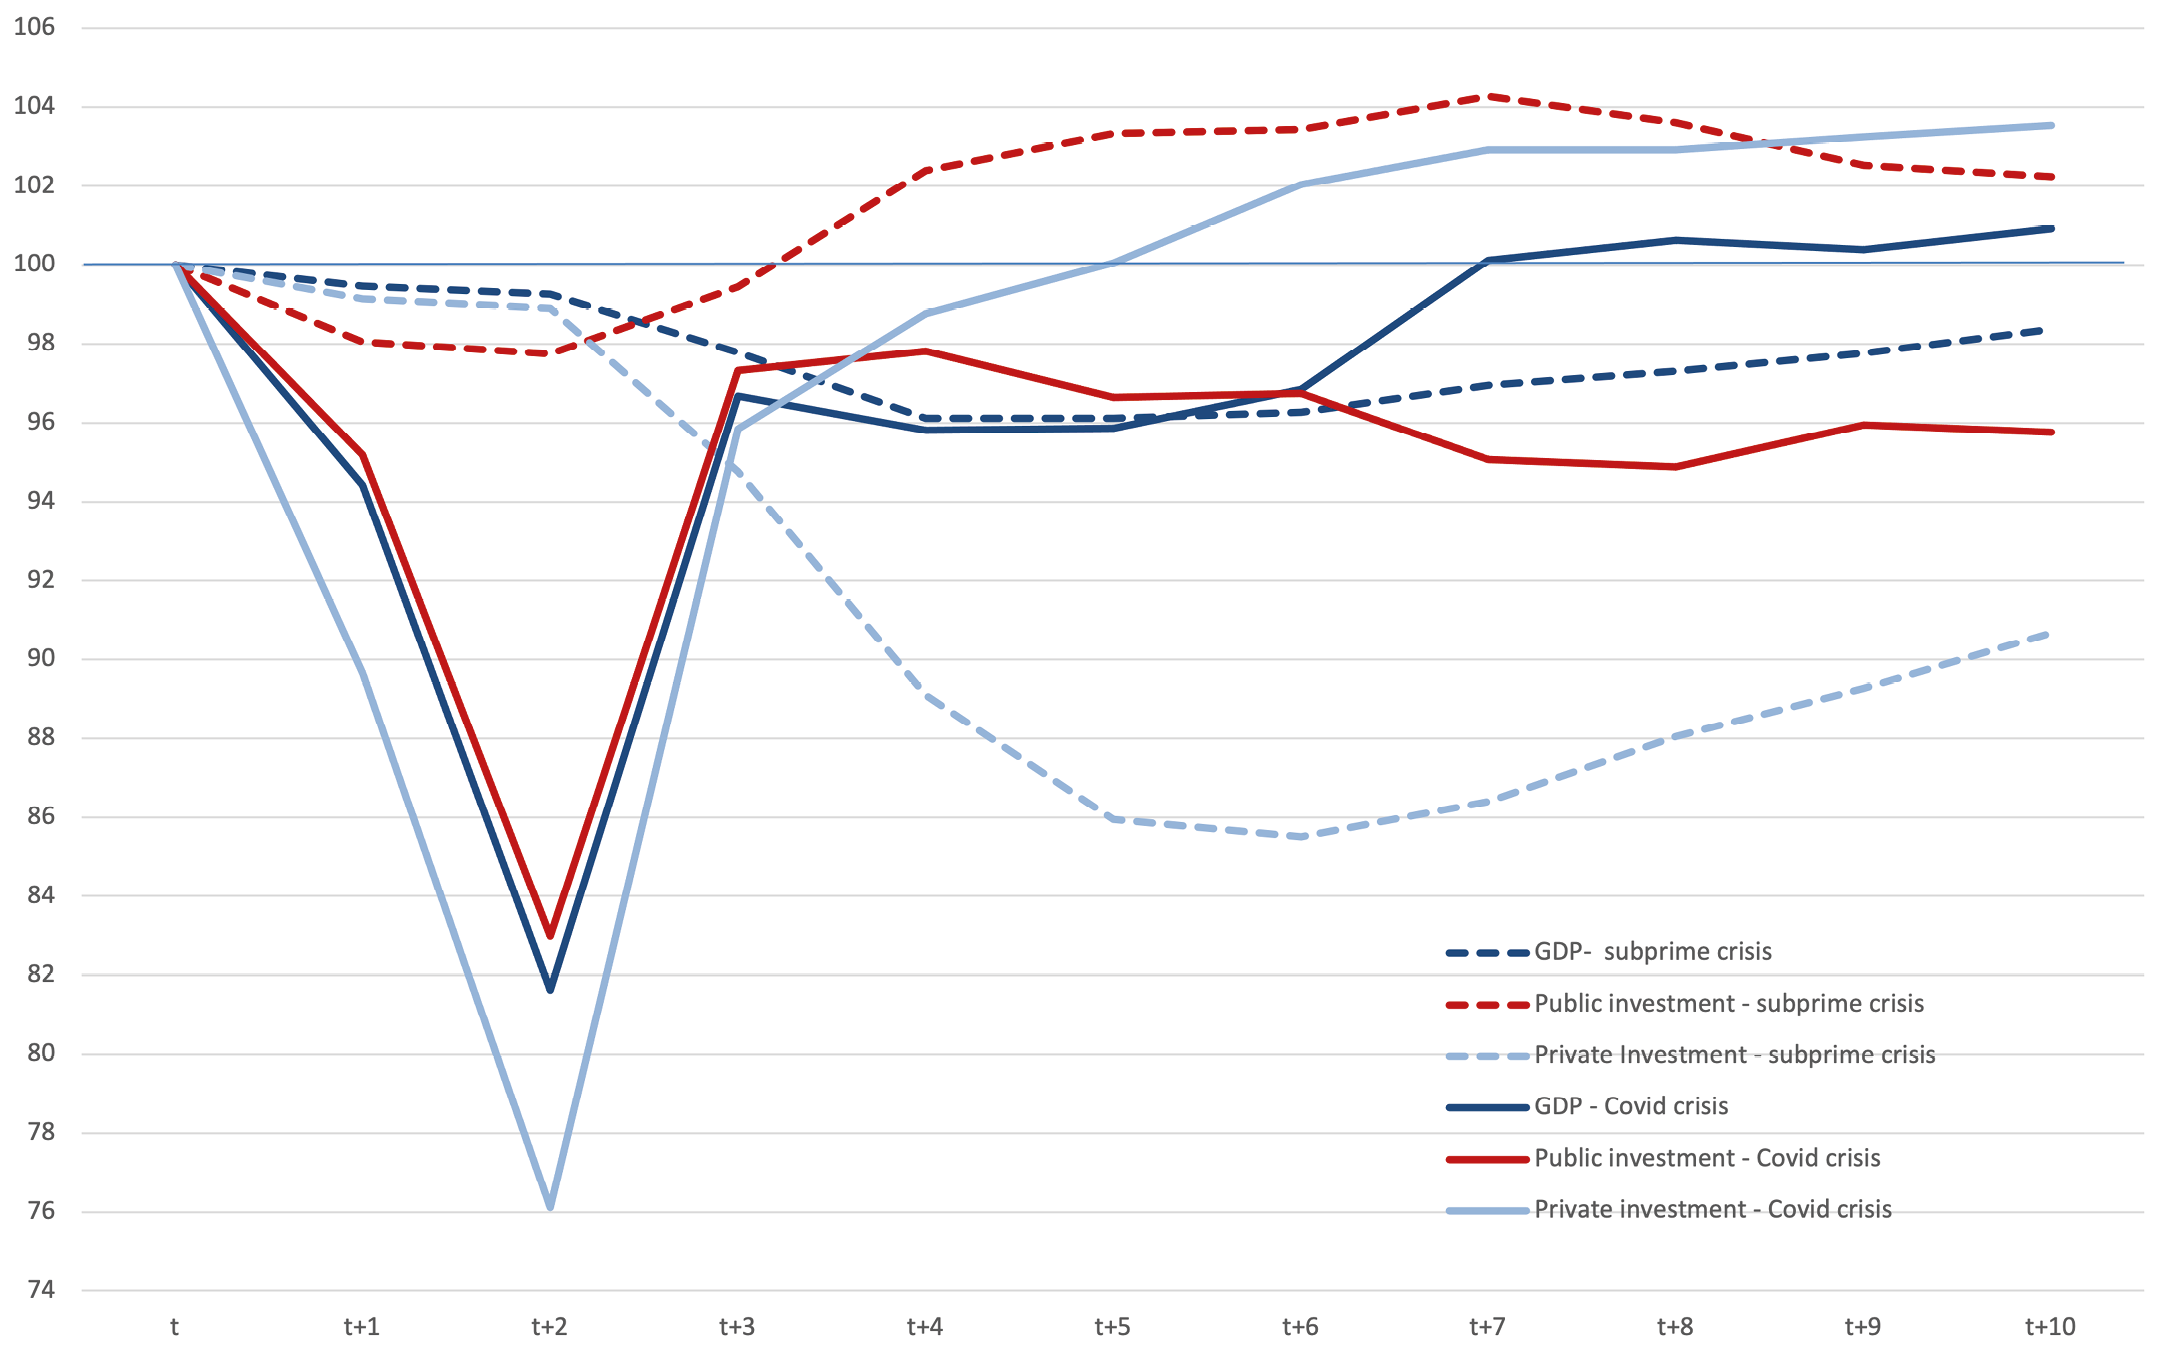
Fig. 2.4 Comparison between trajectories of GDP and investment during the COVID-19 crisis and the subprime crisis.
Sources: Insee, authors’ calculations.
2.3 Challenges and Perspectives of Low-carbon Investment: The Case of Infrastructures
In the following sections, we analyse the macroeconomic consequences of additional investment in infrastructure necessary to achieve the objectives of the French National Low-Carbon Strategy (SNBC)1 and the Multi-Year Energy Program.2 The former is France’s roadmap for fighting climate change. It defines a trajectory for reducing greenhouse gas emissions up to 2050 and sets short- and medium-term objectives through carbon budgets. The latter expresses the public authorities’ orientations and priorities for action in managing all forms of energy in the country.
We carry out a prospective analysis3 based on the development of possible scenarios constrained by physical flows and by France’s carbon budget as defined in the National Low-Carbon Strategy. We consider two credible yet contrasting scenarios designed to achieve carbon neutrality by 2050 and to ensure compliance with the short and medium-term carbon budgets. The first, the “Pro-Techno” scenario, is based on a world without major changes in current consumption and production patterns, relying mainly on technological developments and the deployment of innovations to achieve climate objectives. The second scenario, the “Sobriety” scenario, is based on a decrease in energy consumption and involves a profound change in lifestyles and consumption patterns, whether in terms of housing, mobility, or industrial production. It involves a limitation or even a significant reduction in the consumption of certain types of goods and services (e.g., individual vehicles, air transport, increased use of digital technologies, etc.).4 These two scenarios have been designed in the same way as the contrasted energy transition scenarios developed by the French public Agency for the Environment and Energy Management (ADEME 2021) and RTE, the electricity transmission system operator (RTE 2021). The Pro-Techno and the Sobriety scenarios highlight how different factors (technological or social) can concur in different proportions to the objective of carbon neutrality. These stylised scenarios could be hybridised to define a wider range of scenarios, but they nevertheless allow us to analyse the underlying macroeconomic mechanisms triggered by massive investment in low-carbon infrastructure.
This assessment only considers the additional investment compared to a scenario without low-carbon ambitions. Thus, the annual investment amounts reported below, and used as input for a macroeconomic and multi-sectoral model, are investment surpluses compared to those made in the so-called “reference” scenario. This latter scenario provides the trend path of investment in the absence of the implementation of policies compatible with respect to the SNBC objectives. The results of the macroeconomic simulations are therefore also compared to the reference scenario, and all results are given in absolute or relative variations with respect to the reference scenario.
Figure 2.5 shows the additional infrastructure investment amounts for the Pro-Techno and Sobriety scenarios by public works activity for the different components.5
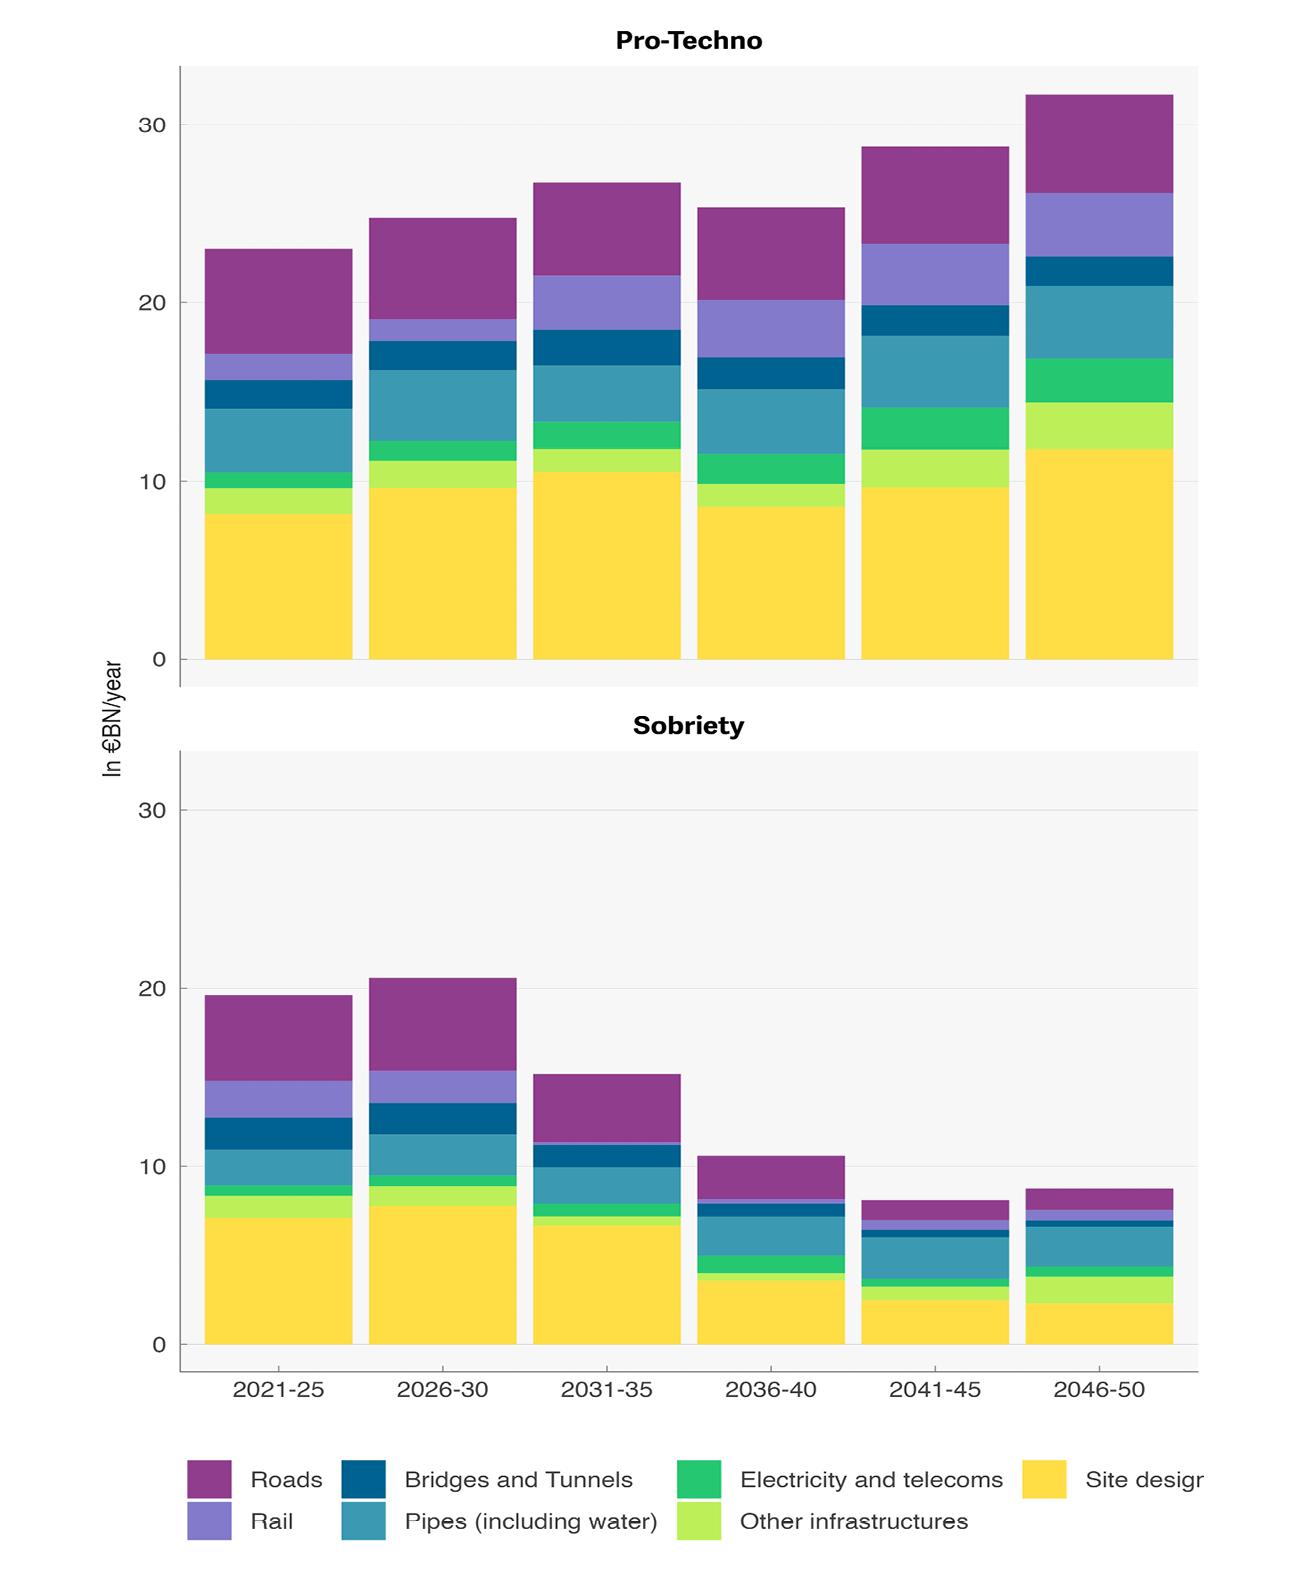
Fig. 2.5. Additional investment by scenario and by sector of activity (average annual amounts for each period).
Source: author’s calculation (based on Carbone 4, OFCE, NEO 2021).
Both scenarios imply an increase in investment in public works, including a significant share of site development work (earthworks, demolition, drilling …). However, some important differences appear:
- The amounts of additional investment in the Pro-Techno scenario are larger than in the Sobriety scenario: over the period 2021–2050, 27 billion euros (1.1 points of GDP) per year in the Pro-Techno scenario versus 14 billion euros (0.6 points of GDP) in the Sobriety scenario.
- The investment trajectory is also different. It increases over time in the Pro-Techno scenario, while it peaks in 2030 before decreasing in the Sobriety scenario. It increases from 23 (respectively 20) to 32 (respectively 9) billion euros between 2021 and 2050 in the Pro-Techno (respectively Sobriety) scenario. Thus, the investment trajectories are similar in the two scenarios up to 2030 but diverge significantly over the following decades.
- In the Sobriety scenario, the distribution of total investment among the different segments of public works activity shows significant changes in infrastructure investment choices compared to the Pro-Techno scenario, especially after 2030. In particular, investment decreases sharply in the road and rail sectors due to a lower need for mobility. Similarly, investment in site development decreases significantly after 2030 in the Sobriety scenario, which is explained in particular by a lower need for brownfield recycling and soil de-artificialisation.
2.4 Modelling Framework: The ThreeME Model
In order to quantify the socioeconomic impacts of these two infrastructure investment scenarios, we use ThreeME, a multi-sector macroeconomic model designed to assess the economic impact of energy and environmental policies (Malliet et al. 2020; Landa et al. 2018; Bulavskaya et Reynès 2018). Developed by ADEME (the French Public Agency for the Environment and Energy Management), OFCE (the French Economic Observatory), and NEO (the Netherlands Economic Observatory) in 2008, the ThreeME model has played a leading role in France’s inter-administrative and inter-ministerial debates on issues related to the macroeconomic evaluation of energy and climate policies, whether through its mobilisation during the National Debate on Energy Transition (DNTE), the evaluation of energy transition scenarios by ADEME, or the provision of this tool to the Ministry of Ecological Transition.
ThreeME is a country-level,6 hybrid, dynamic, open-source CGE model. Its sectoral disaggregation allows for analysis of the shifting of activities from one sector to another, particularly in terms of employment, investment, energy consumption, or balance of trade. An important feature of the ThreeME model is that prices are determined in a framework of imperfect competition by profit maximisation so that they do not adjust instantaneously to clear markets (prices and quantities adjust slowly). Furthermore, producers adjust their supply according to demand, and production costs include the costs of intermediate consumption, labor, and capital. These features have the advantage of allowing for situations of market disequilibrium, particularly the presence of involuntary unemployment. Note also that wages are determined by an inverse relationship between the rate of wage growth and the unemployment rate. Wages are also indexed to inflation. This framework is particularly well-suited to policy analysis. In addition to providing information about the long term, it allows for the analysis of transition phases over the short and medium terms, which is especially relevant when assessing the implementation of low-carbon policies.
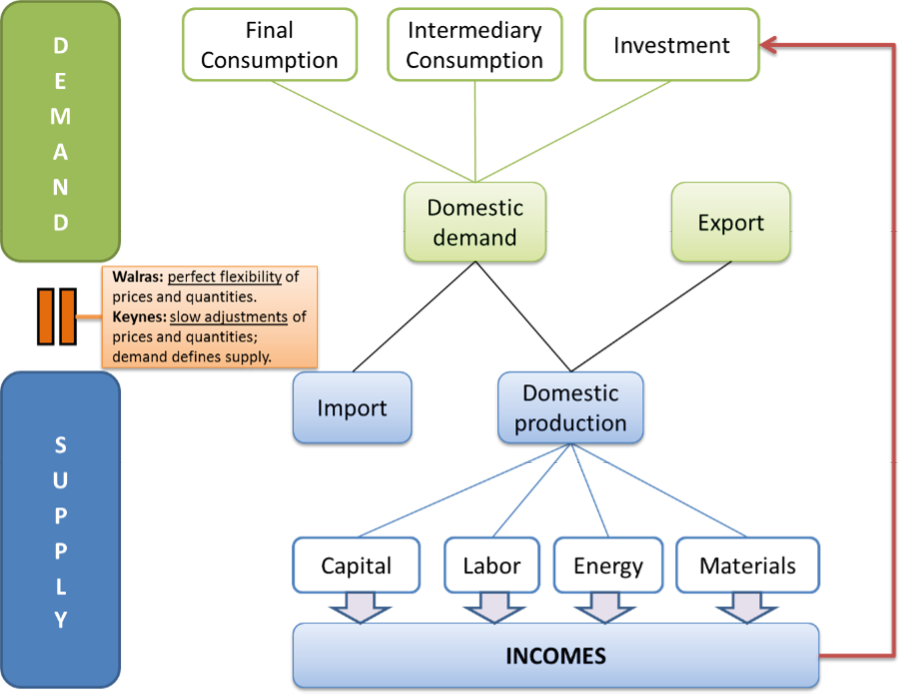
Sources: OFCE, NEO.
2.5 Macroeconomic Consequences of Additional Investment in Low-carbon Infrastructure
In both the Pro-techno and Sobriety scenarios, the increase in public investment has both a direct and indirect positive effect on economic activity. It results in increased activity in the public works sectors, with an indirect effect of increased activity in other sectors from which the public works sectors source. This growth in activity, in turn, leads to increased employment, increased household income, and increased consumption. This set of impacts is often referred to as the “multiplier effect” because the effect on GDP is greater than the initial investment. However, this increase in activity is offset by a deterioration in the trade balance, which is the result of two effects. The first is a wealth effect: the increase in demand is partly met by the increase in imported products. The second is a substitution effect: the increase in activity generates a rise in inflation and, thus, a deterioration in competitiveness vis-à-vis foreign producers, which leads to an additional increase in imports and a decrease in exports.
Considering all of the effects (multiplier and inflationary), the Pro-Techno scenario leads to an increase in GDP of 1.2% on average with respect to the baseline over the period 2021–2030 and of 1% over the period 2030–2050, compared to the reference scenario. In the Sobriety scenario, the increase in GDP is comparable over the period 2021–2030 (1% compared to the baseline scenario) but considerably lower over the period 2030–2050 (0.4%). The effects on GDP follow the trends of the trajectories of the additional investment amounts, with these amounts in the Sobriety scenario being relatively close to those of the Pro-Techno scenario over the first decade and less so over the second period.
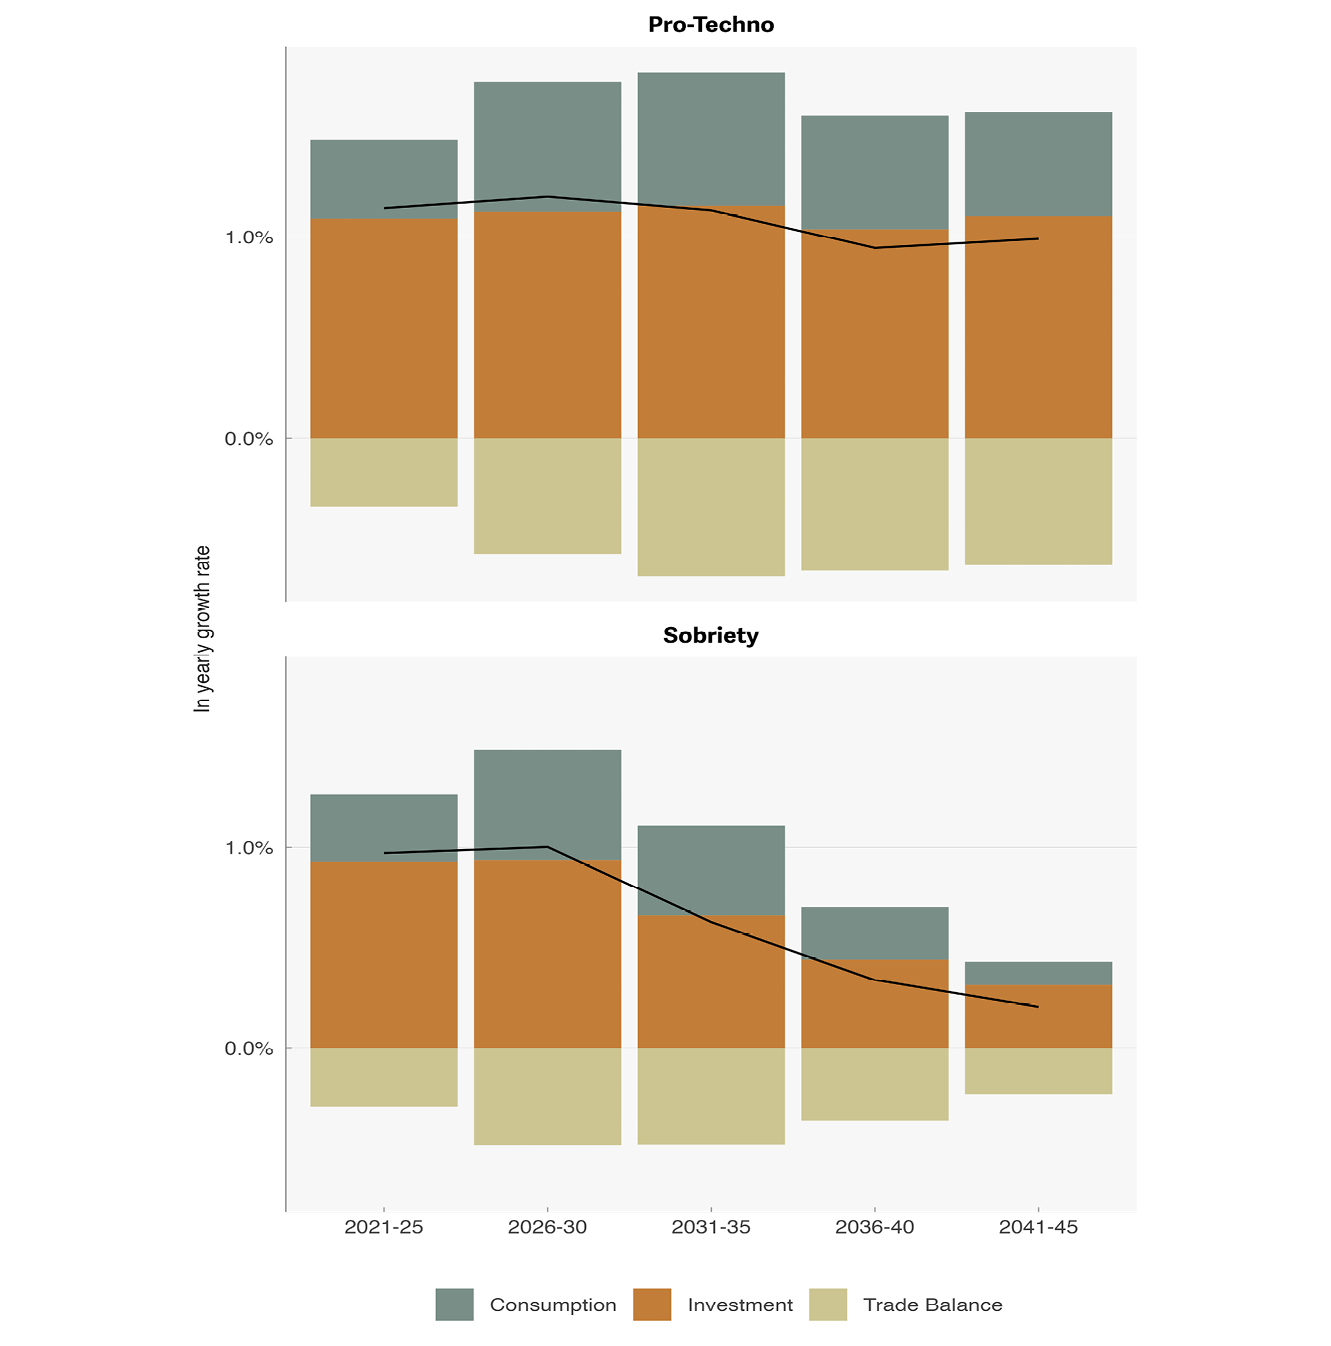
Fig. 2.7 Contribution of consumption, investment, and trade balance to additional GDP in both scenarios (model results).
Sources: ThreeME model simulations results.
In both scenarios, infrastructure investment significantly increases the number of jobs in the French economy. Compared to the reference scenario, the Pro-Techno scenario would create 325,000 additional jobs between 2021 and 2025 and 410,000 between 2026 and 2030. The Sobriety scenario would generate a similar increase in employment over these periods, although slightly less (270,000 additional jobs over the period 2021–2025 and 340,000 over the period 2026–2030). These figures correspond to net job creation (the difference between the number of jobs created and the number of jobs destroyed). This significant result reflects the magnitude of the investment made in the first decade in both scenarios, which generates many new jobs. From 2030 onwards, however, there is a significant divergence in the number of jobs created. In the Pro-Techno scenario, investment amounts remain close to those of the first decade, resulting in a similar increase in employment (of around 300,000 jobs) between 2030 and 2050.
Conversely, the Sobriety scenario is characterised by a marked decrease in investment from 2030 onwards, which leads to a more limited increase in employment in the following two decades compared to the baseline scenario (200,000 additional jobs between 2031 and 2035, and then about 60,000 additional jobs over the period 2036–2050). Overall, therefore, employment follows the initial investment trajectory in public works. The impact is positive in all sectors apart from product manufacturing and agriculture, where the number of jobs falls very slightly in the period 2036–2045.
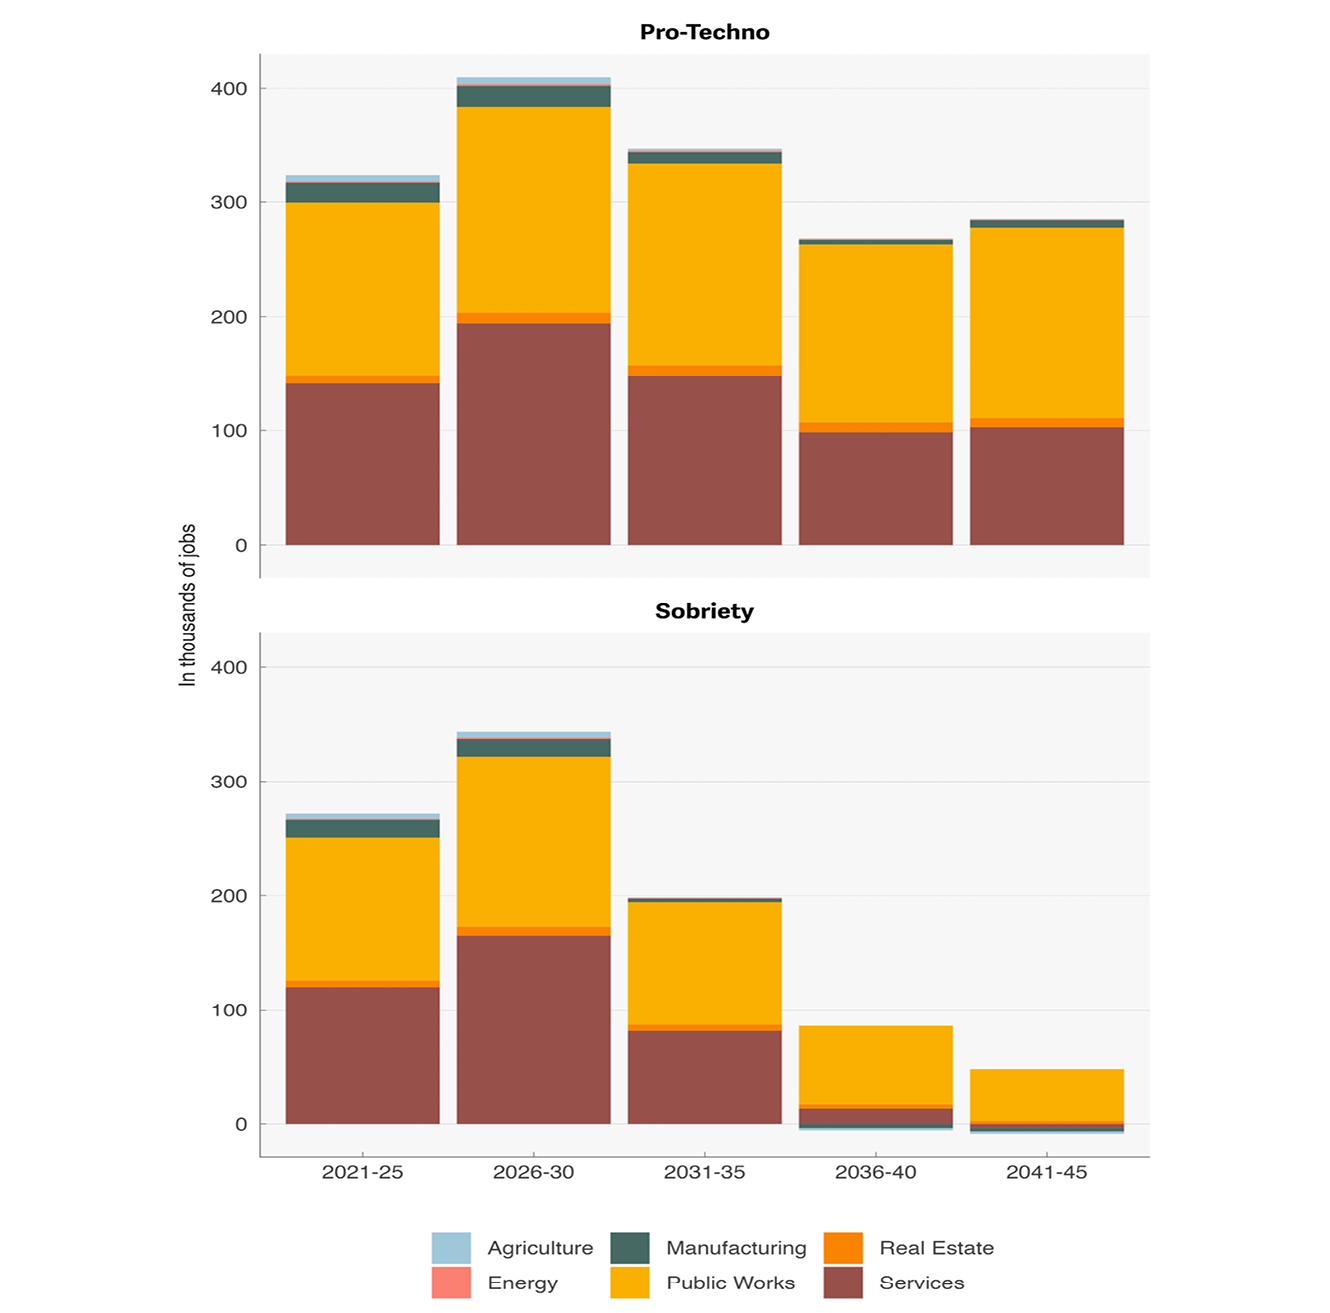
Fig. 2.8 Additional jobs by scenario and sector (model results).
Sources: ThreeME model simulations results.
The estimated economic impacts of the Pro-Techno and Sobriety scenarios are relatively similar, but a divergence appears, especially after 2030. This divergence is the direct result of the higher investment amounts in the Pro-Techno scenario, which generate higher economic activity. However, one should bear in mind that these results do not include all economic effects underlying each scenario. The choice between the Pro-Techno and Sobriety scenarios cannot be made solely based on the difference in direct GDP impact. It is, above all, a societal and, therefore, political choice. Moreover, the choice between these scenarios should be guided by other evaluation criteria, starting with their effects on health and social inequalities.
Moreover, while both scenarios lead to positive economic effects, particularly in terms of employment, they imply major changes in the various sectors of the economy, particularly in the public works sector. This implies that the increase in employment, in either scenario, is conditioned by companies’ ability to adapt their offers and supply to the new investment needs.
Finally, it should be noted that the question of financing investment in each scenario is a major one. In particular, it requires a European-level perspective and an in-depth reflection on the possible ways of financing it. The state will have to take its share of the additional effort. However, it will also strongly encourage the other players (such as local authorities and public or private operators) to invest in infrastructure. The development of innovative financing methods could also benefit infrastructure policies. In the field of water management, for example, aid schemes or charges linked to services rendered could be envisaged so that users or local authorities could jointly finance actions to protect aquatic environments or prevent natural hazards: e.g., development of flood expansion zones, alternative drilling to protect an overexploited water table, road maintenance, and support for less polluting agricultural practices.
Conclusion
While public investment slowed down over the last decades, reaching a low point with the COVID-19 crisis in 2019, French public authorities have launched a public investment plan to revive demand and pave the way toward sustainable and long-term-oriented emission reduction targets. In fact, in the context of the Paris Agreement, France has designed the French National Low-Carbon Strategy that provides guidelines for implementing the transition to a low-carbon economy. There are many ways to achieve this transition, and they imply potentially conflicting political and social choices. In particular, significant investment will be necessary in the years to come to transform, renovate and maintain infrastructures, leading to important socio-economic evolutions at the national level. The analysis carried out in this chapter investigates the macroeconomic impact of two contrasting scenarios where additional investments are injected into the economy to develop the necessary infrastructures needed to achieve carbon neutrality by 2050. The Pro-Techno scenario relies on massive technological development and innovations while the Sobriety scenario is based on a change in lifestyles and a reduction in energy consumption. Both scenarios lead to a positive impact on economic activity in the medium term, while being compatible with the long-term objective of a carbon-neutral economy. However, since the Pro-techno scenario assumes a larger public investment in infrastructure beyond 2030 (technological deployment), the positive macroeconomic impact is greater in the long run than in the Sobriety scenario. These two scenarios are extreme and contrasting, they have allowed an analysis of the effects of investment shocks compatible with carbon neutrality at mid-century, and thus inform public decision-making. The actual implementation transition-oriented policies will certainly have to go through a combination and co-existence of innovations of different natures, whether technological or behavioral, and have effects that are somewhere in the middle between the two extreme scenarios. This will depend, among other things, on the political framework in which things take place. In particular, questions of financing and coordination with other countries and within the EU framework will be essential.
References
Agence de l’Environnement et de Maîtrise de l’Énergie-ADEME (2021) Prospective Transition(s) 2050 Report, https://transitions2050.ademe.fr/en.
Bulavskaya, T. and Reynès, F. (2018) “Job Creation and Economic Impact of Renewable Energy in the Netherlands”, Renewable Energy, 2018–04 (119), 528–38, https://www.sciencedirect.com/science/article/abs/pii/S0960148117309011.
Carbone 4, OFCE, and NEO (2021) The Role of Infrastructure in France’s Low-carbon Transition and Adaptation to Climate Change [Le rôle des infrastructures dans la transition bas-carbone et l’adaptation au changement climatique de la France], www.carbone4.com/publication-infrastructures-france.
Landa, G., Malliet P. Reynès, F. and Saussay, A. (2018) “The State of Applied Environmental Macroeconomics”, Revue de l’OFCE, 2018, Whither the Economy?, 3(157), 133–49, https://hal-sciencespo.archives-ouvertes.fr/hal-03443474.
Malliet, P, F. Reynès, G. Landa, M. Hamdi-Cherif, and A. Saussay (2020) “Assessing Short-Term and Long-Term Economic and Environmental Effects of the COVID-19 Crisis in France”, Environmental & Resource Economics, 2020-08-04 76(4), 867–83, https://link.springer.com/article/10.1007/s10640-020-00488-z.
Plane, M. and F. Saraceno, “From Fiscal Consolidation to the Plan de relance: Investment Trends in France”, in F. Cerniglia, F. Saraceno, and A. Watts (eds), The Great Reset: 2021 European Public Investment Outlook. Cambridge: Open Book Publishers, pp. 33–46, https://doi.org/10.11647/OBP.0280.02.
Réseau de Transport d’Électricité-RTE (2021) Energy Pathways to 2050: Key Results, https://assets.rte-france.com/prod/public/2022-01/Energy%20pathways%202050_Key%20results.pdf.
1 “La Stratégie Nationale Bas-Carbone (SNBC)”, https://www.ecologie.gouv.fr/strategie-nationale-bas-carbone-snbc.
2 “La Programmation Pluriannuelle de l’Energie (PPE)”, https://www.ecologie.gouv.fr/programmations-pluriannuelles-lenergie-ppe.
3 This analysis is not intended to predict the future, nor to document a decision in a comprehensive manner. It is intended to shed light on a range of possibilities and to provide input for decisionmakers on the path of transformation.
4 For a detailed description of the narratives of these scenarios, see Carbone 4, OFCE, NEO (2021), The Role of Infrastructure in France’s Low-carbon Transition and Adaptation to Climate Change [Le rôle des infrastructures dans la transition bas-carbone et l’adaptation au changement climatique de la France], www.carbone4.com/publication-infrastructures-france.
5 These amounts are based on the calculations of the authors whose methodology and data are detailed in Carbone 4, OFCE, NEO (2021).
6 For a detailed description of the ThreeME model, see https://www.threeme.org. We use here the French version of the ThreeME model, but other versions of the model have been developed and are used by other regions and countries such as Mexico, Indonesia, the Netherlands, Tunisia, and Occitania.