
9. Managing Projects
© 2023 Mathias Cöster et al., CC BY-NC-ND 4.0 https://doi.org/10.11647/OBP.0350.09
Management of digital transformation projects is basically about moving from Point A to Point B, delivering what is required within budget and schedule. The big questions are therefore: Is the road straight or curvy? Do we know the goal from the beginning, or do we learn from experience of a project, and continually negotiate the path we are taking? These questions can elicit different views on how projects should be run, but are still an important part of project management.
9.1. Goals and Definitions
In Chapter 2 we discussed the goals of organisations, and we use the same idea here in relation to projects. Goals are the objectives that an organisation wants to achieve, in either the short or long term, and how detailed they are depends on which level within the organisation sets them. A CEO sets broad goals that are then successively broken down into smaller, achievable goals via projects. There are different kinds of goals, such as personal goals, business goals and, most importantly in this discussion, project goals.
When talking about goals in a project context, it is important to emphasise that we are really talking about two types of goal: (1) Project objectives: the concrete goals of the project, such as building a house, delivering an IT system or designing a car, and (2) Impact goals: the expected benefit of the project, such as increased sales of a product, a new line of sporty cars or a stronger sense of competitiveness.
All goals are equally important, but project managers in organisations generally focus almost exclusively on project goals. Recently, however, organisations and project managers have increasingly begun to discuss the fact that project managers are also responsible for impact goals. We will examine this perspective later in this chapter. However, for our immediate purposes, goals can be categorised into two distinct categories. The traditional school views goals as something that can be clearly defined and described in a requirement document or the like, whereas the non-traditional school sees goals as difficult to define and describe, and argues that they should therefore arise from learning and a direct understanding of the problems that a particular project is trying to solve. These different views on project goals are central to how we work and which processes we use. This in turn leads us to two basic types of project model: sequential and iterative.
9.2. Project Models
There are many project models (some of which are used more than others), such as the waterfall model, PROPS, Scrum, and Kanban. As noted above, they can be divided into two main categories: sequential and iterative. Below, we will review the models according to categorisation, and describe the different steps involved in each. It is important to highlight that hybrids and other types of mixed models may well exist, but our focus here will be on the simple, delineated models.
9.2.1. Sequential Project Models
Sequential models have a long tradition and have evolved from a need for structure and control. The best-known sequential model is the waterfall model, introduced in the 1970s by Winston W. Royce. The model is based on a sequence of activities, each of which produces information required for the next step. The process is intended to be carried out sequentially, thus ensuring a well-functioning, tried and tested system by the end. The waterfall model is characterised by rigorous control via documents and other deliveries, which was more necessary during the 1970s and 1980s when IT activities were largely run by technicians and were frequently disorderly, or at least not customer-focused.
In order for the waterfall model and models such as the V model to function optimally, a project must have a well-defined goal that does not change, because it is difficult to go back to the model and change the basic requirements that were set at the beginning of the project. The process starts by defining what should be accomplished, and how this might be done, which leads to a requirements document, and in many respects a contract then forms the basis for design and development.
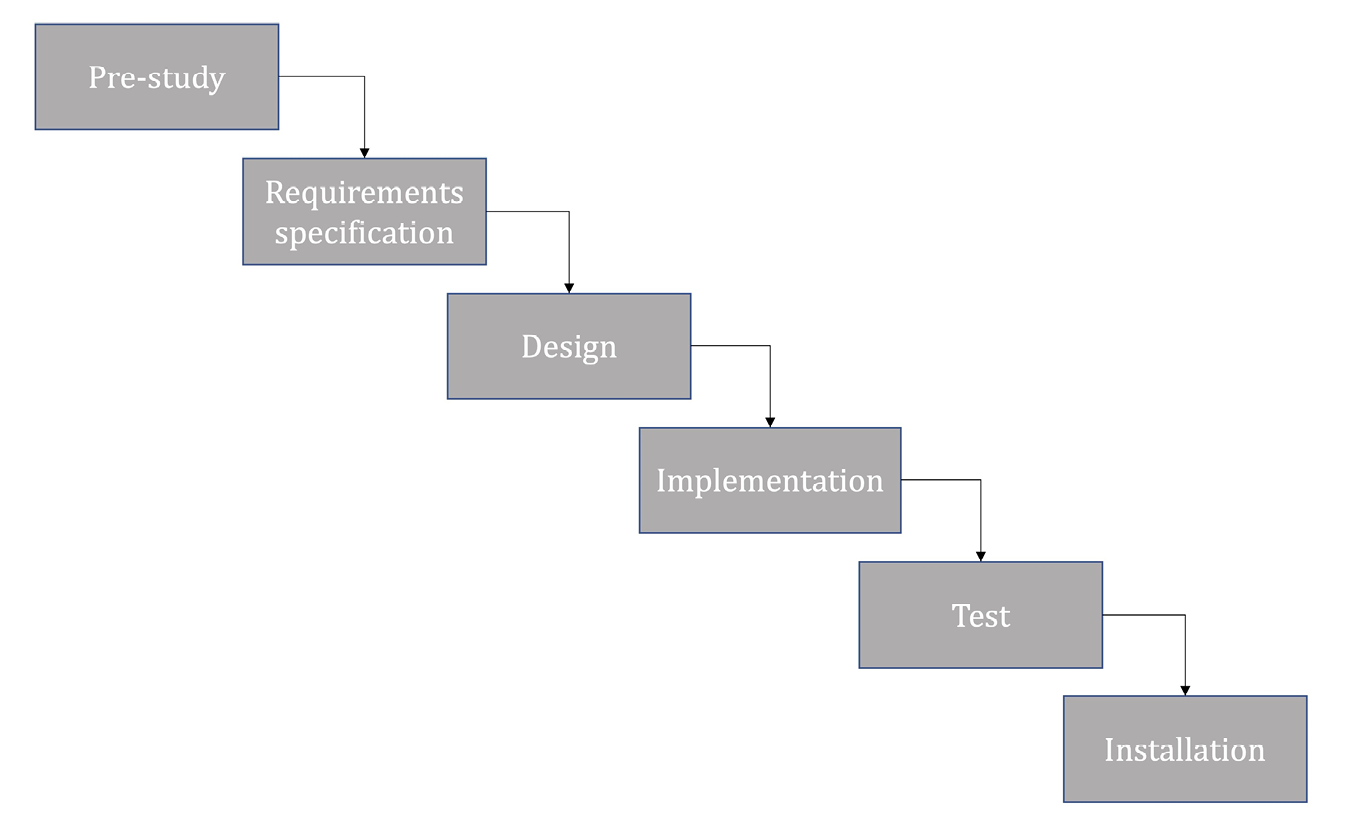
Figure 9.1. Example of the waterfall model.
The first step (which is not really part of the project) is a feasibility study. This investigates whether there are enough resources, knowledge, time, and so on to carry out the project in a reasonable manner, within the budget and time frame that the customer has requested. If the answer is yes, the project continues, and if the answer is no, then it ends.
Step 2: Requirements Specification
Managing requirements or understanding the required functionality of an IT system is difficult and time-consuming, but a crucial part of the waterfall method. The requirements specification is the document that outlines the functionality that will be implemented in the system. When working to procure a new IT system, the requirements specification functions as a contract between the client and the supplier. As the requirements specification is important, requirements management will be discussed in more detail in Section 9.3.2.
It is common for this step of the process to be based on a customer’s system description, for example, the main requirements (requirements that must be met) and set requirements (requirements that provide added value) that the system can deliver. The requirements specification process is about translating the customer’s requirements into clear systems requirements that can be implemented and delivered.
Once the functions that should be included in the system are identified, it is time to create it. A systems design contains all the elements needed to build the system, including everything from visual identity, graphic design, and database structures to flow charts that describe flows in code or class charts. It should be possible to build the final system on the basis of this design. In order for a design to be implemented, it must be easy to understand, so that the developer, graphic artist, or other worker understands exactly what is meant. Common means of expressing design in IT projects include techniques such as the Unified Modelling Language (UML). This tool consists of different types of graphical representations of, for example, flows in the system, information, and how a user interacts with the system. UML is described in countless books and on the Internet, and some reading recommendations are listed at the end of this chapter.
In this step, the system is built, according to the design document. Here, traditional system development processes take over and programmers, for example, create the system. Most of the work (in time) in the project takes place during this step.
A company’s IT systems must be integrated or interconnected. It is common to use an external system to manage logins, so that users do not need multiple passwords (single-sign-on). Data used by many sub-systems need to be shared, rather than duplicated, and so on. Integration is often one of the most difficult tasks in an IT project and it is usually the most competent technical staff who work on it.
When the system is fully integrated, testing starts. In this step, the functionality of the system is tested so as to iron out errors, both visible and hidden. Testing is a major aspect of IT and is often complex and difficult to implement properly.
After the system has been implemented and tested, it is time to hand it over to the customer or to deploy it in the organisation, and put it into production. This is often a relatively complicated process that requires extensive collaboration with the customer and knowledge of many areas within IT.
9.2.2. Problems with the Waterfall Model
The waterfall model is still the central and most widely used model in many industries. However, we see major changes in, for example, how to produce goods and the length of projects, that have gradually caused the waterfall model to lose ground. The waterfall model was created when IT projects were large, required structure, had low-to-medium complexity, and it was still possible to set firm goals. Today, the world looks rather different and these conditions are not necessarily a given. IT is complex and a project’s goal or functionality will typically be revised repeatedly during the project timeline. On the one hand, this is because it is difficult to define exact functions and there is a learning curve in any project; the customer simply becomes more skilled and more informed and, during the project, builds up their own and the organisation’s knowledge of IT and IT systems. On the other hand, external and internal conditions can change, meaning that further IT support is required to keep the organisation operating effectively. The customer and the project now require greater interaction and visibility, and waterfall models suffer because the product development is invisible to the customer. It is only late in the process that the customer has the opportunity to test the system, and at that point they can have minimal influence on the end result. This lack of prolonged customer impact contrasts with the customer’s need to be able to change and correct the target image and requirements during the project.
Another aspect of product visibility is that we are now also looking for more innovative ways to deliver IT systems or programs. This is especially evident with apps and games, which can be delivered to the customer in different forms. It is possible, for example, to buy a basic version of a game/app and then add features as you go. Agile methods allow innovative delivery, where a product can be accessed in increments. Unlike in the waterfall model, it is central and part of the working method to involve the customer during the project (as opposed to just at the start and the end), in order to deliver a flexible end product. The waterfall model also focuses on functionality, and the aim of the project is to ensure that all requested functions are available. This is a view that does not reflect current discussions about how in order to realise the benefits of a project, IT must deliver business value to motivate investments. Instead, flexibility and the gradual development of understanding of needs and possible solutions form the basis and primary focus of agile methods.
9.2.3. Iterative Methods: Focus on Utility
Iterative models (or agile models) are considered by many to be the next step in project management development, and in this sense represent ‘the new’. Basically, iterative models are exactly what they sound like; work is done in stages and the plan, work, assess cycle is repeated over and over again. Some would trace the origins of iterative models or agile methods, as they are normally called, to the creation of Lean (coined in 1988 by John Krafcik), a cool for car production that has gradually evolved into a tool for realising value in all manner of projects. However, this change actually began even earlier because prototypes and iterative development have been concepts in the IT industry since at least the 1980s. The starting point for agile methods includes the business value, the benefit of activities and efforts to cut out “unnecessary work” or, in other words, work that does not create value, and to try to reprioritise those activities that at present seem most fruitful.
Agile methods were born out of a need to handle change in projects more smoothly. Recurring priority discussions between the “customer”—the client or project owner in whose business the project result is to be used—and the executors, who build the solutions, are central. Agile thinking is a popular solution to the challenge of managing difficult-to-understand initiatives, where the customer gradually learns more about their needs and how an IT solution can help to satisfy them, and where the developer gradually learns more about the customer’s needs and operations, and about how technical solutions can be developed.
9.2.3.1. The Agile Manifesto
The agile manifesto was presented in 2001 and forms the basis of the agile method. It presents the philosophical ideas behind agile thinking, and how to look at work and projects. The manifesto presents four theses: individuals and interactions versus processes and tools; working software versus comprehensive documentation; customer collaboration versus contract negotiations; and responding to change versus following the plan. These theses, or approaches, form the basis of the agile movement and its methods.
Individuals and Interactions versus Processes and Tools
In agile methods, the focus is on the individual and their competence, and projects rely on a group being able to self-organise through communication between members to solve problems and undefined processes and tools. For this to work, a well-functioning team who trust each other and allow open communication, is necessary. The team members must also be competent in their respective areas and constantly strive to improve and develop themselves. It is important that they take responsibility for the group and for the work they have undertaken, and it is important that all members understand this and take it seriously. There has been some criticism of agile methods because self-organisation is regarded as difficult in practice. It requires all members to take on considerable responsibility and teams to be very tight-knit, which can be difficult as most companies have a resource pool that cannot change from project to project.
Functioning Software versus Comprehensive Documentation
It is important that the team builds, experiments, and works closely towards a solution, using prototypes instead of spending time on documenting. Evolutionary work with prototypes and modularised solutions is central to all agile models. Documentation is not productive, whereas designing and coding are. This does not mean, however, that there should be no documentation, but rather that one should document thoughtfully and effectively. Agile methods do not advocate long reports on functionality or changes.
Customer Collaboration versus Contract Negotiations
The customer is seen as a natural and important part of the project, and is expected to participate and make important decisions as it develops. Agile methods are based on a partnership rather than a strict customer-supplier relationship. This means that we should move away from the concept of “the customer”, because in a sense there is no customer separate from the project in the agile world, since everyone works together on the project, preferably with the same target goal.
Responding to Change versus Following the Plan
The ability to respond to a customer’s desire for change and the resulting learning curve are more important than following a predefined plan. Handling change smoothly is a basic principle in agile methods; we know that things will change and that the specifications may be proven wrong, and this should impact our approach. In the agile world, we start with what we know, which is documented and regarded as a living requirement specification. Everything that the project adds or changes along the way is a natural part of the work. This is described in more detail in the example of Scrum below.
9.2.3.2. Example of an Agile Method: Scrum
Scrum is the agile project method most widely used in the IT industry today. Methods always need to be adapted to the situation, and this applies no less to Scrum. Its name is a reference to rugby, and the cluster that starts the game. It is no coincidence that this word was chosen, as the success of Scrum, like that of many other agile models, depends on how well the project team works together, and requires them to work in tight-knit groups to inform each other and solve problems.
There are a number of concepts in Scrum that must be clear in order to understand and apply the method. For starters, there is a product backlog that contains all identified requirements. This does not mean that it contains all requirements; the backlog is usually an incomplete list that is continuously expanded or adjusted after discussions with the customer, and according to how the project is progressing. In addition to a product backlog, there is also a sprint backlog that contains all requirements or functions to be implemented in the next stage. The primary challenge for agile thinking is a situation where the goal is unclear and is continuously changing. To run the project, however, one requires the outside world to appear stable and unchanging. This is achieved in agile thinking through time-boxing, which involves setting a maximum time for a stage, to create a hypothetical scenario with a start date and an end date, and, above all, a clear goal that must not be changed. This time interval (which is usually called a sprint) is normally between two and four weeks long, depending on the project and what will accommodate the work, and once it is set, no goals can be changed, and no new work introduced for its duration.
The process represented by Scrum is led by a Scrum Master who is equivalent to a project manager. The concept of project manager does not exist in scrums; the teams are self-organising, and the Scrum Master is responsible for several administrative tasks, problem-solving, and managing external communication.
The overall workflow in Scrum is similar to that in many other project methods, including the waterfall model, in that it is about implementing functionality and creating a product. What should be implemented is documented in a backlog. This backlog is then changed as tasks are completed and shipped, or as new information renders older backlog entries irrelevant, inefficient or otherwise undesirable, i.e., if the old entries do not promise to deliver enough value in the updated backlog context.
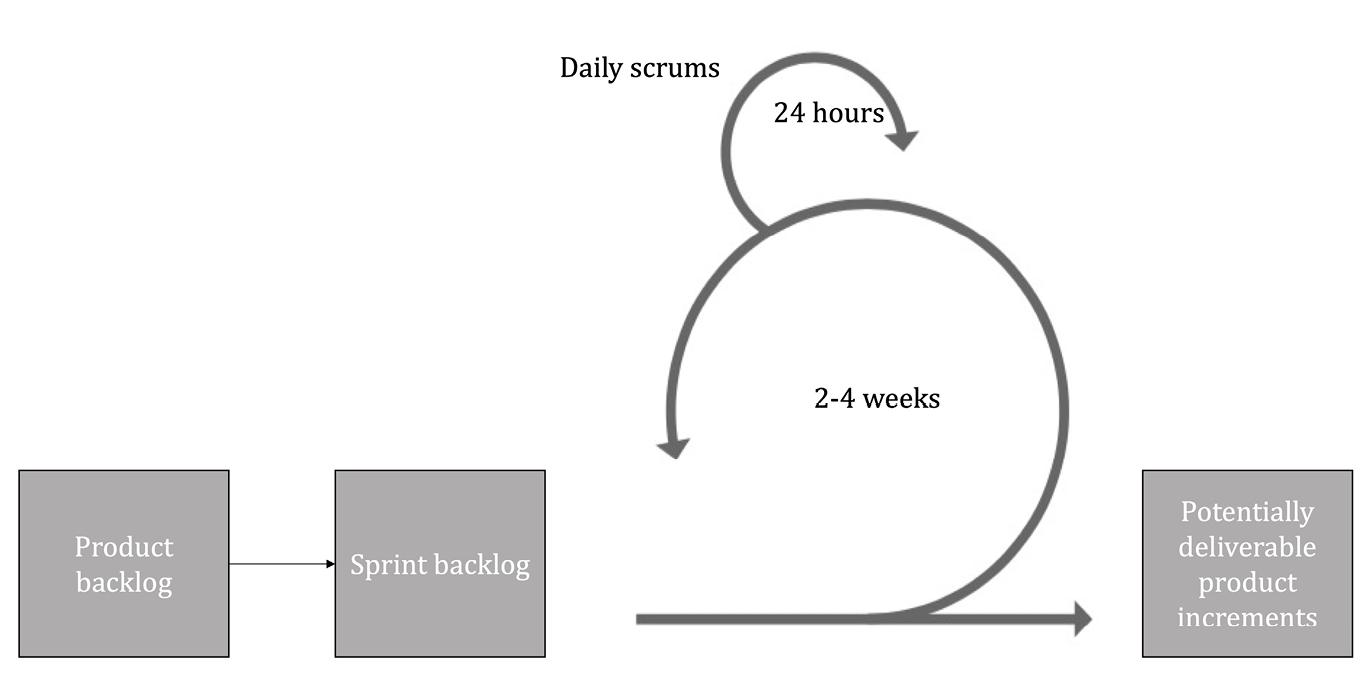
Figure 9.2. Scrum work process.
Step 1: Build the First Version of a Product Backlog
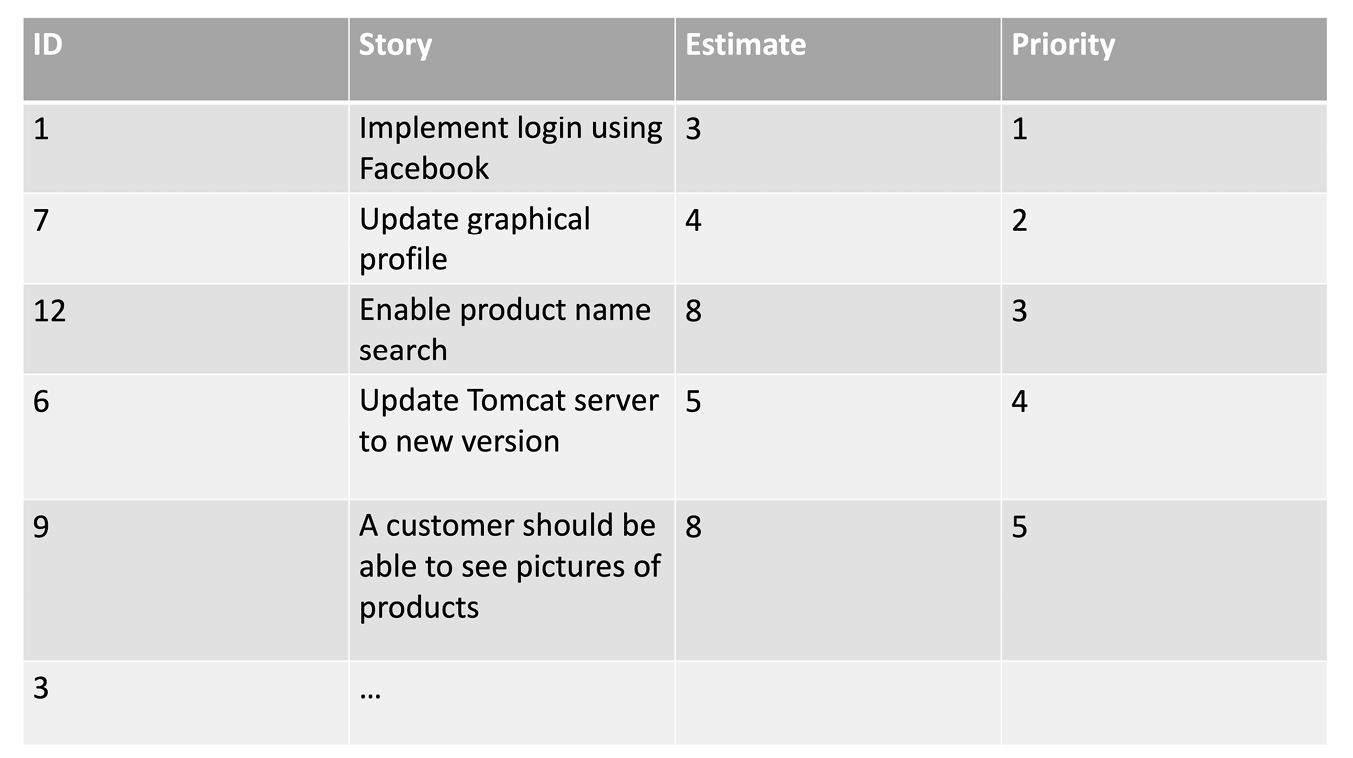
Since it is assumed that requirements cannot all be known from the beginning, this first step is about documenting requirements. This documentation can be achieved in different ways, such as through text, story or pictures. It is important that a product backlog is seen as a living list which, with the customer, is updated as changes arise, or new requirements are added. This can be done using the same approaches as for the waterfall method.
Table 9.1. Example of a backlog.
Step 2. Decide What to Implement in the Next Sprint
The next step is to define what needs to be done during the next sprint, or which requirements to implement. According to Scrum, it is the customer who at this stage prioritises and decides what is done, on the advice of those who are technologically savvy, so as not to create problems with the sequencing of activities, and so that the task list is based on realistic time estimates. Once several functions have been selected, they must be refined, detailed, and explained, so that, for example, a developer can start programming the function once the sprint begins. Work time is estimated, and this determines how many functions can be accommodated during the two to four weeks of the sprint. The result of this sprint planning is what is usually called a sprint log, and the associated necessary technical descriptions. The sprint log contains a subset of what is to be implemented in the backlog.
Step 3. Development/Sprint
Work is now done on the function or other tasks that have been chosen for the sprint. The method is not set in stone, and even the waterfall model is possible. The most common approach is to split the work as a group and to then work individually with the support of other members. Each morning a fifteen-minute Scrum meeting is held, where the group members organise themselves by dividing the work and coordinating in a way that suits them. Each member of the team should ask: What did I do yesterday? What do I intend to do today? What can stop me from accomplishing what I set out to do today (so that I may request assistance)?
Step 4. Possible Delivery-ready Product
After every sprint, it is important that there is a sub-product that could theoretically be delivered to the customer; all the results of a sprint must be deliverable. This means that it must have been tested and integrated with previous deliveries. If it is possible that a function will not be completed within the specified sprint time, then the data will be returned to the reverse log and may be included in a later sprint.
Step 5. Show to the Customer
The penultimate step is to show the work to the customer. This allows for discussion of what has been done, and gives the customer the opportunity to test the prototype, provide feedback, suggest changes, and so on. Any additional changes made during this preview are added to the product backlog, to be sprinted at a later date.
Step 6. Sprint Overview
The final step is to evaluate the sprint: How did it work? What was good? What was bad? Is there anything about the working method that should be changed before the next sprint? This is an important step as it enables work changes, such as how time is spent. It is an essential part of Scrum to question and improve the model, to learn from previous sprints, and to improve the work process.
9.2.4. Problems with Agile Methods
We have previously discussed problems with the waterfall method, and agile methods equally have problems that should be noted. The first challenge is how well they really suit the way the market does business. In internal projects, this is not a problem, as the entire chain from financier to implementation can be controlled, but it is more problematic in a customer-supplier situation. Much of the business that is done within IT is about fixed price agreements, where a supplier takes on an assignment for delivery at a fixed price that is negotiated before the project starts. This way of working is the opposite of agile methods, where those involved have to be able to work more like partners with a current account. In reality, they do not know what the final price of the project will be, which makes the business relationship complex.
The second challenge is that agile methods require a team with the ability to self-organise without the involvement of an official project manager. This usually does not work completely smoothly. If the team is not experienced, coordination is required and the team will need support to self-organise. In larger projects, coordination between teams also becomes a challenge. The scrum masters must therefore meet in scrums (of scrums) in order to handle cross-team coordination. With six or seven people in a team, a third level of coordination will be needed. The larger the project, the more complicated cross-team coordination becomes.
The fact that the customer controls much of the work is the third challenge for the agile method. An ability to prioritise and drive the work forward requires relatively good knowledge of IT and systems development, which a customer normally does not have. In this case, one must guide the customer and converse with them in order to decide on sensible priorities. Also, sometimes customers may not be prepared to be as involved in the project as the method requires. In that case, someone on the developer side will have to act as the customer, thus introducing the risk that customer needs and priorities are not really understood or incorporated into the project.
9.2.4.1. Real-life Examples
In Chapter 2, we met an IT manager in a business area at a Swedish bank. To drive the development of systems there, IT managers work in projects. As mentioned in Chapter 3, they can run up to seventy parallel projects at a time. Here is what some of them say about working on projects:
The projects I have been involved in have used the more traditional way of working, which is usually called cold waterfalls. I do not really like to call it a waterfall, because we have worked on iterations over time even though the project form itself has been a waterfall. You start with a needs analysis, then you go into a feasibility study. The needs analysis should show “what is the benefit, what is the value we get from this?”, but you don’t know what the price tag is. To find out, you need to do a feasibility study and in this, you go deeper into what solutions there are that you can develop to achieve the desired effect. With some luck, when the preliminary study is over, you will get an indication of what this will cost. Then you decide if you want to do it and then you go into a project.
The quotation above illustrates a common problem with agile methods. The cost of the project cannot be calculated with great certainty, and the project relies on a continual calculation of costs, which requires trust and cooperation, which do not always work. This means that many organisations work with hybrid models that combine sequential and iterative models to control the costs while utilising the positive aspects of agile methods.
In the agile world that we are going into more and more, we ignore the formalities and the big plans, because they will still prove wrong. The feasibility study will be faulty, and you will not know what it costs. According to this approach, it is better to have agile cross-functional teams that are always in place and who can constantly follow up on what needs to be developed, because you can never know what you want. You know what outcome is needed, but how to achieve it? It is better to let the team take responsibility for that. The team makes small deliveries and makes sure the deliveries are executable early, so that we get something of value from the beginning, and then in theory we build on it. This is great, but it is not easy. You do not always know if it is best to run an agile approach or a more traditional one: “Now we collect all the resources we need and then we send out the people in the project.” In the agile journey, it is the teams that build this to a greater extent; we start from the team. In some industries and areas, this works well and in others less well.
The quotation above certainly reflects reality. Seemingly good ideas can be difficult to realise. Agile methods are based on a sometimes too-perfect world, with a perfect team that can handle everything and has all the knowledge needed to organise everything itself, in close collaboration with the customer. Unfortunately, the reality is that project managers are not allowed to choose project members freely, and it is thus rare that self-organised teams work exactly as intended in a project. It is therefore important to work with different tools and at different levels. It is not wrong to make plans, even if they fail, because this makes us think about the future and teaches us about the situation, which in turn helps us to drive the project closer to success, regardless of method. And there can be situations where an agile approach is suitable.
If you have an assignment to make continuous changes and improvements over a certain limited area in a company, such as a website, over a long period of time, then I strongly believe that there should be one or more teams working in the same area, where you should work agilely. There is a backlog (list of outstanding activities) of what it is you have to take and do. Over time, the teams will find out what is important. If you have flow in the work and a constant iterative dialogue with a product owner or area manager sitting in the middle of the team, then the agile method is perfect.
The connection between the IT department and the rest of the organisation has long been, and will continue to be, a key issue.
The quotations above show how important it is to think through the agile in an organisation: how should these thoughts be applied so that they deliver maximum business value and can at the same time be controlled? Using hybrid models is common and a division between overall architecture and how things are implemented is not only sensible but arguably necessary in today’s complex, increasingly digitised world.
9.2.5. Which Method to Use and When
Which method to use and when will largely depend on the type of project and what kind of relationship the customer wants. Agile methods require the customer to actively participate in the project, and if the customer does not wish to do so, then it is safer to choose a more sequential model. In general, however, it can be said that the more uncertainty there is in a project, the more suitable an agile method will be. Conversely, the greater the stability, goal clarity, task familiarity, and size of a project, the more appropriate the waterfall method.
As noted, there are problems with both models, and nothing says that the waterfall model cannot be effective and deliver good results. Below are some examples of project types that fit each method.
9.2.5.1. Waterfall Model
- Fixed-price projects with a clear target.
- Short projects in which the limited time does not allow for changes.
- Projects whose goals are well-defined and relatively simple.
- Large projects whose tasks and solutions are familiar and possible to plan.
9.2.5.2. Agile Method
- Development of, for example, an app that you want to be able to deliver step by step.
- Unclear projects where the goal is not well-defined or clearly feasible.
- Complex projects in which changes are likely to occur.
This is a list of examples, as opposed to hard recommendations. In a given project, it is almost always possible to devise a way of using either method, or a combination of the two.
9.3. Common Skills, Tools, and Methods
Regardless of the method(s) used, there are a number of basic skills that a project manager should possess. Of course, needs vary between organisations and the tools and methods below should be seen as examples and suggestions of how to meet them.
9.3.1. Conducting a Feasibility Study
A feasibility study normally consists of five parts, each of which analyses a specific area of the project. It is important to point out here that these analyses cannot be made separately, because they will influence each other, so the feasibility study should be conducted as a whole. The five parts are: assessment of technology, economic aspects, legal aspects, operational considerations, and time schedule.
9.3.1.1. Technology
This part of the feasibility study is normally carried out by technically knowledgeable people who use an overall design to evaluate whether it is technically feasible to carry out the project. They also consider the technical solutions available and focus on ensuring that appropriate technology is used. It is important to ensure that there are technologies to solve the problem, and that it is possible to spend time changing an existing technology or developing new ones. Normally, there is no time to conduct research in a software or IT project.
9.3.1.2. Economy
Here we evaluate whether the proposed budget is adequate to implement the project. Another aspect evaluated is the question of whether or not the project will pay off, and usually a cost-benefit or business case analysis is carried out to ensure that the project will generate a profit, or other forms of benefits that might justify its resource consumption.
9.3.1.3. Legal Aspects
As more and more projects use open data or store information that may be considered sensitive, it is important to consider whether legal restrictions affect what data can be used, how it can be stored and handled, and how this affects the final product. Such analysis is normally conducted by lawyers with knowledge of IT-related issues.
9.3.1.4. Operational Considerations
This part focuses on the operationalisation of the proposed system or process. The focus is on how the intended change is to be introduced into the organisation. The underlying issue addressed is how to ensure that the IT system is accepted and utilised in the organisation and interacts well with organisational processes and practices. If we do not plan for implementation, the likelihood of resistance from future users is high, so there should be an analysis of what can be done to make the introduction as simple and painless as possible. This is about ensuring that you help the customer or recipient of the project to realise its benefits. One complicating factor is that project managers usually carry out one systems development project before moving on to the next one, and therefore in reality have very little opportunity to work to ensure that the desired benefits of a project are actually realised.
9.3.1.5. Timetable
Can the project be completed within the given time frame? This part is exclusively about ensuring that the time allocated to the project is sufficient to carry it out and that its individual stages are sensibly arranged.
9.3.2. Working with and Managing Requirements
Requirement management, or the process of understanding and defining a requirement, is relatively complex and consists of specification, analysis, and documentation. It often forms part of the pre-study work, but may well be a separate process that is carried out after a pre-study. There are many methods and processes for requirements management. Basically, requirements management consists of three aspects that are based on each other and when combined create a well-defined requirement. These are:
- Requirement definition. This is a requirement that is expressed in natural language, such as Swedish (rather than formal, artificial modelling language). This is primarily aimed at the customer as a way of creating an understanding of the project.
- Requirement specification. This is a structured description with all project requirements, which forms the basis for a contract between the customer and the supplier.
- Software specification. This is a technically detailed description of the requirements for the developers who will implement them. This can be created with the help of tools like UML (Unified Modeling Language).
If we put these together, we get the final requirements specification, which forms the basis for the continuation of the project. It should also include the relationships between the requirements and the external environment. There are many methods for obtaining requirements from the customer or the users, ranging from interviews to the analysis of systems specifications that customers have developed. More concrete examples of methods that can be used to obtain requirements are brainstorming, conceptual or process modelling, and working with prototypes. These different methods have their own strengths and weaknesses, and depending on the situation and type of system the customer is planning to build, different ones will be appropriate. Brainstorming is a convenient way to get started, or to find new ways to look at a problem. Modelling is most often used to analyse processes, and to determine how to improve them, or to chart what information the project should help in handling, and which conceptual data structures are needed to capture that information. Prototypes involve visualising something that can be complex, to test the usefulness of a certain functionality or to provide experience of potential user interfaces.
There are thus many methods with which to create a clear overview of requirements. It is important that the project manager understands the difference between each and chooses carefully, as it can be costly to choose the wrong one. The point is to find a mix of requirement management methods that works, and to deliver a result at the lowest possible cost. It is also important to understand that requirement management is a generic kind of knowledge used in both agile and sequential methods. The difference depends on when it is done and how many of the requirements are handled; agile methods focus on what is to be implemented in the immediate next step, while sequential methods identify all requirements of all steps before the project can start.
9.3.3. Time Estimates
It is difficult to make predictions, especially about the future.
Karl Kristian Steincke, Danish politician
Estimating time frames is undoubtedly one of the most difficult activities in a project, but it is of utmost importance that these are as correct as possible when planning a project as, for example, cost (and often price) directly corresponds to hours spent on a given activity. There are a number of methods for estimating time, but in essence, it is about using past experience and/or statistics to estimate how long an activity takes. Estimates can, however, be more or less elaborate. What has never been done or experienced cannot be estimated, and then it is better to accept the help of experts who may have additional insights.
Before considering methods for estimating time, it is important to note that the planning horizon has a major impact on the quality of any estimate. The more distant the future of an activity, the greater the margin of error, and vice versa. This will have a greater impact on sequential methods, which require us to estimate the entire project and all of its stages before it has started, unlike iterative projects, where only the activities closest to us in time are considered.
Take a moment to imagine that you are expected to estimate how long it will take to do something that will happen in eight months’ time. Now do the same for something you will do tomorrow or next week. Which is easiest? It is nonetheless important to understand that we must actively work on estimations throughout a project, and adjust them according to what we learn from tasks we have already completed. For example, if our estimates are constantly 10% too high, then we can probably correct our estimates for all upcoming tasks by reducing them by 10%.
Below we will discuss some methods for estimating time frames: work breakdown, historical data, and experts.
Work breakdown structure (WBS) is a common tool used in a variety of applications, and, in addition to time estimation, helps us to understand the activities that are part of a project and its scope. There are numerous variants of WBS, such as product breakdown structure (PBS), which is often used in agile projects, because it focuses on products and regards functions in IT systems as products, in line with the agile view of business value.
WBS is about breaking down a project into smaller parts known as work packages that one can estimate with relatively great certainty. This process creates a tree that describes the project’s steps or tasks. The process is then completed by adding together the times for completion of the various levels in order to work out how long it will take to complete the project. We use the ICA example from Chapter 8 to illustrate what a WBS looks like (Figure 9.3). This is not a complete example, but illustrates the hierarchies that are used, and the gradual division of the work into smaller parts. There are main groups, such as design, which in turn consist of a number of sub-activities. The breakdown should continue until clear work packages are defined.
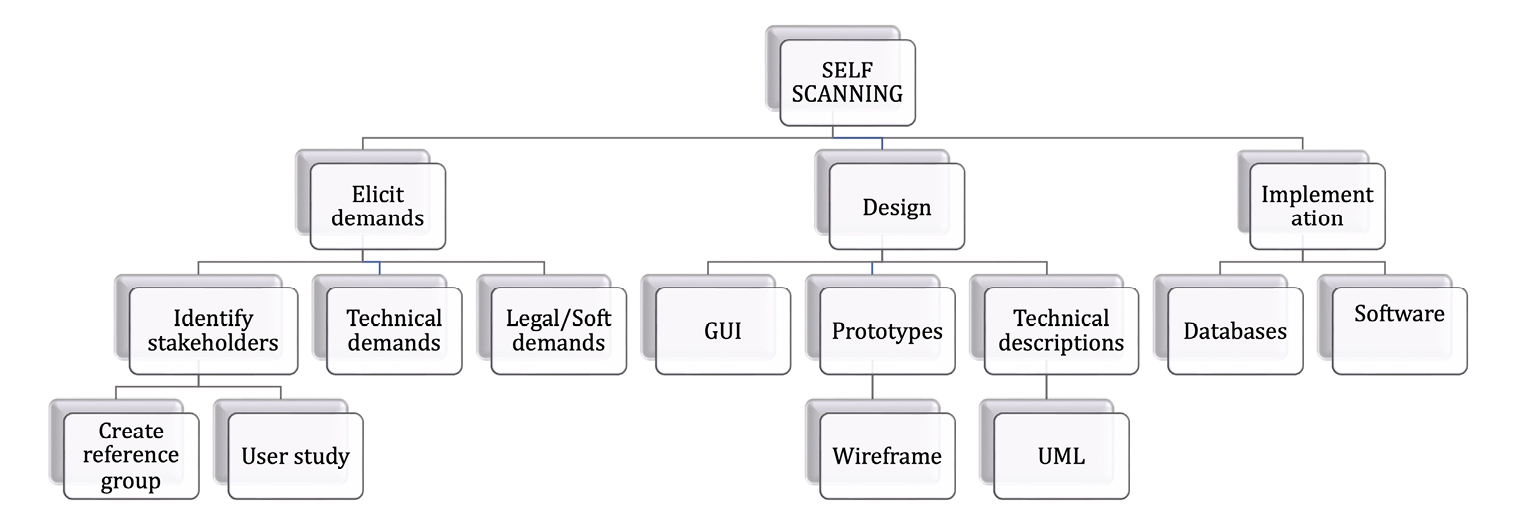
Figure 9.3. Example of high-level WBS.
9.3.3.1. Historical Data
Using historical data for estimation is a reliable method, when possible, since it offers facts: the end result, or how long a past project actually took. The most common way to work with historical data is to look at similar projects that the organisation or others have undertaken, see how long they took and use this as an estimate or as the basis of an estimate. For this to work, it is important that the organisation works actively to finish projects to a good standard, that employees learn from what they have done in the past and, above all, document the projects in a way that allows them to reuse the information. It is important to point out, however, that the tasks must actually be the same, that the project context is similar, and so on, otherwise there is a risk that the estimates will be incorrect because the projects are too different.
9.3.3.2. Experts
Seeking help from people inside and outside the organisation is a common and well-tried approach to estimation. All organisations have experts in different areas, and the underlying assumption is that if someone is good at something, like programming, they are more likely to be able to estimate how long an activity within their field of competence will take. The Delphi method asks a number of experts to individually estimate how long activities will take. The results are collected and a group discussion with the experts then follows, giving an opportunity to review, compare, and discuss the individual estimates before reaching a final estimate. This approach can provide well-founded estimates, but takes a long time and is costly, so care is needed in applying it.
9.3.4. Risk Analyses
There are many opinions and theories about risk analysis. The topic was discussed in Chapter 8. Here, we will focus on balanced and realistic risk analyses, which can be used in an organisation when working on certain projects.
The purpose of risk management is often to minimise losses in a rational manner. Ideally, it would be nice to minimise all imaginable risks, but it is usually too expensive to obtain protection against everything. An important part of a rational approach to this is risk analysis. When conducting a risk analysis, we examine the consequences of the different strategies and how they should be valued. We must then also try to anticipate what can happen and estimate the probabilities of the relevant events (which are often termed ‘incidents’ in IT-related risk analysis). As in decision-making in general, it is often difficult to obtain the necessary information for the analysis (or here, to make sure that all relevant risks and countermeasures have been considered, and to be sure to prioritise them adequately relative to the importance of the actual problem). In this work, we use the decision-analytical components and methods that we discussed earlier in this book.
A risk analysis is usually part of a decision-making process and is intended to systematically identify the risks involved. It usually contains assessments of risks and vulnerabilities which analyse all threats, at least to some extent. The potential benefits of risk analysis are significant; for example, they include adequate cost recovery, increased productivity, a better focus on safety, and increased general awareness. A major function of risk analysis is to create efficient processes for handling incidents before they occur, when they occur, and when they have occurred. A lack of such measures can be very costly.
There are different methods and tools for risk analysis, including everything from simple checklists that only require a few hours of effort, to analyses that may require several people’s work over multiple months. Qualitative risk methods are sometimes useful when reliable data for quantitative methods are not available, and can be used as screening methods for preliminary assessments. One problem, however, is that they are very rough, and it is difficult to really distinguish between the various mid-level risks. Quantitative methods seem more accurate and are sometimes included as branches of the decision trees used for overall risk and mitigation analyses, making it possible to obtain a complete picture of the situation.
Quantitative methods are usually divided into deterministic and probability-based analyses. A deterministic analysis is based on the seriousness of an incident’s consequences. In probability-based analyses, we also consider the frequency of the events. We will continue to use values (or sometimes utilities) to quantify the perceived effect of the outcome. (Some risk analysis literature uses a different and more confusing terminology that mixes the concepts of consequence and value.)
To deal with a risk, we must essentially answer three questions:
- How high is the probability that an incident will occur?
- If an incident occurs, how big is its impact on what interests us; that is, what is the value of the consequences?
- How should countermeasures be managed so that the risk is reduced, and any adverse effects become acceptable?
Answering these questions will allow a better understanding of the risks and create a situation in which they can be prioritised and addressed.
In practice, it is almost impossible to obtain precise information on risks. People have tried to come up with solutions to the problem, and many models—in some cases, remarkably strange ones—have been proposed. The more developed methods use event trees, which attribute probabilities and costs to tree nodes in the same way as decision trees, and then a more or less reasonable aggregation of the values used is performed. A common method of aggregation is the use of any variation in the expected cost of an incident, where the probabilities of the consecutive events are multiplied by the cost of the consequences of the event, as we have seen before.
As we might expect, decision trees, and decision-making methods generally, are very useful here, especially in more complex situations, and can be used constructively to model the relationships between possible risks and countermeasures. When we have an idea of the probabilities and effects, we can go further and evaluate the risks to understand which ones must be handled instantly, which should be managed over time, and which can be ignored. Normally it is not feasible to mitigate everything according to time and cost constraints.
9.3.4.1. Evaluation
First, we show that the simplest evaluation methods work because they are relatively common. The simplest methods assume that we have attempted to quantify probabilities and values on a scale of, for example, 1–5 or 1–10, while others handle more qualitative measures such as small–medium–large. Such scale models allow analysts to express the different values in a relatively coarse format.
We want to emphasise that it is not, as we have seen in the section on procurement, a particularly good idea to use this type of scale. Methods of this type can, however, sometimes be useful for gaining an overview of a situation. But they rarely suffice for more qualified analyses. Now, suppose we have a list of risks:
Table 9.2. Example of a risk matrix.
|
# |
Risk |
Probability |
Effect on project |
|
1 |
Illness of consultants and employees participating in the project |
Mid |
Mid |
|
2 |
Customer changing and expanding functionality |
High |
Mid |
|
3 |
Incorrect technology choices or innovations that make the selected technology outdated |
Low |
High |
|
4 |
Resistance from the organisation complicates the introduction of the IT solution |
Mid |
High |
The next step in the process is to create a picture of the risks and to determine which should or should not be managed. The risks must therefore be ranked. We show here a simple matrix model, a heat map, for handling qualitative scales (low–medium–high), which provides an easy way to visualise the risks graphically.
Table 9.3. Graphic visualisation of risks with analysis.
|
Effect |
||||
|
Low |
Mid |
High |
||
|
Probability |
Low |
3 |
||
|
Mid |
1 |
4 |
||
|
High |
2 |
|||
The risk analyst can now use the matrix to sort the various risks based on how they perceive their probabilities and effects, where, not surprisingly, an event with a high probability and high effect is more serious than an event with a low probability and negligible effect. After entering the risks into the matrix above, in Table 9.3, we get at best a coarse ranking of the risks. Green can mean that the risks are negligible, yellow that they should be remedied, orange that they should definitely be remedied, and red that they must be remedied. What remains is to decide on which risks to address. It is usually reasonable to focus primarily on the risks in the Orange and red fields, and secondly on those in the yellow fields.
This can work as a first analysis, even though it is greatly oversimplified. The problem, however, is that most risks are classed as medium without any indication of how they should be ranked. A less experienced risk analyst is already able to distinguish between catastrophic, unacceptable, and acceptable risks without the help of analysis tools, so the problem that remains is determining the order of the risks so that they can be systematically managed. When the risk hierarchy is obvious, there is no need for a model, and for the interesting risks, models such as the heat map are little or no help.
Another fairly popular method is to use a scale such as the one below, where the expected loss (value) of an event can be calculated based on the value (v) of various losses and the probability of occurrence (f).
$ 10: v = 1
$ 100: v = 2
$ 1000: v = 3
$ 10,000: v = 4
$ 100,000: v = 5
$ 1,000,000: v = 6
$ 10,000,000: v = 7
$ 100,000,000: v = 8
Once in 300 years: f = 1
Once in 30 years: f = 2
Once in 3 years: f = 3
Once in 100 days: f = 4
Once in 10 days: f = 5
Once a day: f = 6
10 times a day: f = 7
100 times a day: f = 8
The expected losses can then be estimated using a formula, for example, based on a weighted average where these f-numbers are weighted together with the values.
One problem with this method is that the possible values are spaced too far apart. This issue can be partially solved by using decimal numbers for v and f, but then we should instead use the much more versatile tree models, as described below.
Trees can provide a much better overview. As we have seen earlier, a decision tree consists of three types of nodes: events, outcomes, and choices. Tree models are also extremely useful for managing risks.
Suppose we are assessing the effects of a project delay that has given worrying signals. We have a value scale between 0 and 1, where 0 indicates that the situation is catastrophic and 1 that everything is unfolding as it should.
Table 9.4. A risk matrix with values and probabilities.
|
Delay |
> 6 months (p1 = 5 %) |
3–6 months (p2 = 10 %) |
1–3 months (p3 = 25 %) |
No delay (p4 = 60 %) |
|
Effect |
Complete losses (v1 = 0) |
Large losses (v2 = 0.1) |
Negligible losses (v3 = 0.3) |
No losses (v4 = 1) |
In the same way as for decisions, expected values are commonly used for risk analyses. The information is thus also synthesised here into an expression that weighs the values against the probabilities. We usually speak of expected loss, giving rise to a risk measure such as E(H) = p1 · v1 + ... + pn · vn, where H is the incident.
If we insert our numbers into the expression above, we get the expected loss as a result of the incidents:
E(Delay) = 0.05 · 0 + 0.1 · 0.1 + 0.25 · 0.3 + 0.6 · 1 = 0.685
The expected value has the great advantage of being clear and easily calculable, as long as the probabilities and values are known.
If tree models are being used, then it is also possible to directly model the subsequent consequences of the parent consequences to obtain a more detailed analysis. For example, we can model the consequences of a serious delay, such as customers disappearing, liquidity problems, redundancies, and so on. All of this works completely analogously to the decision tree models.
As we will see below, another advantage is that risk trees can easily be linked with decision trees, thus providing an overall impression of both risks and countermeasures and how we should best manage and prioritise them.
Again, with the exception of simple situations, there is little realistic hope of getting a useful guide from numerically accurate methods. As discussed earlier, this can be solved by using decision trees with imprecise input data, where a probability lies within a confidence interval, instead of being ascribed an exact number. We can also use comparisons if we lack quantitative data. In this way, we get considerably better data when we carry out risk analyses.
9.3.4.2. Mitigating Risk
To mitigate a risk is to prepare for unfortunate outcomes or to ensure that they do not occur, or at least that their probability of occurring is very small. There are basically four ways to counteract risks: avoid, share, reduce, and transfer.
- Avoiding risks is usually about evaluating and selecting other solutions or making other choices to find less risky alternatives. One common way of doing this is to choose proven working methods and technical solutions instead of untested ones.
- Sharing a risk means, for example, choosing to work with another organisation meaning that each organisation is only exposed to a portion of the risk.
- Reducing a risk means acting so that the risk becomes smaller, for example, by hiring an external expert to go through the project or by placing staff members with the greatest experience in time-critical activities on a project.
- Finally, the risk can be transferred to someone else. An obvious example is if one insures against a risk through an insurance company.
We can look more closely at the simple example of project delay above. Suppose that the anticipated delay depends on a lack of internal competence, which can result in a delayed delivery to the customer. The analysis can now be expanded and clarified through trees, which makes it possible to specify sequential events. We therefore continue to assume that the delay can have different effects in terms of market share.
After a more detailed analysis, we find that if the project is delayed for more than six months, the supplier has more than a 50% probability of losing the entire market as a result. This is a catastrophic scenario, which we estimate as having a value of 0. However, even less catastrophic scenarios involve substantial losses (value: 0.2–0.3).
If the delay is instead between three and six months, the supplier has a probability of over 75% of losing a very important customer (value: 0.2–0.3), but with a little luck (less than 25% probability), everything will go well (value: 1.0).
If the project is delayed by between one and three months, the supplier has a less than 30% probability of losing the customer (value: 0.2–0.3). Of course, if there is no delay, nothing will happen (value: 1.0). The event tree in Figure 9.4 shows the aggregate risks.
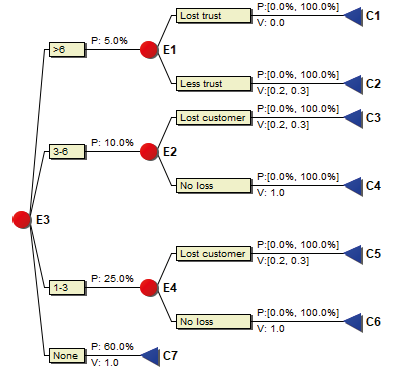
Figure 9.4. Project risks in a tree format.
The company can now decide, in order to mitigate the risk of delay, to recruit a smaller or larger group of technicians, for example. The effect of recruiting a larger group means that there is more than a 90% probability that there will be enough qualified personnel to implement the project on time, and a maximum 10% probability that the delay will be between one and three months. The risk of even later delivery is non-existent. At the same time, the costs increase so substantially that the company risks a 20–30% probability of bankruptcy. The supplier perceives this outcome as negatively as losing the entire market. In any event, the costs will be so significant that the value of a successful project will be significantly lower. The value of delivery in both cases thus decreases (by 0.2), as the costs of saving the project in this way are so large.
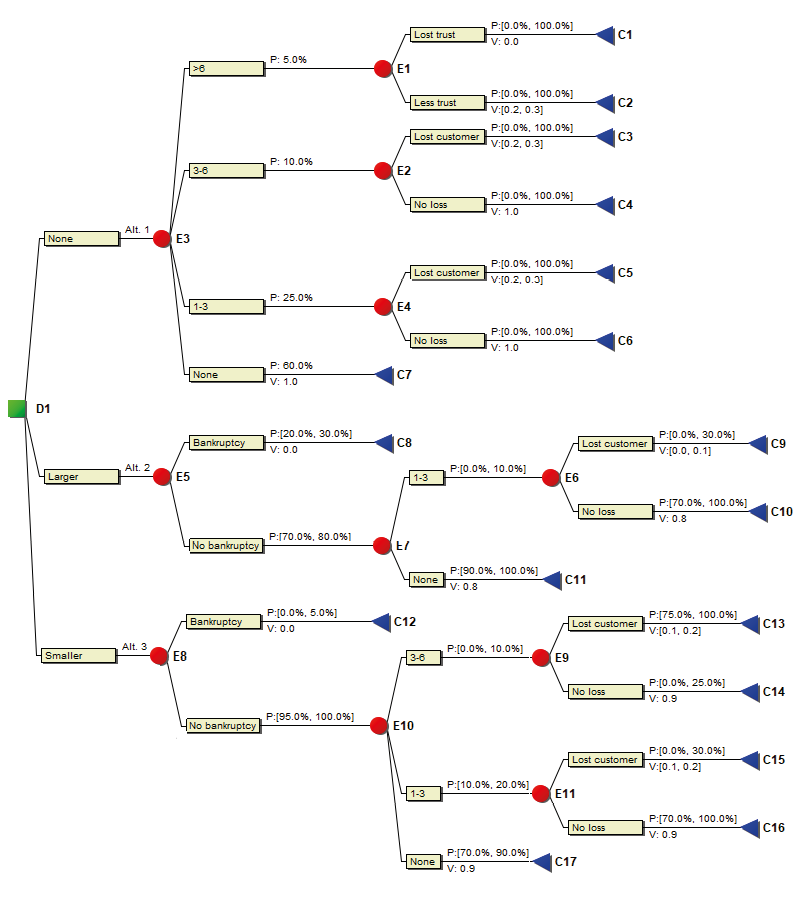
Figure 9.5. A decision tree for the above example.
Recruiting a smaller group is cheaper and means that the bankruptcy risk is below 5%, but the probability that the project can be implemented in time then drops to 70–80%. The risk of a one-to-three-month delay is 10–20% and that for a three-to-six-month delay is less than 10%. The value of a successful project also decreases here, however (by 0.1), thanks to associated costs.
The risks, as expected, have different effects depending on what is done. We therefore have a classic decision problem that naturally combines the risk analysis with the decision regarding the company’s course of action. Figure 9.5 shows this reasoning in its entirety.
After modelling the problem, the evaluation can be made, and the results can be seen in Figure 9.6.
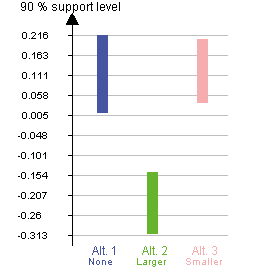
Figure 9.6. Result of the decision and risk analyses.
In Figure 9.6 we see how the alternatives perform in relation to each other, given the background information. The further up the bars they are, the better the options they represent. It can now be seen that the alternatives of either not recruiting at all, or recruiting a smaller group, are clearly much better than recruiting a larger one, based on the information available. The two better alternatives are rather similar, with no risk mitigation (Alternative 1) and a somewhat larger range of potential outcomes. Recruiting a smaller group (Alternative 3) appears to be slightly better, with a smaller range and a somewhat higher mean expected value.
9.3.4.3. Create and Establish a Follow-up Process
The last task in the risk analysis process is to establish a system for continuous monitoring during the project. We will discuss this in more detail in the next section. Monitoring the project is part of the project manager’s responsibility. The work process runs throughout the project and helps the project manager to correct plans and current approaches. In its most basic form, the work process looks like this:
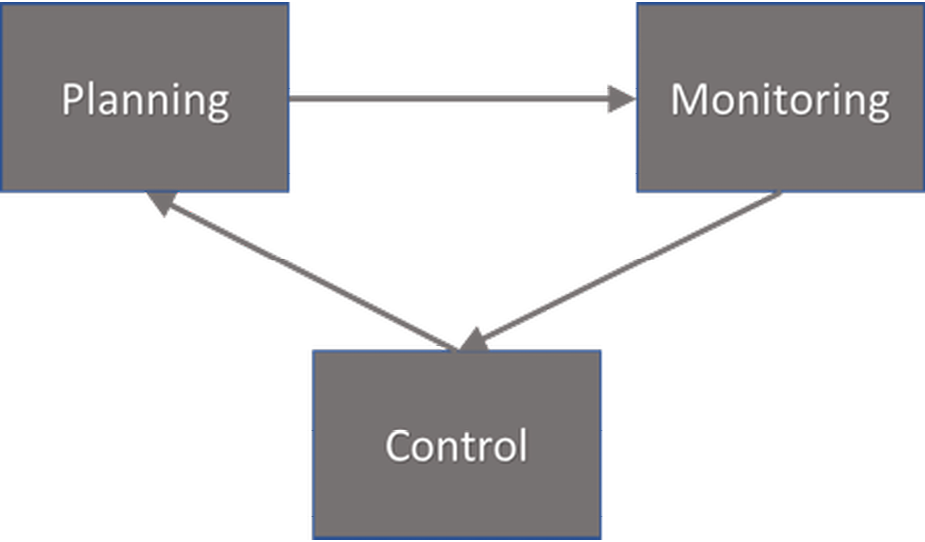
Figure 9.7. Planning, monitoring and control process.
Figure 9.7 shows a traditional work process for monitoring and controlling projects. It is a loop with a plan for what is to be done, monitored via, for example, KPIs and correct plans and behaviours. The most interesting areas to monitor/follow up on depend on the context and the type of project. In general, however, four areas of interest can be noted: (1) risks, (2) budget, (3) resources, and (4) goal fulfilment. Information is required to be able to monitor them and make decisions about which changes should be implemented. How information is collected is not important in itself. The important thing is to understand the composition, which will be a mix of quantitative and qualitative data and more free-format sources, such as reports, from project members and the project manager. The monitoring process is about setting up an information flow, getting members to report on how their work is progressing, the rate at which money is spent in relation to goal fulfilment, and so on. The major challenge in monitoring a project is to find a balance between information needs and the opportunity and willingness of members and other participants in the project to deliver. It is all too easy to create a process requiring a large amount of data, with members spending hours reporting the status of various activities, which is not cost-effective, and will eventually become tiring. The basic rule is to automate as much information collection as possible. For example, financial data can be retrieved from the financial system; a consultant’s billable hours can probably be found in the time-reporting system used by almost all consulting companies; and so on. It is important that the project manager explains, and points out to participants right from the start, the importance of reporting what they do, the status of activities, and so on, so that this becomes a natural part of the workday.
Exactly how the follow-up and control process in a particular organisation looks is not our main topic, and instead we focus on which questions require answers in the different areas of risk, budget, resources and goal fulfilment.
Risks
- Have probabilities and effects changed compared to the plan?
- Have new risks arisen and old ones disappeared?
- Are risks handled correctly?
- Have new risks arisen that need to be dealt with?
Budget
- How much money has been spent compared with the plan?
- How does the requested change affect the plan?
- Are the cost estimates correct?
- What corrections need to be made?
Resources
- To what extent are the resources used?
- Are the resources used for the right things?
- Have the right staff been allocated to the right tasks?
Goal Completion
- Do activities end on time?
- Are the time estimates correct?
- Do planning and working methods work?
- Do forecasts need to be updated?
There are, of course, more questions to answer. Questions must be tailored to the specific situation and the above questions should therefore be seen merely as examples of basic questions. The questions and answers mean that plans must constantly be updated to reflect the changes and decisions being made.
9.4. Chapter Summary
In this chapter, we have discussed how projects can be managed and implemented. Projects are a key route for an organisation to realise benefits and value offerings, since they involve activities that bring the organisation closer to its goals and ultimately realise its vision.
We have looked more deeply into two areas: project portfolios and individual projects. Project portfolios are simply about making sure that money is invested, and that other resources are spent on the activities and projects that bring an organisation closer to its goals. If project portfolios focus on the holistic, then projects are more specific, and focus on a specific investment.
We posed and answered questions such as how projects are selected and resources used, in order to ensure that the right course of action according to the goals set is taken.
Project management is difficult and requires a number of skills and the ability to change roles frequently, for instance between leading and marketing a project without much preparation time. It is important to remember that all projects involve risk and the project manager has a great responsibility to manage them properly. We have discussed a number of risk management approaches, from fairly simple to more complex multi-criteria analyses.
The purpose of this chapter was not to give a comprehensive overview of projects and portfolios (there are entire books on these topics), but to situate the project in the context of its benefit, and how this benefit is realised.
What a project manager chooses to do, or how they choose to manage a portfolio, is ultimately up to them and their organisation. Here we have indicated a number of areas that are important to consider, and suggested a number of ways of working. How you proceed with and apply them is your choice!
We are now starting to approach the end of the book, but before wrapping up, we will look at digital transformation in higher education, and in doing so, move towards a global perspective.
9.5. Reading Tips
- Brewer, Jeffrey L. and Dittman, Kevin C. (2023). Methods of IT Project Management. West Lafayette, Purdue University Press, https://doi.org/10.2307/j.ctv2ckjpzf.
- Hopkin, Paul (2017). Fundamentals of Risk Management: Understanding, Evaluating and Implementing Effective Risk Management. New York: Kogan Page.
- Haimes, Yacov Y. (2016). Risk Modelling, Assessment, and Management. Hoboken, New Jersey: Wiley.
- Koelsch, George (2016). Requirements Writing for System Engineering. Berkeley, CA: A Press, https://doi.org/10.1007/978-1-4842-2099-3.
- Bjarnason, Elisabeth; Unterkalmsteiner, Michael; Borg, Markus and Engström, Emilie (2016). A Multi-Case Study of Agile Requirements Engineering and the Use of Test Cases as Requirements. Information and Software Technology 61, https://doi.org/10.1016/j.infsof.2016.03.008.
- Sutherland, Jeff (2014). Scrum: The Art of Doing Twice the Work in Half the Time. New York: Crown Business.