1. Europe
© 2023 Andrea Brasili et al., CC BY-NC 4.0 https://doi.org/10.11647/OBP.0386.01
This chapter describes the dynamics of public investment over the review period and its likely path ahead. In 2022, public investment growth largely exceeded total expenditures growth, and it is set to increase further. The reinstatement of fiscal rules (after the deactivation of the General Escape Clause) would not necessarily lead to a decline in public investment thanks to the financial resources provided by the RRF. Meanwhile, there is some tentative evidence that high inflation and capacity constraints in the public administration are slowing the implementation of the RRF. Improving implementation capacity is key for the success of the existing plans and preserving absorption capacity for future investments is crucial for Europe to maintain a leading role in the needed digital, green, and energy transitions.
1.1. Public Investment, Current Dynamics, and Plans
Over the review period, the EU has had to respond simultaneously both to imminent and to long-term challenges: to lower inflation while preserving financial stability, to consolidate fiscal budgets while softening the effect of the energy and food price shocks, and to preserve energy security while accelerating the transition to climate neutrality.1 In its response to the last challenge, support for public investment plays a key role. Combining information from Eurostat, the Member States’ Stability and Convergence Programmes, the Recovery and Resilience Facility implementation, and the TED procurement database, this chapter provides an overview of public investment from various perspectives. The first section of this chapter describes the dynamics of public investment in Europe in 2022. In the last three years, public investment as a ratio of GDP increased to levels close to the pre-Great Financial Crisis average. In 2022, public investment growth largely exceeded total expenditures growth. According to Member States’ plans, the ratio will increase further, particularly in Southern European countries, with a large role played by the RRF. The second section looks at the dynamics of planned investment from the perspective of the available fiscal space. Until 2026, the reinstatement of fiscal rules (after the deactivation of the General Escape Clause) would not necessarily lead to a decline in public investment thanks to the financial resources provided by the RRF, but what will happen in the long run is less clear. The third section describes the ongoing RRF implementation efforts one and a half years after the start of the implementation period and its emerging challenges and difficulties. Small, but rising gaps are observable between planned and realised implementation of the RRF measures as well as between planned and actual disbursements, pointing to capacity constraints and implementation bottlenecks. These findings are corroborated by evidence from the publication of procurement notices as well. Finally, the concluding remarks add a broader context to the above-mentioned sections as well as an outlook regarding the main challenges facing public investment.
1.2 Public Investment in Europe: The Most Recent Data
In 2022, government investment rates in the EU remained high, despite a small decline relative to 2021 (see Figure 1.1). Aggregate investment of the general government in the EU was 3.2% of GDP. This is practically equal to its historical average and somewhat higher than the average since the end of the global financial crisis. Investment rates in Southern Europe are still below their historical average, despite significant progress over the past 4 years. In the rest of the EU, investment rates were mostly above historical averages. The observed modest decline is a consequence of slower growth in nominal investment, compared to nominal GDP (see Table 1.1).
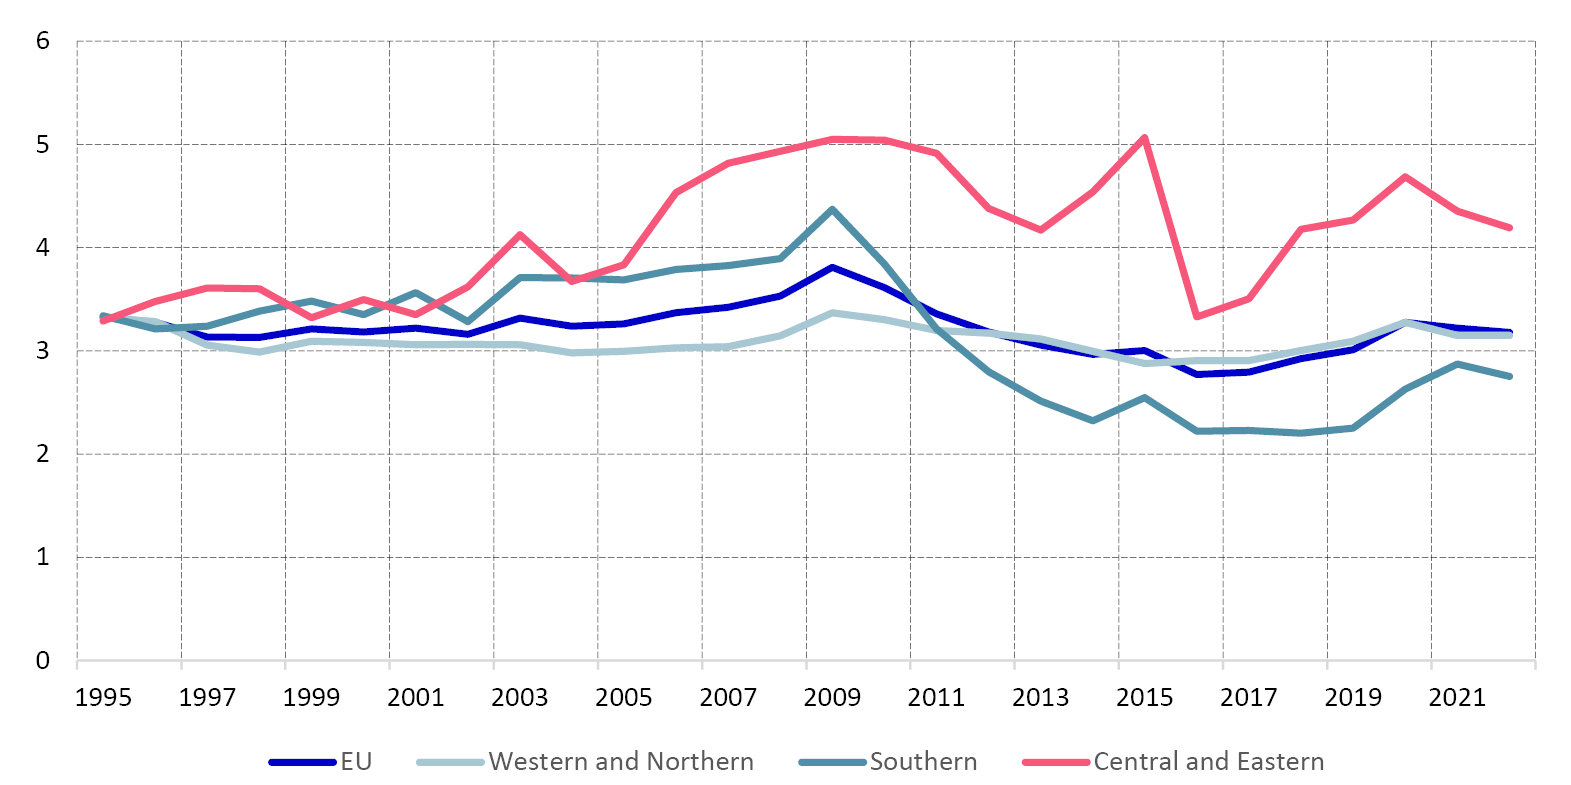
Fig. 1.1 Gross Fixed Capital Formation of the General Government (% GDP).
Source: Authors’ calculations based on AMECO.
Government investment grew faster than total government expenditure in the EU. Total expenditures of the general government in the European Union grew by 4.8% in 2022, relative to 2021. This was 3 p.p. slower than expenditure on gross fixed capital formation and shows that EU governments have continued to prioritise investment. Total expenditure grew even slower in Western and Northern EU in 2022, by 3.8%. Only in Central and Eastern Europe did the growth rate of total expenditures exceed the growth rate of investment: by about 1 p.p. The rate of growth of government investment exceeded the increase of government debt by 3.5 p.p. in the EU on aggregate. In Q1 2023, nominal gross fixed capital formation grew by 7.4% YoY, keeping pace with the previous year.
Table 1.1 Investment and GDP (annual % change)
|
European Union |
Western and Northern |
Southern |
Central and Eastern |
|
|
Investment |
7.1 |
7.3 |
4.1 |
10.5 |
|
GDP |
9.3 |
8.3 |
9.0 |
16.0 |
Source: Authors’ calculations based on AMECO
Real government investment remained broadly stable in 2022 (see Figure 1.2). Despite the high growth of nominal investment, real government investment did not change much. The high rate of inflation in 2022 meant that real government investment remained just below its 2021 levels. Real investment in Northern and Western Europe was practically unchanged, while in Southern Europe it was about 1% lower. In Central and Eastern Europe real government investment was about 2% lower than in 2021.
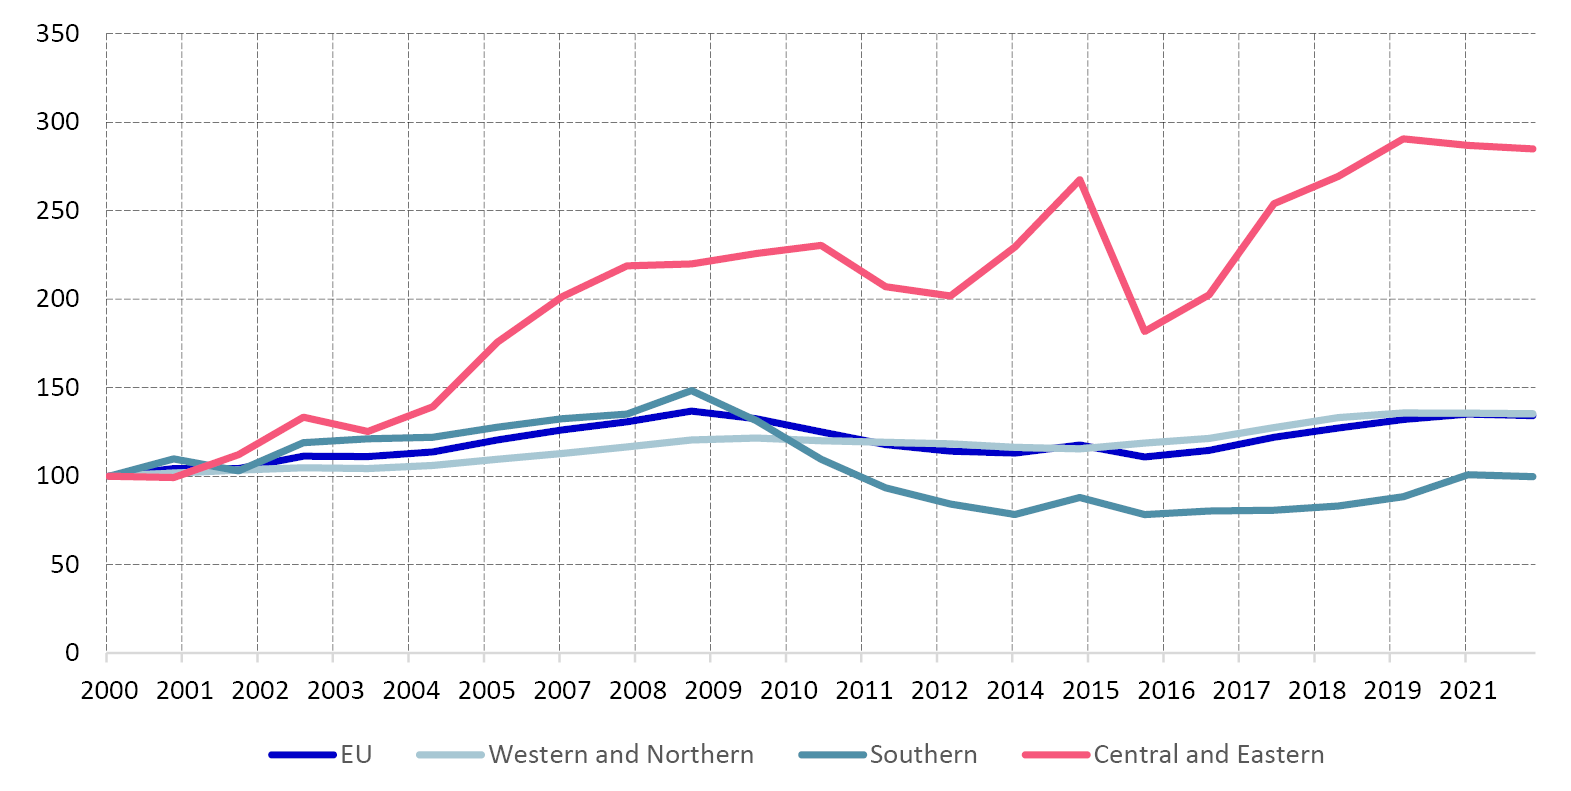
Fig. 1.2 Real Gross Fixed Capital Formation of the General Government (index 2000=100).
Source: Authors’ calculations based on AMECO.
Real investment of local governments was more resilient than that of central and regional governments. Overall in the EU, real investment of local governments increased by 1.3% in 2022 relative to 2021. The highest increase was in Southern Europe, where real investment grew by 3.1%, followed by an increase of 2.7% in Central and Eastern Europe. This growth was offset by declines in central and regional government real investment. Real investment of the central government in the EU declined by 1.4%, while regional government investment declined by 4.4%.
EU nominal spending on investment grants and other capital transfers in the EU increased by 14% in 2022. The highest increase in such expenditure was in Western and Northern Europe, where it grew by 22%. In Southern Europe, investment grants and other capital transfers increased by 13%, while they grew 7% in Central and Eastern Europe.
1.3 Projections of Public Investment and Capital Transfers in Member States’ Stability and Convergence Programmes
At the end of April 2023, European Union (EU) Member States released their Stability and Convergence Programmes and delivered them to the European Commission (EC). According to the Fiscal Framework Revision proposal, these documents will be merged with the National Reform Plans starting from the European semester of 2024. In this way, a joint assessment can be made of each country’s adherence to the fiscal trajectory and to the planned structural reforms and investments. As usual, the plans include multi-years’ budgetary evolution according to the envisaged fiscal plans and macroeconomic projections. It must be considered that at the time these plans were released, the European Central Bank (ECB) had already raised interest rates six times in a row (there was a total increase of 350 basis points from July 2022 to March 2023), and market expectations were suggesting a further 75 basis-point increase in the policy rate (with a final rate of 3.75% for the deposit rate and 4.25% for the refinancing rate). At the same time, in the Economic Policy Recommendations, the EC highlighted that ‘in the medium term, fiscal policies should ensure fiscal sustainability and prioritise investment to support the twin transition and social and economic resilience’. An emphasis on keeping the bar high on public investment was clear in all the preparatory work and in the proposal of the EU fiscal framework reform (see below and other chapters of this Outlook). The salient motivation behind it is the acknowledgement of the increased role of public actions in fields like energy security, the climate transition, digital transition, and the consequent increased opportunity and needs of providing European Public Goods. An important reference on this topic is Fuest and Pisani-Ferry (2019), which highlights the need for the EU to specifically target the production of public goods that are more efficiently provided at EU than at national level. Buti, et al. put this issue in a different perspective in various contributions (see Chapter 11 in this Outlook), highlighting the opportunity of supplying European Public Goods as the most palatable way of creating a Central Fiscal Capacity. According to the Stability and Convergence Programmes released in late April, Member States followed the suggestions of the EC and kept the rising trend in the ratio of public investment/GDP intact for the next years.
1.3.1 Projections of Public Investment in Member States’ Stability and Convergence Programmes
The Stability and Convergence Programmes that were released in April indicate that the Member States complied with the European Commission’s plea for continued high standards for public investment, keeping intact the upward trend in the public investment-to-GDP ratio.
The graph below (Figure 1.3) projects the planned evolution of public investment as a ratio of GDP for the whole European Union and for the macro-regions.2 This graph shows a continuation of the recent upward trend at the EU level. The public investment-to-GDP ratio is projected to go from 3.2% in 2022 to a peak of 3.6% in 2024–2025 and is expected to fall only slightly, to 3.5%, in 2026. This would be significantly higher than the average over the decade after the GFC (2011–2020) that was 2.8% but also with respect to the average in the decade before the GFC (3.3%), in line with the above-mentioned idea of an increased role for public investment. This movement is a mix of slightly different macro regional evolutions.
According to the projections, there will be a sharp increase in the ratio for Southern EU countries. Southern EU (SE) countries are expected to reach the EU average of 3.6% in 2024 (while they have been well below the EU average throughout the period from 2012 to 2022). Public investments in Central and Eastern European (CE) countries are estimated to stabilize at a high level (at 4.6% of GDP) for the period of 2024 to 2026 after reaching an earlier peak (relative to the EU) of 4.8% in 2023.
In the Northern and Western European (NW) countries, the ratio will move less than in other areas: it will reach 3.4% in 2025–2026 a marginally higher level than the long-term average (at 3.3%).
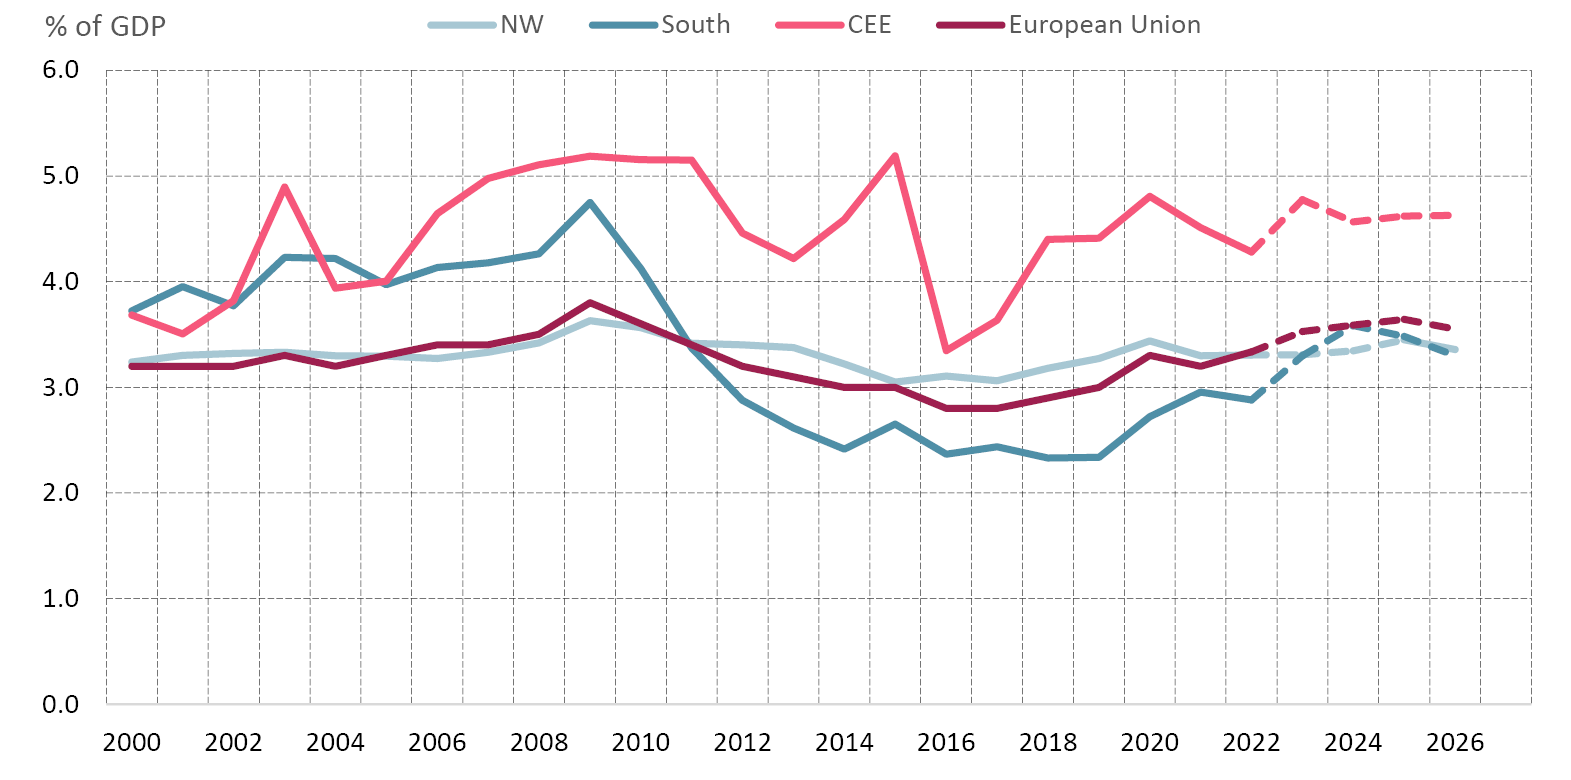
Fig. 1.3 Gross Fixed Capital Formation, as a Ratio of GDP.
Source: Authors’ calculations based on AMECO data (2000–2022) and on Member States’ Stability and Convergence Programmes.
1.3.2 The Role of Capital Transfers and Investment Grants
Public investments’ main motivation is always creating or improving the framework conditions in which private investment may find a more fertile territory to flourish. However, public investment is not the only option to facilitate private investment, capital transfers and, in particular, investment grants can also be used for this purpose.
While capital transfers are sketched in the Stability and Convergence Programmes,3 investment grants (that are a portion of capital transfers) are not. Figure 1.4 shows the massive use of capital transfers during and after the Great Financial Crisis (to support the financial sector) and during the COVID-19 crisis (to support the non-financial business sector).
Excluding these two episodes, the ratio of investment grants to total capital transfers has been almost stable at an average of 0.65% (that is, investment grants represented on average 65% of capital transfers). It is useful to refer to the whole aggregate for two reasons. Firstly, because investment grants are not reported in plans; secondly, it may represent a useful policy tool (outside of crises episodes when the public sector might respond to specific needs by buying into the equity of private companies).
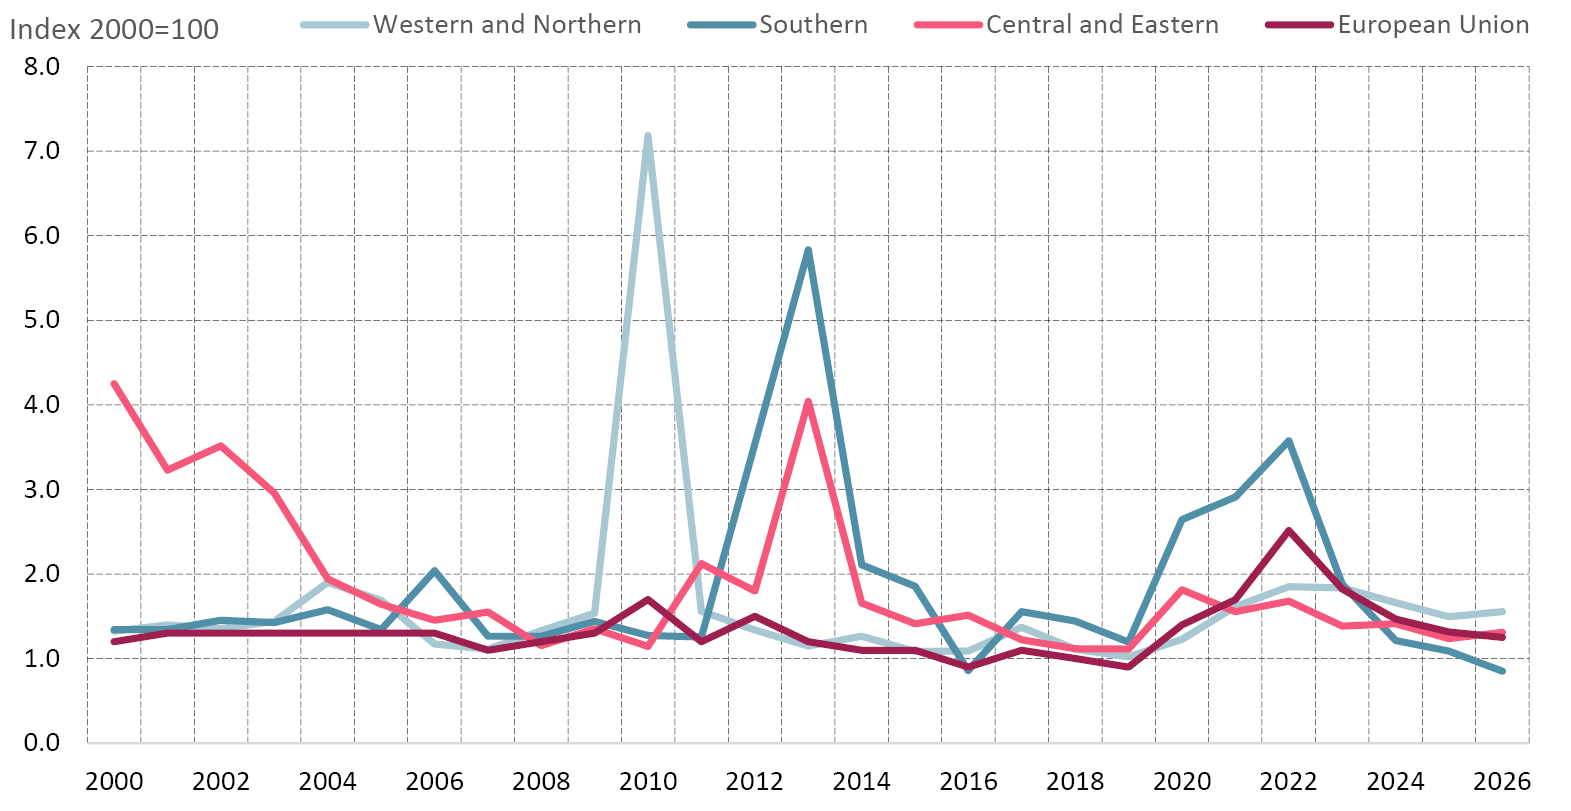
Fig. 1.4 Capital Transfers Before, During, and After Recent Crises.
Source: Authors’ calculations based on AMECO data (2000–2022) and on Member States’ Stability and Convergence Programmes.
Figure 1.4 also shows that the last period may have structural implications. Countries in NW Europe project a use of capital transfers proportionally larger than that of CE and SE countries. This may reflect a conscious choice: as noted above, the weight of investment grants increased notably in NW countries already in 2021–2022. Capital transfers for NW European countries are projected to represent about 1.6% of GDP from 2023 to 2026 (compared to an average of 1.2% from 2011 to 2019).
1.4 The Role of the Recovery and Resilience Facility (RRF)
This year, the Convergence and Stability programmes mandatorily include a table that shows the role of the RRF on both the revenues and on the expenditures side. On the expenditures side, RRF resources are split into current and capital expenditures. In turn, capital expenditures are split in capital transfers and public investment. In addition, we also include what is reported in the summary RRF table by some countries as ‘financial transactions’. This is because the category includes planned participations in start-ups or similar initiatives by some of the Member States, which can be considered as having a similar role as capital transfer. The countries that are making use of these expenditures are Greece, Croatia, Portugal, and Romania. However, current expenditures financed through RRF grants or loans are excluded.
Figure 1.5 shows the contribution of the RRF to support public investment. The average weight of the RRF relative to GDP (shown by dark blue bars) is quite high in the following CE countries: Bulgaria, Croatia, Hungary, and Romania. It is also quite high in the following SE countries: Greece, Italy, and Portugal. Figure 1.6 provides more information about the dynamics and shows the contribution of the RRF to the change in government gross fixed capital formation (GFCF) in the period 2023–2026 compared to their level (as a ratio of GDP) in 2011–2019. For many countries, RRF allows for the acceleration of capital spending in the period considered. The dark and light blue bars almost coincide for Italy, Croatia, Latvia, and Czechia; RRF is a bit lower but gives a very large contribution for Romania and Greece, and it is larger than the acceleration in public investments for Bulgaria, Lithuania, Slovakia, and France. Estonia, Cyprus, Poland, and, particularly, Hungary project a lower level of public investment in the period 2023–2026 than the one they experienced in 2011–2019, but the difference would be much higher without the RRF contribution.
The RRF’s role is also large when it comes to capital transfers. Figure 1.7 illustrates the average planned capital transfer as a ratio to GDP for the period 2023–2026 and the average of the expenses that are financed through RRF funds as a ratio to GDP for the same period. It is very clear from this figure that the use of capital transfers is more concentrated in a few countries (in Estonia, Greece, Croatia, Italy, Cyprus, and Portugal).
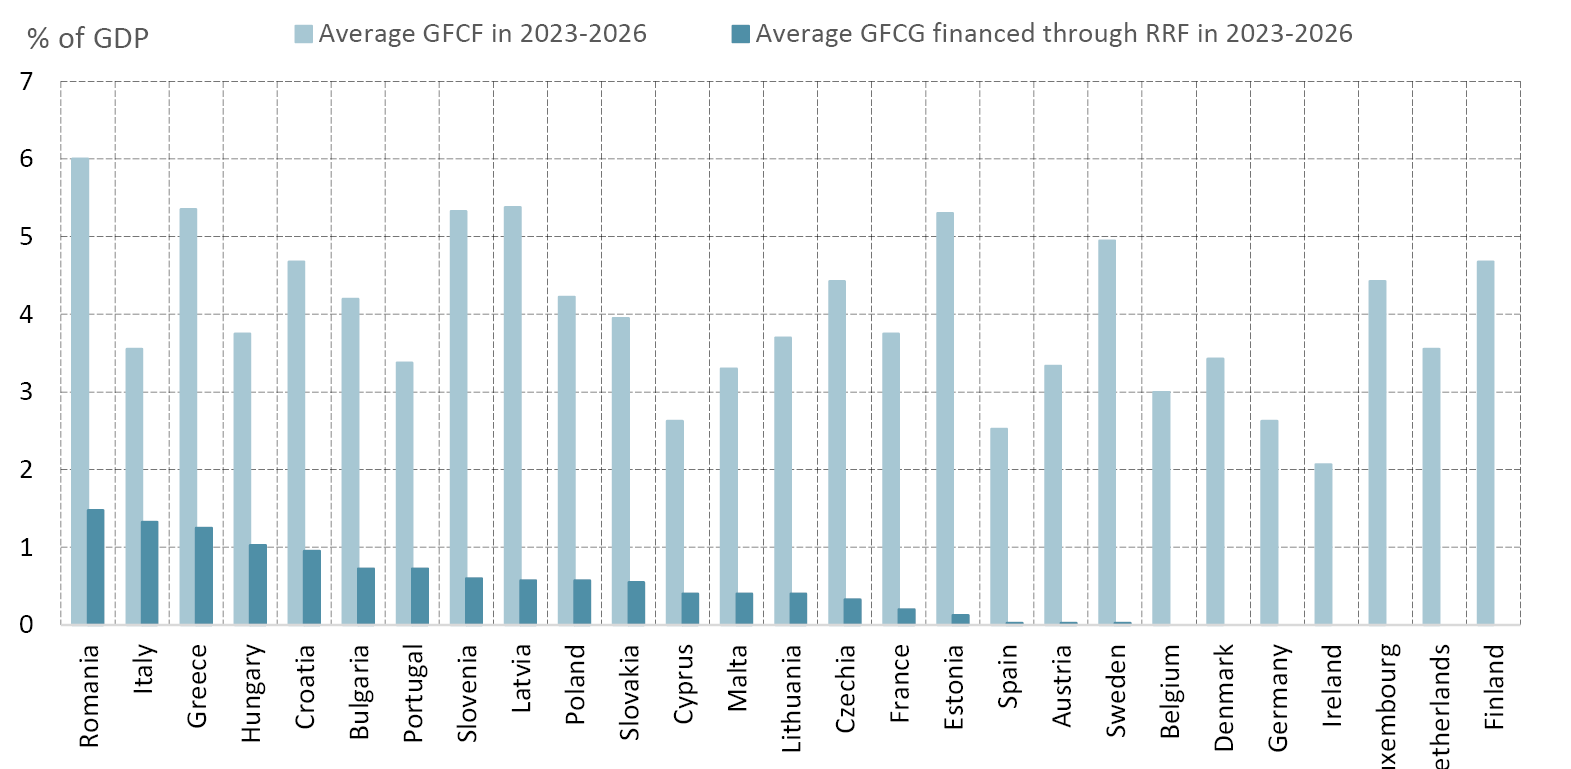
Fig. 1.5 The Role of RRF in Supporting Public Investment, 2023–2026.
Source: Authors’ calculations based on Member States’ Stability and Convergence Programmes.
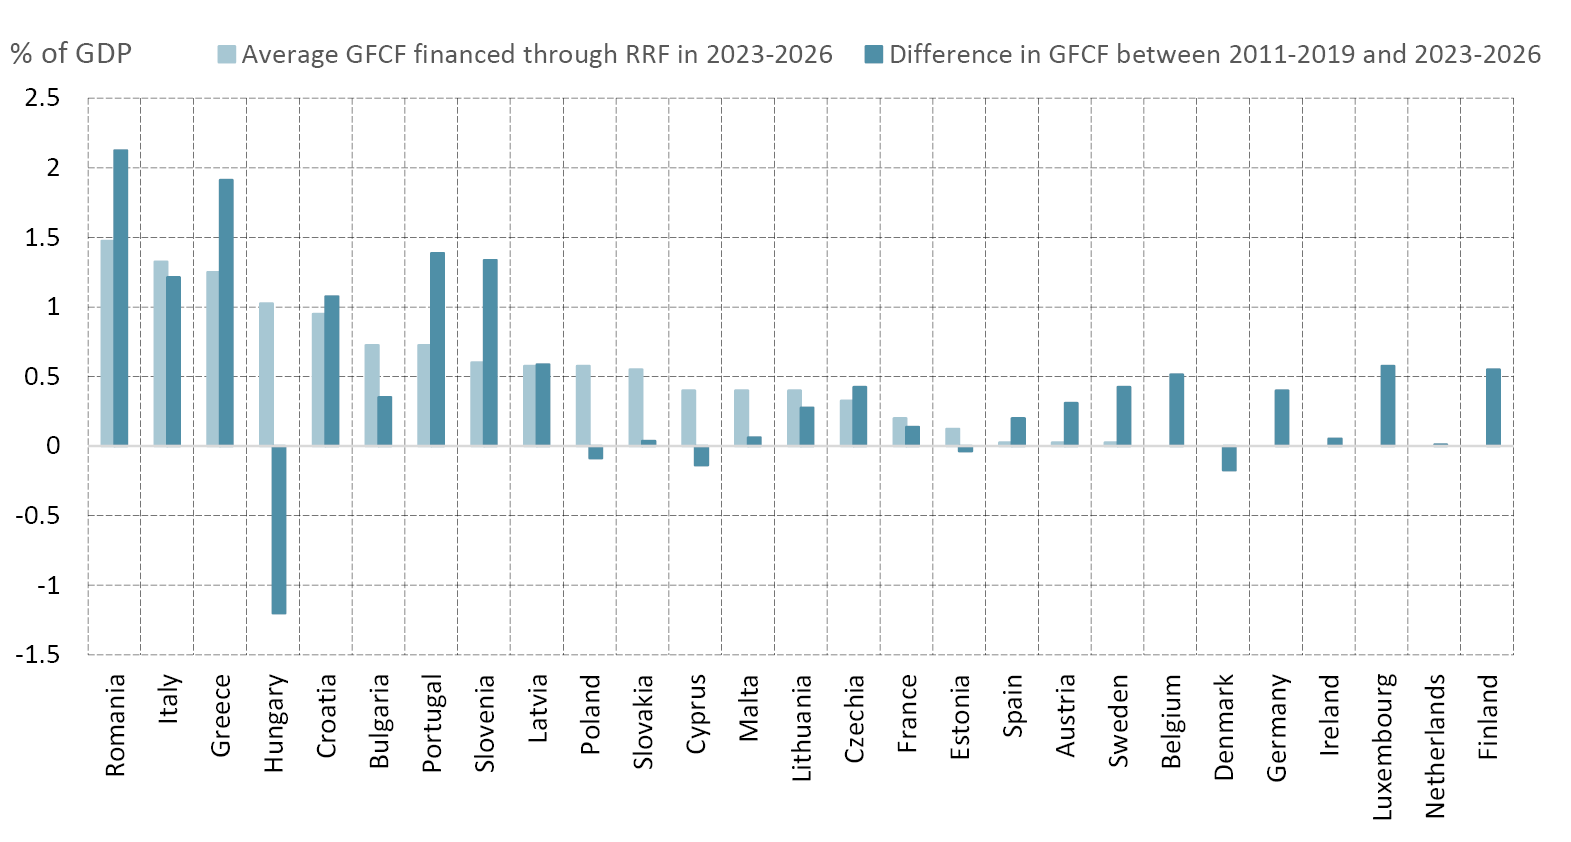
Fig. 1.6 The Role of RRF in Supporting the Acceleration of Public Investment, 2023–2026.
Difference in GFCF between 2011–2019 and 2023–2026
Source: Authors’ calculations based on Member States’ Stability and Convergence Programmes.
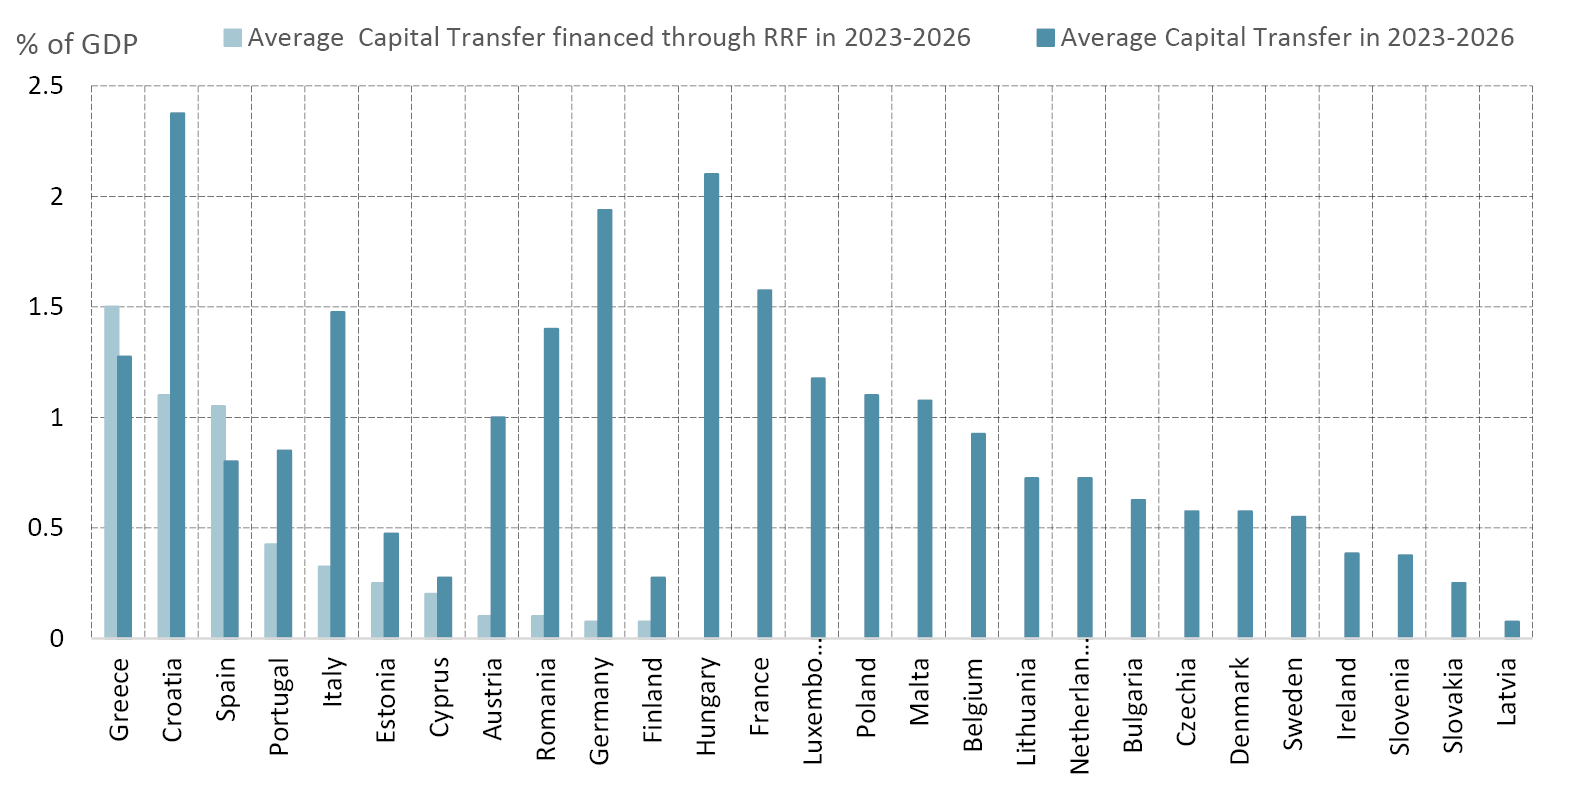
Fig. 1.7 The Role of RRF in Supporting Capital Transfers, 2023–2026.
Note: Spain’s average RRF is based on the 2021–2024 period. Greece’s average includes financial transactions, that are sizeable. Financial transactions are also included for Croatia, Portugal and Romania. For France, the Stability Programme (SP) does not distinguish between capital transfers and gross fixed capital formation. Both are described as capital expenditures. These capital expenditures are included here as gross fixed capital formation. As for Italy, the latest plan includes only the sum for the period 2020–2026 (for both GFCF and capital transfers), while the SP for 2022 detailed RRF-funded expenditures by year. These amounts have been divided by the total number of years so that the 2022 target profile has been maintained as much as possible.
Source: Authors’ calculations based on Member States’ Stability and Convergence Programmes.
In summary: first, Member States have endorsed the EC recommendation to keep the bar high for public investment in their fiscal plans; second, the RRF contributes significantly to this effort, especially in the SE and CE countries.
1.5 Is the Old Framework ‘Biting’ with Respect to Plans? Will Member States Diminish their Investment Attitude?
As discussed above, the Stability and Convergence Programmes were drafted in a situation where the General Escape Clause was still valid (even though its deactivation had already been decided for 2024), debates around the proposal for a new fiscal framework were also ongoing, and the ECB had not yet completed its tightening cycle. The ambition of this section is to show how these elements combine to shape Member States’ policy choices on investment. The EU Commission assessed the evolution of fiscal stance in Member States according to the reference indicator that was proposed in the new fiscal framework (under discussion). In particular, the ‘Fiscal Statistical Tables providing background data relevant for the assessment of the 2023 Stability or Convergence Programmes’ make reference to the fact that fiscal stance should be judged net of the expenditures financed by RRF grants. This suggestion is also taken into account here.
1.5.1 Interest Expenditures are Projected to Rise Slightly
In their plans, Member States projected that interest expenditures will gradually increase from the current 1.62 to 2.03 as a percentage of GDP. Table 1.2 shows the disaggregation in EU macro regions. While there is a large gap in levels of interest expenditures that is explained by the dimension of the debt (that is much larger for SE countries than for the other areas), the projected increase over the projection horizon is not particularly different. This is likely due to the longer maturity of the underlying portfolios of highly indebted countries.
Table 1.2 Interest Expenditures/GDP

Source: Authors’ calculations based on Member States’ Stability and Convergence Programmes.
The dynamics of interest rates (after the draft of the Stability and Convergence Programmes) can cause some further increase in interest expenditures, but this should not alter this picture dramatically.4
1.5.2 General Government Deficits are Projected to Decline
Regarding the deficit, the gradual phasing out of the measures that were introduced to support households and businesses after the Russian invasion of Ukraine, and an improving economic cycle from 2024 on, should favour a decline in deficit. Table 1.3 shows the deficit declining from above 3% in the EU and in all macro regions in 2023 to below that threshold, although by not a huge margin, by 2026.
Table 1.3 General Government Net Lending

Source: Authors’ calculations based on Member States’ Stability and Convergence Programmes.
It is important to understand that in case of any slippage in public accounts, public investment, an easy-to-cut item from a (national) politics point of view, may come under pressure.
1.5.3 The evolution of fiscal stance: changes in the structural primary balance
Having a look at the change in structural primary balance can be useful as a way to assess the change in fiscal stance, particularly as the old framework included the assessment of the path and speed of movements towards the Medium-Term Objective. It is important to understand the effect of worsening public finances on public investment. Therefore, it is useful to look at changes in the structural primary balance to determine changes in fiscal policy. Table 1.4 clearly shows that fiscal policy becomes more restrictive after 2023 and that there is a marked decline in the deficit. This decline in the deficit is also clearly smaller after 2024.
Table 1.4 The Change in Structural Primary Balance as a Simple Indicator of Fiscal Stance

Source: Authors’ calculations based on Member States’ Stability and Convergence Programmes.
It is important to know that, if the RRF grants (shown in Table 1.5) were taken out of the picture, the improvements in the structural primary balances for SE and CEESE countries would disappear.
Table 1.5 The Share of Expenditures that are Financed Through RRF Grants

Source: Authors’ calculations based on Member States’ Stability and Convergence Programmes.
In conclusion, according to the Stability and Convergence Programmes released by the Member States, it appears that the deactivation of the General Escape Clause would not necessarily lead to a decline in public investment, provided that RRF-related grants are excluded from the calculation of the fiscal stance. However, once the RRF ends, the constraints might very well bind, given that the grants exceed the projected improvements in the structural primary balance for SE and also CEESE. Without a substitute for the RRF after 2026, public investment might come under renewed pressure.
1.6 Congestions and Bottlenecks in Public Investment in EU
One key element at the current juncture is the existence of potential limits in the capacity to implement this enhanced public-capital-spending effort supported by the RRF. As demonstrated by the tables and graphs above, the RRF is very large for some countries. Hence, it is not certain that all government agencies involved will succeed in the big effort of implementing the measures of the Recovery and Resilience Plans in time. The RRF governance design is performance-based, implying that each Member State, before asking for a payment, must prove the successful realisation of pre-agreed steps (milestones and targets) of the various measures. Payments are semi-annual and follow documented requests of Member States. In addition, for each country, it is mandatory to provide a semi-annual analysis of how the implementation of the plan is going. This section provides a preliminary overview of this self-reported monitoring exercise and takes a look at delays in RRF-related public procurement.
In April 2023, for the fourth time since the RRF began, Member States uploaded a dataset containing the results of their monitoring to the EC. They also provided evidence of this (summarized) information in their National Reform Plans (along with the Stability and Convergence programmes). Summing up for the EU until the end of 2023, there are about 3195 measures reported upon. The overview of this section will focus on these measures. Looking backward on milestones and targets (that is, those planned to be achieved up to Q1 2023), 32% are marked as fulfilled and 49.4% as completed (but not yet assessed), while 18.6% (that is, less than 1 in 5) were not completed. This represents a 1.1 p.p. increase of not-completed projects compared to the previous reporting round. On the other hand, looking ahead at milestones and targets with target dates in 2023, the vast majority were reported as being either on track (78.6%) or completed (7.4%), with 14% being delayed (a 5 p.p. increase of the latter compared to the previous reporting round).
As demonstrated by Panel A of Figure 1.8, a gap started to open in Q4 of 2021 between the planned-versus-realised number of milestones and targets. The opening became gradually larger over time up to Q1 2023, and it is foreseen to grow further in the remaining quarters of 2023. Requests by Member States for RRF disbursements are sent to the EC once the related package of measures have been implemented (with the exception of pre-financing payments that are not conditional on implementation of milestones or targets). The first payments based on the operational agreements between Member States and the EC were foreseen for Q4 2021. Panel B of Figure 1.8 show that a gap between planned and realised disbursements appeared already in the very first quarter of the foreseen timeline. This gap has further widened from €39bn in Q4 2021 to €113bn in Q2 2023.
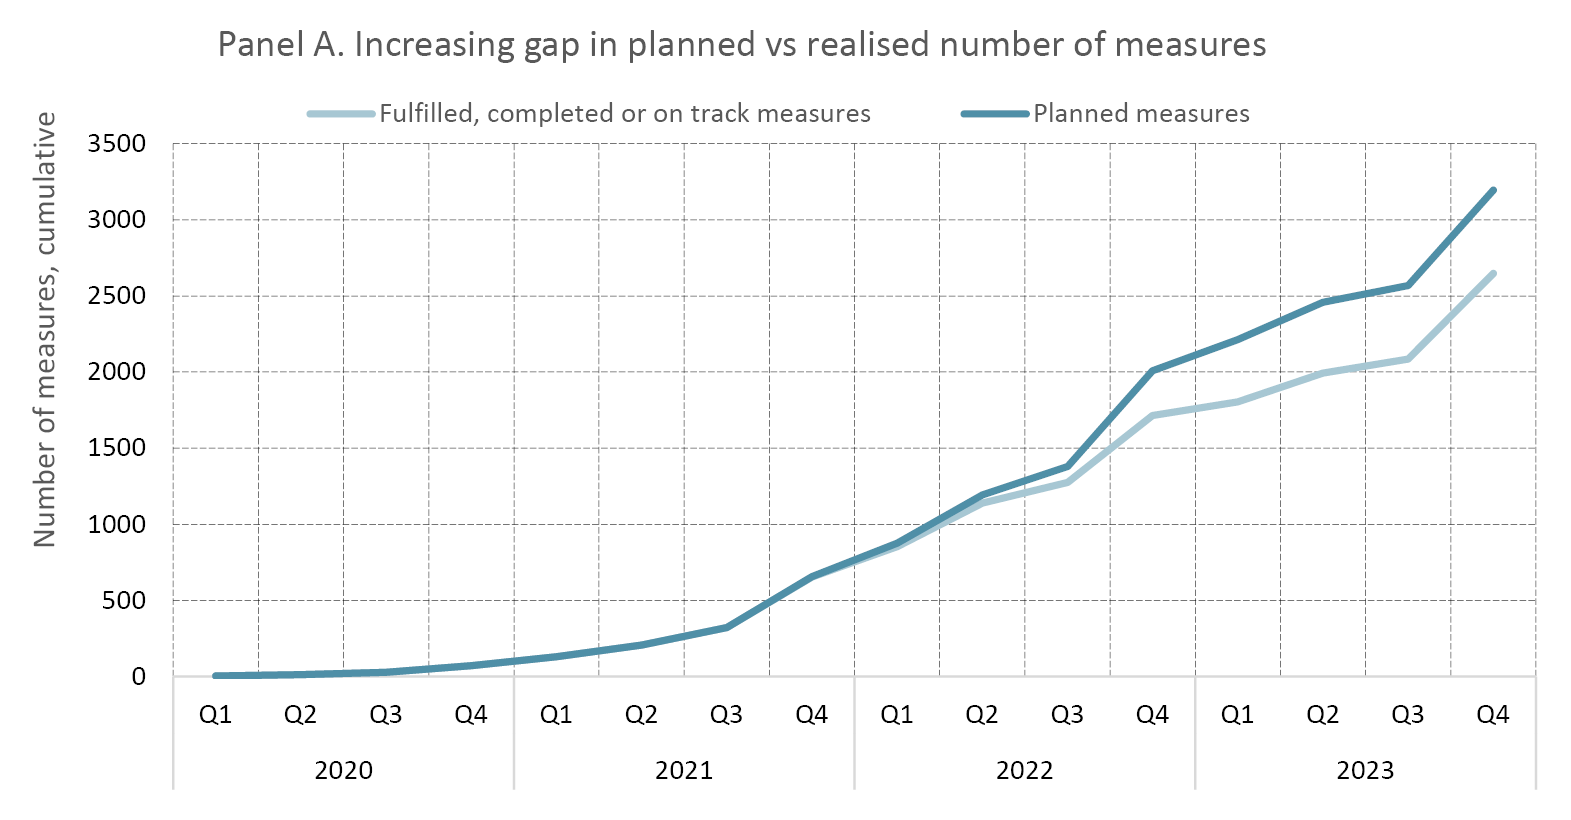
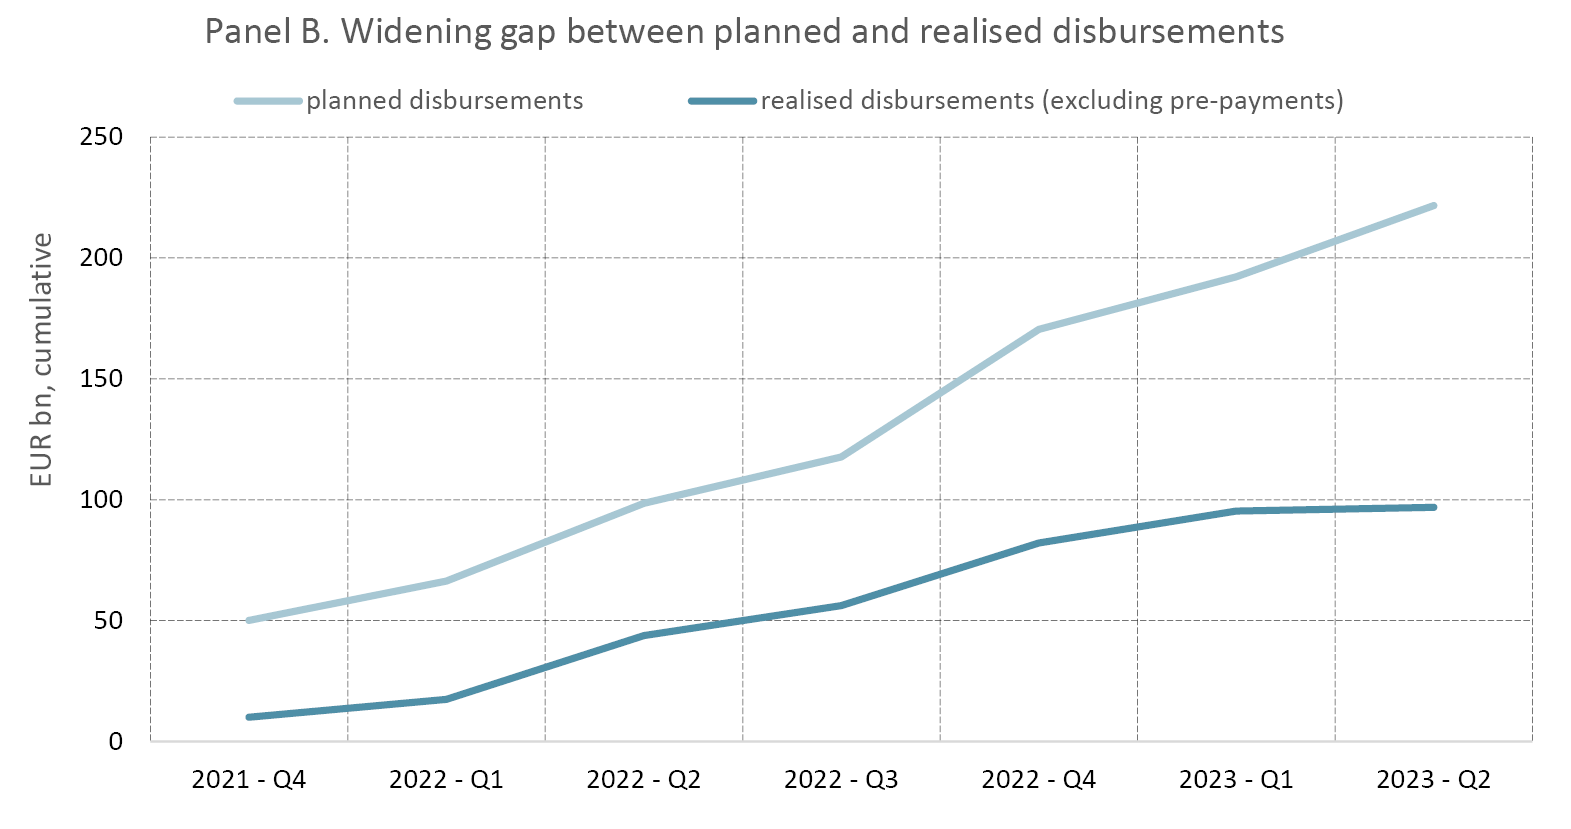
Fig. 1.8 A Gap between Plans and Realisations in RRF Implementation.
Source: Authors’ calculations based on Member States’ self-reported data on RRF implementation, RRF Operational agreements, and the Recovery and Resilience scoreboard.
Earlier reporting rounds made clear that the implementation of reforms has frequently been frontloaded in the plans, in preparation for structural changes. Also, the higher number of milestones and targets related to reforms in the past signals that investment-related projects might take more time to implement. In 2022, the number of not-completed investments and reforms were similar (corresponding to 21.5% and 21.7%, respectively). As Figure 1.9 shows, in 2023, there are a higher number of investments due than reforms, with the majority of them being on track (69.2%). Among delayed or not-completed measures in 2023, there are a higher number of investments than reforms (141 versus 111, respectively); however, these correspond to a smaller share (20.4% versus 22.4%, respectively). The higher number and share of anticipated delays among investments than reforms might signal the impact of price increases as well as remaining shortages and supply-chain bottlenecks.
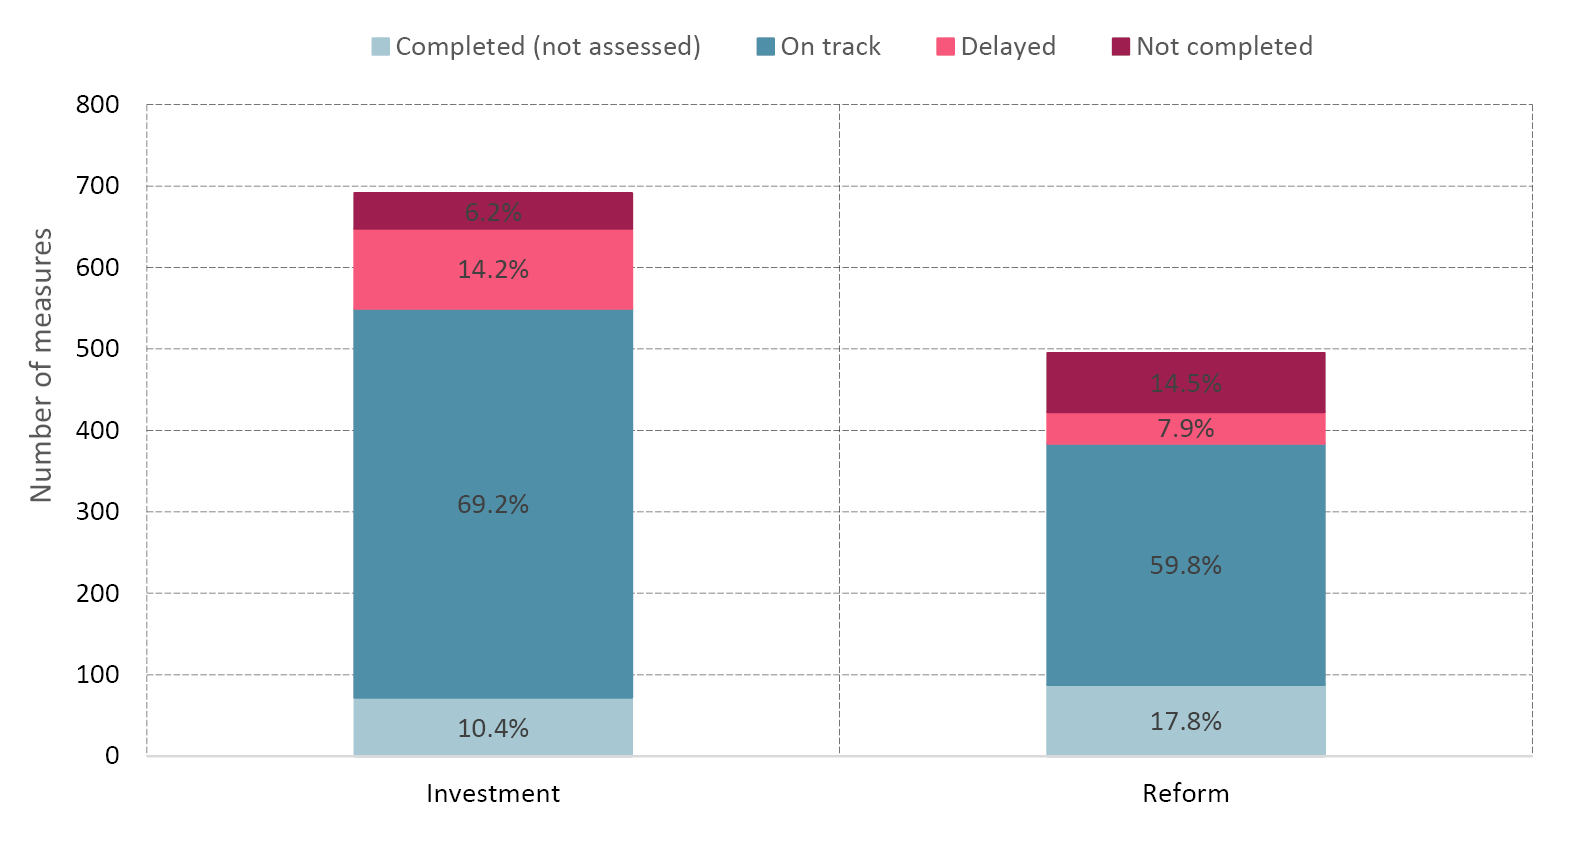
Fig. 1.9 Status of Investments and Reforms in 2023.
Source: Authors’ calculations based on Member States’ self-reported data on RRF implementation.
Looking at areas of implementation, which are closely related to the pillars of the RRF plans, some topics stand out either because their implementation seems to be on an improving trajectory or because there are more delays observable among them than among all measures on average. When looking at delayed measures, the areas of research or innovation are underrepresented. That is, measures related to these areas don’t seem to suffer from any impediments of implementation (see Table 1.6a). This is indicative of the quarters ahead in 2023. When looking at not-completed measures, areas such as next generation or policy, and green transition, were also underrepresented, indicating that their implementation was also relatively faster in the past. However, the area of research and innovation was neither under- nor over-represented among not-completed measures, which signals that these areas’ relative advantage in implementation was not yet observable in 2022.
Table 1.6a Areas with Relatively Faster RRF Implementation, 2020–2023
|
% |
Research |
innovation |
next generation | policy |
green transition |
|
total |
6.1 |
5.9 |
8.6 |
1.6 |
|
delayed |
2.9 |
4.4 |
5.1 |
0.7 |
|
not completed |
6.1 |
5.9 |
7.6 |
0.5 |
Note: The calculation is based on text search using the keywords indicated in the columns. In case of multiple keywords, the symbol ‘|’ indicates inclusive ‘or’.
Source: Authors’ calculations based on Member States’ self-reported data on RRF implementation.
Among delayed and not-completed measures, the area of infrastructure is salient, with 7 p.p. higher share of delayed and 4 p.p. higher share of not-completed projects than infrastructure’s overall share among measures (see Table 1.6b). When looking at the area including infrastructure or development or infrastructure and buildings, the results are similar. Infrastructure projects can suffer from delays when there are supply-chain disruptions or price increases, as these can affect the tendering process. Among delayed measures, we see the overrepresentation of some other larger areas (1. municipalities or authority, 2. solar or wind or hydrogen, 3. digital transformation, 4. digital or energy or twin or transition). These results point to potential capacity constraints in municipal authorities and in the specific areas of the energy and digital transition.
Table 1.6b Areas with Bottlenecks in RRF Implementation, 2020–2023
|
% |
infrastructure |
infrastructure | build |
municipalities | authority |
solar | wind | hydrogen |
digital transformation |
digital | energy | twin | transition |
|
total |
11.8 |
19.7 |
13.0 |
3.7 |
3.0 |
33.7 |
|
delayed |
19.0 |
28.5 |
17.5 |
4.4 |
4.4 |
39.4 |
|
not completed |
16.1 |
23.7 |
11.5 |
4.6 |
1.7 |
30.0 |
Note: The calculation is based on text search with the indicated keywords in columns.
Source: Authors’ calculations based on Member States’ self-reported data on RRF implementation.
In sum, the scaling-up of investments in specific areas, such as infrastructure, energy, and digital transition might lead to congestions, that is, slower implementation due to capacity constraints, in particular at a lower level of governance, for example, at municipality level. Supply-chain disruptions and price increases might add up to cause bottlenecks in the implementation of RRF measures, which can be illustrated by the visible gap building up between the planned and realised number of RRF measures as well as between the planned and actual disbursements that regularly follow the completion of RRF-measure packages.
Evidence from public procurement points into the same direction.5 The share of RRF-co-funded procurement notices relating to public investment has so far been small, ranging between almost zero in Northern and Western Europe to around 10% in Southern Europe. Procurement for other EU-co-financed investments appears to follow the same pace as in 2022 (Figure 1.10). However, the number of RRF-related procurement notices is rising rapidly. This could lead to congestion when it comes to the award of contracts or the implementation of RRF-co-financed projects, which need to be implemented by 2026. This congestion could also affect less time-sensitive projects, such as those co-financed by EU cohesion funds of the 2021–2027 programming period, which only need to be implemented by 2030.
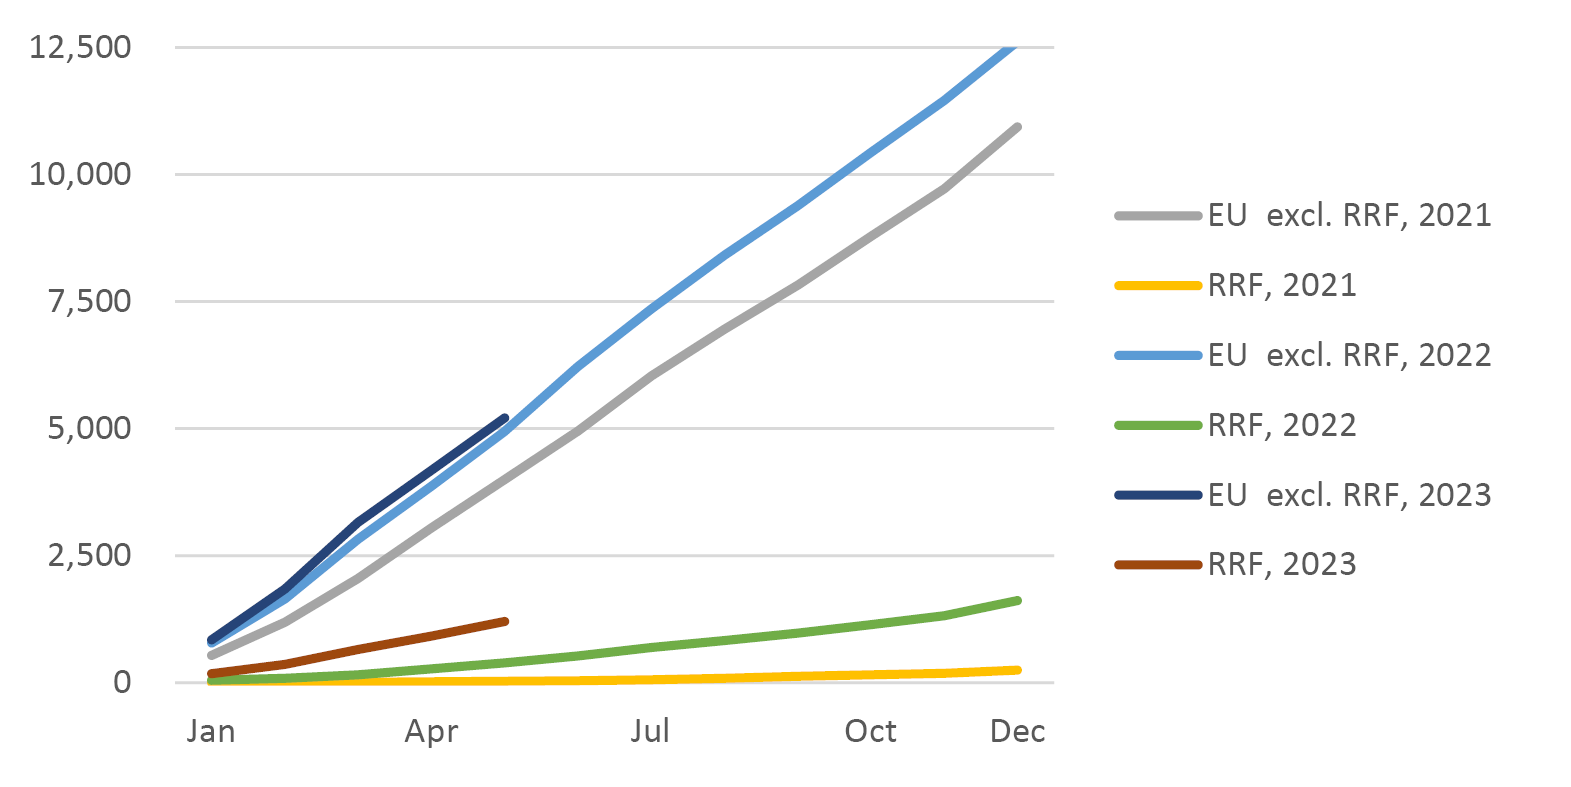
Fig. 1.10 Cumulative Issuance of Public-Investment-Related Procurement Notices Co-Financed by the EU, Southern and Eastern Europe, by Year.
Source: Authors’ calculations.
Already, there are some signs that capacity limits in the public sector are slowing procurement processes already underway. The delay between the submission of tenders and the signature of contracts appears somewhat larger for RRF-co-funded procurement than for nationally or EU-co-financed investment, at least for procurement related to construction (see Figure 1.11).6 This might capture the delays related to infrastructure projects that can be picked up from Member States’ monitoring of RRF projects (see above). However, the difference in the signature delays is small, and, given that the publication of procurement notices for RRF-co-funded projects only started to take off in 2021, the estimates of signature delays beyond 500 days become quite uncertain for RRF-related notices.
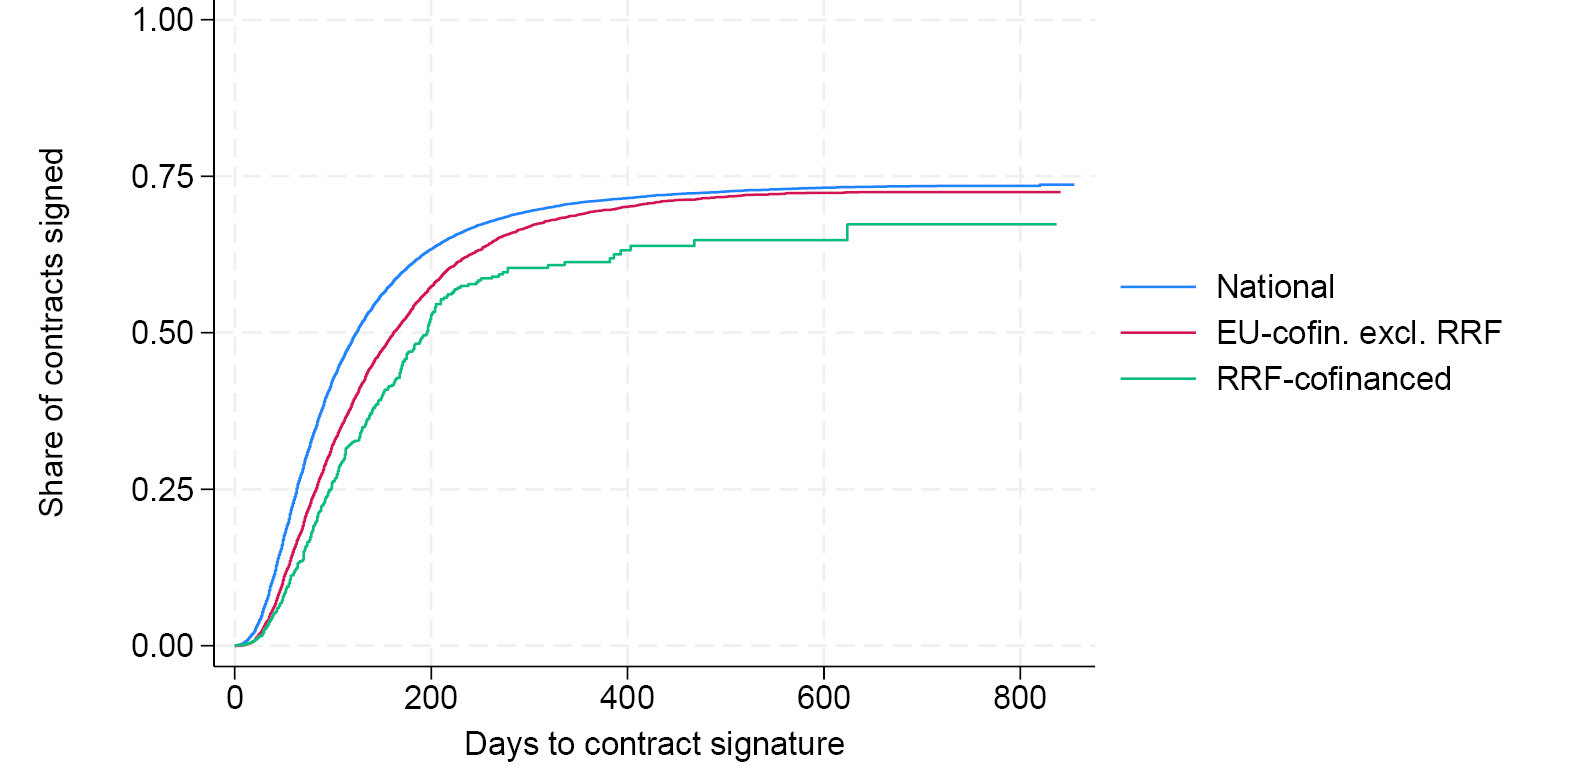
Fig. 1.11 Delay between Tender-Submission Deadline and Contract Signature.
Source: Authors’ calculations.
In summary, evidence from the publication of procurement notices corroborates the findings from Member States’ monitoring of the implementation of their Recovery and Resolution Plans: that bottlenecks have so far been small but may increase as the implementation of the planned investments gathers steam.
1.7 Concluding Remarks
The end of the pandemic and the outbreak of the Ukraine war added three new pairs of conflicting objectives to the EU’s economic policy: to lower inflation while preserving financial stability, to preserve energy security while accelerating the transition to climate neutrality, and to consolidate fiscal budgets while softening the effect of the energy- and food-price shocks. On balance, monetary policy tightened rapidly, and public spending accelerated, especially for public infrastructure related to the green transition. The European Commission has introduced new tools like the Next Generation EU fund and the RePowerEU plan. It has also proposed adaptations to the fiscal framework that make it easier for Member States to undertake longer-term investment programmes without hitting the limits of the framework. In addition, in the guidelines for fiscal policy, it pushed for the expansion of public-investment plans. The Next Generation EU fund and the Recovery and Resilience Facility are already providing resources to the EU economy through 2026. However, it is still uncertain how the need to sustain high levels of public investment will interact with the new fiscal framework. Some pressures may well re-emerge after 2026, once the RRF expires.
Now, it is high time to implement the planned efforts. As delays start to pile up in specific areas, it is worthwhile to have a closer look at their nature and specificities. As expected, there have been some delays in implementing the Recovery Fund. This is due, in part, to abrupt price increases that have drastically altered the costs of infrastructure and construction projects. Other delays relate to the diffuse nature of the projects, which involve multiple levels of local government. Improving implementation capacity is key for the success of the existing plans. Preserving space for future investments is crucial for Europe to maintain a leading role in the needed digital, green, and energy transitions.
References
Fuest, C. and J. Pisani-Ferry (2019) ‘A Primer on Developing European Public Goods’ EconPol Policy Report. vol. 3, November
European Commission (2022) Recommendation for a COUNCIL RECOMMENDATION on the economic policy of the euro area COM (2022), 782 final
European Commission (2023) European Semester: National Reform Programmes and Stability/Convergence Programmes
European Commission. ‘Recovery and Resilience Scoreboard’, https://ec.europa.eu/economy_finance/recovery-and-resilience-scoreboard/index.html
European Commission (2023) Report from the Commission to the European Parliament and the Council on the implementation of the Recovery and Resilience Facility: Moving Forward. 25 September. 545 final/2
TED database, https://ted.europa.eu/TED/main/HomePage.do
1 The authors would like to thank Katelijne Klaassen for her precious research work.
2 Data for EU and for macro-regions are obtained aggregating the numbers suggested by each Member States in their multi-year plans.
3 But not for example in the EC forecasts nor in AMECO.
4 At the moment of finalizing this chapter, while short-term rates are slightly higher with respect to market expectations back in late April, long term rates have declined more than previously thought partially compensating the first effect.
5 The following figures are estimates based on the information provided on public procurement in the TED database (https://ted.europa.eu/TED/main/HomePage.do), which exclude public procurement below certain value thresholds and may suffer from different reporting practices by different Member States. The estimates presented here are based only on contract notices and contract awards, including by utilities, of open tendering procedures, to make the dataset more homogenous. The large majority of procurement notices meets these criteria. Expert judgement has been used to allocate the types of works, goods and services that are procured to public investment, and to clean contract award values. The identification of RRF-co-financed notices is based on keyword extraction of descriptive text that most notices provide.
6 In the corresponding bivariate Cox regression, the hazard ratio is 15% lower for EU (excl. RRF)-co-funded investments than for nationally funded investments, and 35% lower for RRF-co-funded investments. Both estimates are statistically significant in that regression at the 1% level (50,000 contract awards, robust SEs). The share of contracts signed typically hits a ceiling at about 75% of contracts tendered in this dataset, including at longer horizons. This may reflect that some tendered contracts are never signed or gaps in the reporting of contract awards.
