
2. Financing Public Investment in France
© 2023 M. Plane & F. Saraceno, CC BY-NC 4.0 https://doi.org/10.11647/OBP.0386.02
The chapter first deals with the historical evolution of public investment and capital in France. While still high in comparison with other EU countries, it was significantly reduced since the early 1990s. A reversal of the trend, prior to COVID-19, was mostly due to local governments. After COVID-19, a rebound was followed by flat growth; investment in 2023 is barely at 2019 levels. The result of these trends is a significant drop in net public wealth (mostly of the central government) since 2008. Funding exhibits a growing diversity. Investment spending is increasingly characterised by co-financing involving multiple actors, reducing the central-government share. The chapter concludes with an assessment of the sustainability of France’s public finances. The critical gap (g-r) remains positive for France even in the current environment of high inflation and increasing interest rates. We conclude, with some caution, that there is no real cause, in the medium run, for concern regarding sustainability.
2.1 The Historical Evolution of Public Investment
From the end of the 1940s until today, public investment in France has passed through different phases. After a long period of sustained growth during the 1960s (5% of GDP on average; see Figure 2.1), public investment remained at a relatively high level during the 1970s and 1980s (4.4% of GDP on average). The first break took place during the 1990s, a period during which priority was given to reducing the public deficit to meet the Maastricht criteria and join the euro. This resulted in an adjustment to public investment that, on average, fell below 4% of GDP from the mid-1990s to the beginning of the 2010s, when a second shock occurred. Following the sovereign-debt crisis, the fiscal stance changed, and a substantial part of the fiscal adjustment was achieved by reducing capital expenditure. Indeed, the reduction of public investment during that period has contributed to almost a third of fiscal consolidation even though investment represented only 6% of public expenditure. The share of public investment-to-GDP from 2014 to 2022 fell to 3.5 % on average and, during the period 2015–2018, reached its lowest level since 1952. A recovery in public investment began in the two years before the COVID-19 crisis, with an increase of nearly 14% between the end of 2017 and the end of 2019. This shift was linked to the electoral cycle of municipal elections and the government’s desire to preserve investment within the framework of the targeted budget contract with local communities.
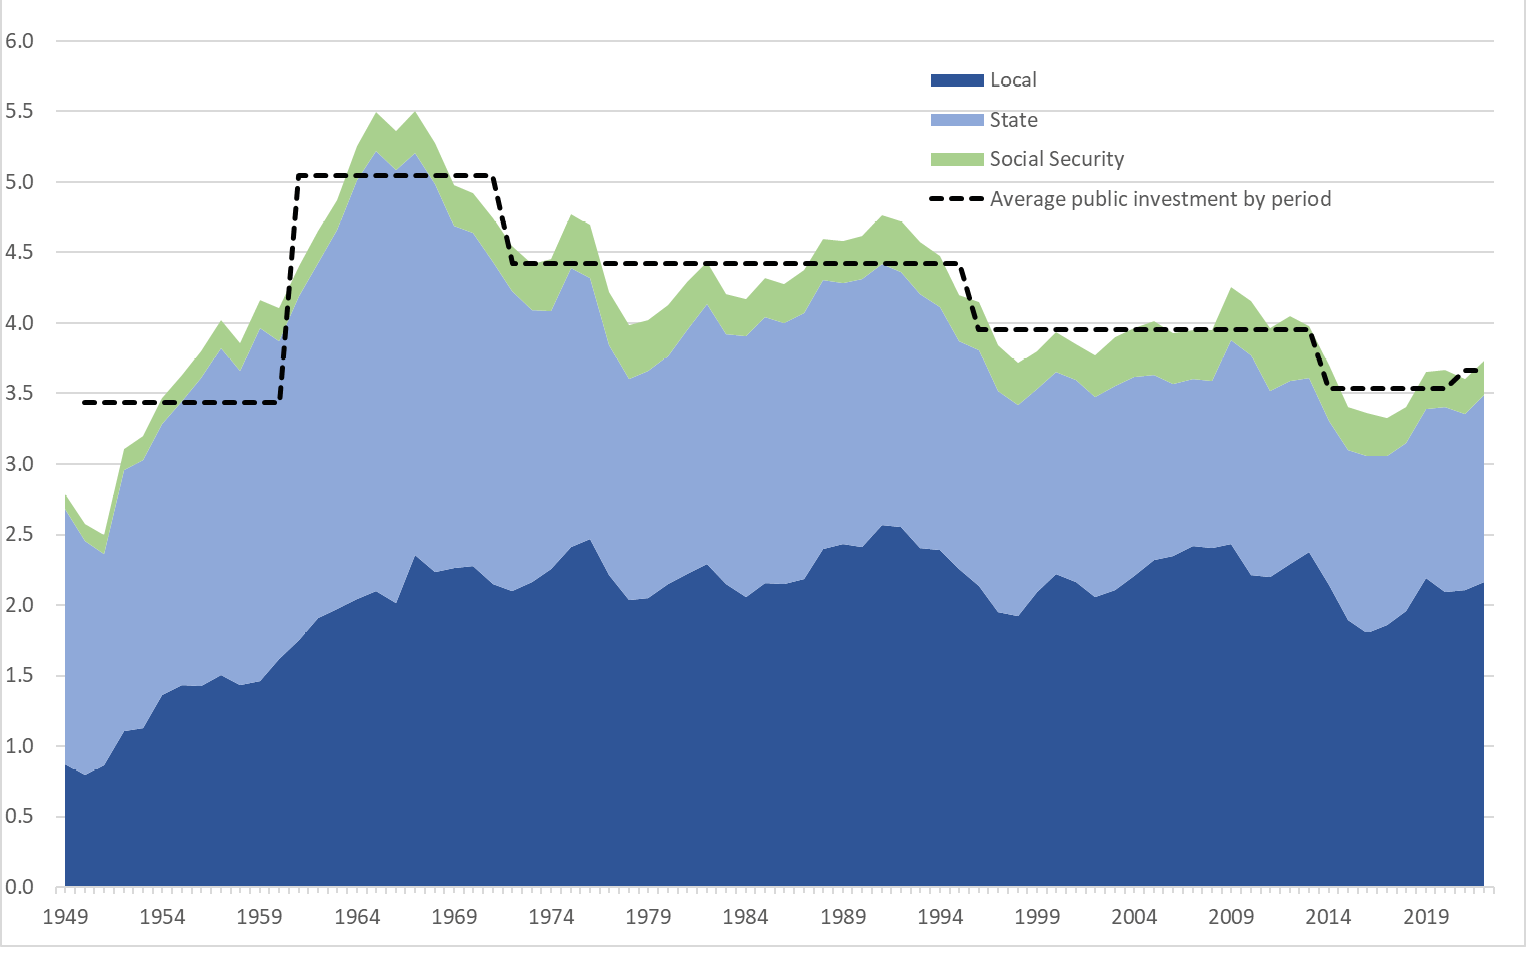
Fig. 2.1 Public Investment by Administrative Category, in % of GDP.
Source: Authors’ elaboration based on data from INSEE.
2.2 The Public-Investment Dynamics since the COVID Crisis
Because of the political cycle, a partial reversal in public investment was to be expected after the municipal elections of 2017. Nevertheless, the drop observed in 2020 is out of proportion with that observed in previous cycles and is a result of the pandemic. Indeed, the COVID-19 crisis (and the first lockdown) led to a drop of 15% in public investment in the first half of 2020. By comparison, the three strongest half-yearly decreases observed for the previous seventy years were between 5% and 6%.
From the second semester of 2020, however, public investment nearly returned to the pre-COVID-19 level (-3 % at the end of the year 2020 with respect to the end of 2019), despite the second lockdown in November and December 2020 (Figure 2.2). In addition, the government voted in September 2020 for a hundred-billion-euro recovery plan (‘Le Plan de Relance’, see Plane and Saraceno 2021), partially financed (40bn euros) with funding from Next Generation EU. The ‘Plan de Relance’ includes a section on public infrastructure, with particular emphasis on the thermal renovation of public buildings, with increased planned investment from the beginning of 2021. Moreover, a new investment plan, ‘Build the France of 2030’, was announced in October 2021. This latter plan is intended to meet long-term challenges, particularly ecological ones, through massive investment to help the technological champions of tomorrow to emerge and to support the transitions of French sectors of excellence: energy, automotive, aeronautics and even space. These plans, presented by President Macron, identify public investment as central to the revival and strengthening of the economy as well as to the meeting of major future challenges, first and foremost that of ecological transition.
Despite these major announcements, public investment has remained surprisingly flat. In fact, it was, at the midpoint of 2023, almost at the same level as at the end of 2020. Public investment, therefore, had not returned to its pre-crisis level (-1%), yet GDP is 1.7% above its pre-COVID level (Figure 2.2).

Fig. 2.2 Public Investment and GDP.
Note: 0 = 2019q4, in %, volume.
Source: Authors’ elaboration based on data from INSEE.
It is also important to note that, while public investment remains mainly the responsibility of local authorities (carrying out 58% in 2022), the post-COVID dynamic is more on the side of the central government. Today, its investment is at a higher level than 2019, while local authorities and Social Security, have not returned to their pre-crisis investment levels (see Figure 2.1). Indeed, part of the investment programmes resulting from the Recovery Plan or ‘France 2030’ are implemented by the central government, and not by local authorities.
2.3 Net Investment Increases but the Pace of Public-Capital Accumulation is Still Low
The assessment of gross investment needs to be complemented by the analysis of the net flow of fixed assets (net investment) to assess the dynamics of the capital stock (abstracting from the effects of revaluation of the existing stock). Thus, if gross investment is larger (smaller) than the depreciation of capital (consumption of fixed capital, CFC, in national-accounts nomenclature), then net investment increases (decreases), and the stock of capital increases (decreases).
From the late 1970s to the first half of the 1990s, France’s general government net investment was strong, averaging more than 1% of GDP per year (Figure 2.3). It even experienced a strong boom over the period 1987–1992, averaging above 1.4% of GDP per year. From 1993 to 1998, general government net investment declined sharply, reaching 0.5% of GDP in 1998, which amounted to a decrease of 1% of GDP over the space of six years. This, as was the case in other European countries, was mostly due to the effort to meet the Maastricht criteria in the run-up to the adoption of the euro: the cyclically adjusted deficit for France decreased from 4.6% of GDP in 1993 to 1.8% in 1998, and investment was the main adjustment variable. Net investment recovered in the next phase, then fluctuated between 0.7% and 0.9% of GDP over the 2000–2010 period, without ever returning to the level observed during the 1980s and the first half of the 1990s. Since 2011 and the Global Financial Crisis, net investment has been at its lowest level since the late 1970s, when wealth accounts were introduced.

Fig. 2.3 Net General Government Investment by Component as a % of GDP.
Source: Authors’ elaboration based on data from INSEE.
Thus, during the period 2014–2018, France spent about 0.7 percentage points (p.p.) of GDP (about €18bn per year in 2022 euros) less on net investment than it did during the period 2000–2010, and 1.4 p.p. (approximately €37bn per year in 2022 euros) less than during the period 1990–1992.
The picture that emerges from the analysis of stocks and flows is rather consistent and gives two main messages. The first is that, in France, public investment and the stock of capital have been largely affected by the macroeconomic cycle. In the two significant phases of fiscal consolidation―the run-up to adopting the euro in the 1990s and the aftermath of the sovereign debt crisis―investment was strongly reduced. Especially in the latter case, net investment turned negative to zero for all levels of government, thus reducing the stock of capital that, before the pandemic, was already at an all-time low. The second message that emerges, specifically from the analysis of stocks, is that, despite these trends in investment, the capital stock in France is still significant (and larger than in other countries). One might ask, then, if the effort of consolidation and the disproportionate burden that it has laid on public investment led, at least, to more sustainable public finances.
A comparison of the evolution over the last twenty years of non-financial assets’ net flows in relation to primary net financial flow (financial assets — financial liabilities — interest expenses), which we consider here as a proxy of the net worth, clearly reveals the emergence of two sub-periods. The first, which runs from 1996 to 2008, can be seen as a period in which the additional public net financial debt (excluding interest expense) was more than offset by the net accumulation of non-financial assets, leading to a positive net value. This means that the general government stock of wealth increased in value over this period, even abstracting from price effects. The second period, which runs from 2009 to 2022, displays a new pattern in which the net debt increase is no longer offset by an increase in public non-financial capital, generating a sharp deterioration in the government’s net worth. The economic and financial crisis has led to a sharp increase in public debt, and fiscal consolidation began to be implemented in 2011. On one hand, it partly reduced new financial commitments; on the other, it has been more than offset by a reduction in the net accumulation of non-financial assets. This is yet-further proof that the burden of fiscal consolidation was disproportionately laid on the shoulders of public investment. The sharp reduction in net worth, therefore, casts doubt on the effectiveness of fiscal consolidation in strengthening the public-finances outlook for France.
2.4 General Government Net Wealth: Still Positive but a Strong Decrease Since 2008
What is referred to as ‘public capital’ covers a wide variety of assets, such as land, residential buildings, ports, dams, and roads. It also includes intellectual property rights. It is necessary to break down the ‘wealth of the State’ into these different components to understand its dynamics, considering that price (most notably land price) and volume effects may play a significant role in explaining the evolution of the different components and of aggregate figures.
We use public data from the INSEE national accounts; our analysis covers the period 1978–2021. INSEE reports the consolidated level (general government) and its components, distinguishing between the central government, local governments, social-security administrations, and other government agencies.
In 2022, the consolidated public sector had a positive net wealth, despite the negative impact of the COVID-19 crisis (Table 2.1). Total assets held represented 167% of GDP, of which 103% was for non-financial assets. Financial liabilities totalled 134% of GDP. The net worth in 2022 was, therefore, 33% of GDP, around €12,700 per capita.
Table 2.1 Decomposition of General Government Net Wealth
|
As a % of GDP |
In euros per head |
|||
|
1978 |
2007 |
2022 |
2022 |
|
|
Non-financial assets |
60.8 |
90.4 |
102.9 |
39,920 |
|
Financial assets |
27.6 |
52.6 |
64.0 |
24,820 |
|
Financial liabilities |
33.7 |
84.9 |
134.2 |
52,040 |
|
Net worth |
54.7 |
58.1 |
32.8 |
12,700 |
Source: INSEE and authors’ calculations.
After reaching a record level in 2007 (58% of GDP), it has lost 25 points of GDP in the space of fifteen years. The reasons for this sharp drop are to be found on the net financial liabilities (debt) side, which increased substantially while non-financial assets increased slightly (see Figure 2.4).
This net worth is unevenly distributed among different levels of government. Indeed, it is very positive for local administrations (72% of GDP in 2022), very negative for the Central Government (-57% of GDP in 2022), and slightly positive for social-security administrations and other government agencies (8% and 10%, respectively). Broadly speaking, the central government―which runs recurrent public deficits ―has accumulated public debt; low-debt local governments hold non-financial assets, be they land, buildings, or civil-engineering works. With the economic and financial crisis from 2008 onwards, the net worth of the central government deteriorated considerably as public deficits and debt increased. On the other hand, the net worth of local governments remained high and relatively stable over the same period due to a stable value of non-financial assets and their debt.

Fig. 2.4 Evolution of General Government Net Wealth as a % of GDP.
Source: Authors’ creation based on data from INSEE.
2.5 Savings and Investment Financing: The Large Gap Between the Central Government and Local Authorities
Historical developments show the extent to which the budgetary situation between the Central Government and local authorities has decoupled since the 1990s. Self-financing, which represents the ratio between savings and investment, although less than 100%, was largely positive for the Central Government and local authorities until the beginning of the 1990s. The use of debt to finance investment was moderate. But the fiscal situation of the Central Government deteriorated markedly from the 1990s: systematically negative savings replaced the previous, largely positive situation (1.2% of GDP on average over the 1980s). Conversely, local authorities saw their savings increase significantly during the 1980s. These were less than 1% of GDP until the beginning of the 1980s. They rose to 2% of GDP on average from the 1990s and reached the historic high of 2.2% of GDP in 2022. With a self-financing rate close to 100% from the mid-1990s to the present, local authorities have had little recourse to debt to finance their investment (Figure 2.5). The public debt of local authorities has thus varied very little since the beginning of the 1980s, oscillating only between 7% and 10% of GDP over more than forty years. Conversely, the Central Government, no longer generating savings from the 1990s, had to resort to increased indebtedness to finance its investment, despite scaling back on its investment projects. The effect was a reduction by one-third, in points of GDP, between the investment level for the last ten years and that of the end of the 1980s-beginning of the 1990s (see Figure 2.1). The debt ratio of the Central Government (including the various central administration bodies) has risen from 26% of GDP in 1990 to 92% in 2022.

Fig. 2.5 Self-Financing Rate (Saving/Investment) by Administrative Category, in %.
Source: Authors’ creation based on data from INSEE.
2.6 How is Public Investment Financed in France?
2.6.1 Who Does What?
In France, as in many European countries, public investment is primarily managed by local public administrations, accounting for 55.6% of the total in 2020. This figure is in line with the average of 54.8% across the European Union. The central government of France contributed 36.9% to public investment in 2020, while social-security administrations (SSA) contributed 7.5%.
Within France, defence is the central government’s major focus for investment. It represents 71.1% of the expenditures from the general budget, according to the draft finance law for 2023. Other significant investment areas include the ‘Justice’ mission (5.9%) and the ‘Security’ mission (4.3%). State-operated entities, classified under central government in national accounts, predominantly invest in higher education. Local authorities, on the other hand, concentrate their investments on infrastructure, particularly in transportation and public facilities, including housing, water, and sanitation networks.
These investment priorities are, again, quite similar to other European countries. Defence and infrastructure (particularly transport and housing) constitute the majority of public investment, followed by health and education (see Ministère de l’économie et des finances 2023).
Due to their multi-year nature, investments are managed somewhat differently from other government expenditures. Categorizing these projects into commitment authorizations, multi-year appropriations, and annual payment appropriations is necessary to better anticipate future expenditure trends. This practice, customary for both the State and local authorities, was expanded to State-operated entities in 2012.
Since 2012, investment projects undertaken by the Central government, Social-Security Agencies, and other public actors are developed within a framework encompassing three tools:
- An inventory of ongoing investment projects and a preliminary socio-economic assessment. The annual inventory supplies both the State and Parliament with an overview of ongoing public-investment projects. The inventory is carried out by ministries. The quantity and quality of information submitted is increasing but variable. While this remains the case, caution is warranted when interpreting figures from the ministry-completed forms.
- The law mandates project leaders seeking State funding (or funding from related institutions) to conduct socio-economic assessments prior to application. The goal is to provide an objective analysis of costs and benefits for the community, thereby informing investment decisions.
- For large-scale projects, the legislation also mandates an independent second expert opinion on the evaluation report. This procedure applies to projects exceeding 100 million euros.
These tools are mainly administered by the General Secretariat for Investment (Secrétariat général pour l’investissement, SGPI), operating under the Prime Minister’s office to ensure coherence and oversight of the Government’s investment policy.
2.6.2 Co-financing is Becoming the Norm
This management approach, though diversified, elevates the complexity of directing and steering investment strategies. Furthermore, the State, in tasking its operators with project management, has a declining influence on total public investment. While the central government’s share in public investment has hovered between 35% and 40% since the late 1970s, the recent trend is for the growth of central government organisations (ODAC) and a reduction in the role of the Government itself.
Public-private partnership contracts are rarely utilized due to their commercial project requirement and restrictive administrative procedures. Most of financing happens through standard public-procurement procedures.
Funding structures, on the other hand, exhibit a growing diversity, concurrently reducing the Central government and its affiliated institutions’ share in the total amount. Investment spending is increasingly characterised by co-financing involving multiple actors. Today, only a few major public projects are fully financed by the State, an operator, or a local authority. Each project has, on average, three co-financiers; consortia exceeding four members is common in real estate, higher education and research, and transport projects (Ministère de l’économie et des finances 2023). Notably, local and regional authorities, particularly regions, emerge as primary co-financiers. Furthermore, many public investment projects tap into European funding sources, such as the European Union or the European Investment Bank. Involvement of various stakeholders is necessitated by the substantial financial scale of these projects.
An important role is also played by the Caisse des Dépôts et des Consignations (CDC), the French National Public bank that manages the guaranteed savings by French households (‘Livret A’) and the pension funds of public actors, including central and local government and public corporations. The role of Public Investment Banks is analysed in Chapter 7 of this volume. Here, it is enough to say that the CDC finances public investment in, primarily, two missions. The first concerns the financing of social housing. Via the ‘Livret A’ savings account, the CDC collects funds, which it then lends to social-housing organisations. Its second mission is to support investment policies in territories: the organisation finances transportation-infrastructure projects and provides expertise on projects initiated by local communities. Since the launch of Next Generation EU, the CDC has also become involved in investment in green and digital transitions.1
2.7 Is French Public Debt Sustainable?
As the net worth of the French government has shrunk significantly in recent years, it is legitimate to ask whether public finances are still sustainable. The answer to this question is, with some caution and qualification, yes. Since the early 1990s, nominal interest rates have fallen significantly in almost all advanced economies, and more than inflation. The result is a decline in real rates, which has helped ease the debt burden. The apparent rate, the ratio of interest expenditure to public debt, has also declined despite a significant increase in the debt-to-GDP ratio. Figure 2.6 shows the case of France, but similar trends are seen elsewhere, in ‘virtuous’ countries as well as in those where public finances are most fragile, such as Italy.

Fig. 2.6 Interest Rates and Public Debt, France.
Source: Authors’ creation based on data from INSEE.
Recent literature has examined this long-term trend to try not only to understand the reasons for it but also to predict its future persistence. In a standard theoretical framework, the so-called ‘natural’ interest rate is that which leads to the balance between savings and investment at the level corresponding to the full utilisation of productive capacity; that is, it is the interest rate that neither stimulates nor depresses growth. This rate, which must be estimated, also dropped significantly over time. The analytical chapter of the most recent issue of the IMF World Economic Outlook (WEO) gives estimates for the natural rate that are close to zero for the largest world economies, and even slightly below zero for France and Japan (IMF 2023, p. 49).
Broadly speaking, a long-run downward trend in natural rates indicates a situation of chronic excess saving (which, in fact, describes a shortage of aggregate demand). What are the reasons for this chronic excess of savings? Since the late 1980s, and even more so since the early years of this century, global savings have increased dramatically. The reasons for this increase are multiple, from the recent increase in uncertainty and financial instability to the aging of the population, the increase in inequality, and the increase in private debt. In advanced economies, this increase in savings has been accompanied by a significant reduction in investment. Public investment, of course; but also, to an almost-equal extent, private investment. The decline of the latter is explained by the slowdown in productivity (France may be an exception in this, as, contrary to other countries, its decline of productivity is not matched by a strong decrease of private investment), the financial fragility of companies, and a general uncertainty that has compressed the ‘animal spirits’. Platzer and Peruffo (2022) try to disentangle these factors for the United States and find that the slowdown in total factor productivity growth is the most important driver of the drop in the natural rate of interest, with demographics (a decline in fertility and a rise in life-expectancy) and inequality that are the second and third most important factors respectively.
To be sure, the decline in investment occurred only in advanced economies and, overall, it was offset by the boom in emerging market and low-income economies. However, the savings of the latter, in a search for ‘safe assets’, flowed into the financial markets of advanced economies, contributing to the widening gap with investment and the deflationary trend that central banks have been facing for at least a decade.
From 2021, we seem to be living in a new world. Supply-side difficulties (bottlenecks, rising production costs, geopolitical tensions, and the war in Ukraine) have led to scarcities in many sectors and slowly percolated to the whole economy. These challenges on the supply side of the economy have been compounded for some countries (such as the USA) by a strong increase in demand following the pandemic. In France, this demand boost has been relatively weak, with consumption still below its pre-pandemic levels and the savings rate still 3 p.p. higher than its 2019 level.
With inflation at levels not seen since the 1970s and growth that remains subdued overall, some have argued that secular stagnation is poised to become a thing of the past again, replaced by ‘stagflation’. In fact, the risk of a 1970s-type stagflation is non-existent: Corsello et al. (2023) show how institutional differences (wage indexation and the independence of central banks) play a crucial role in explaining why the 2020s are not the 1970s. Nevertheless, and regardless of the risk of a repeat of the 1970s, the question remains: can we put secular stagnation behind us? Some elements might lead us to think so: it is certain that the organisation of production processes and the sectoral distribution of activity that will emerge at the end of this process will be quite different from those we are used to and that, for certain goods and sectors (think fossil fuels), prices are destined to remain permanently high. Furthermore, it is possible that the colossal investments necessary for the ecological and digital transition will support economic activity for decades to come. A recent report by France Strategie (Pisani-Ferry and Mahfouz 2023) details possible green-transition scenarios for France and lends some support to the view that inflationary pressures might build up between now and 2030.2 It quantifies, in 2 points of GDP, the yearly additional investment needs for the French economy to stay in line with the ‘Fit for 55’ EU targets; it also notices that this additional investment, while boosting demand, might reduce potential GDP in the short-to-medium run, that is, until 2030.3 Furthermore, managing the transition (and ensuring a fair distribution of its costs) will likely involve higher energy prices―again, in the next decade or so―and higher public debt (in the order of 10 additional points from now to 2030, and of 25 points at the 2050 horizon). All this will lead to higher and possibly more volatile inflation in the next decade.
While the factors just mentioned may lead to think that secular stagnation is past us, almost all the reasons for the compression of consumption and investment that led Gordon (2016) and Summers (2016) to revive the concept of secular stagnation are still having an effect. It is even possible that these will play a larger-than-ever role in the future. Demographic factors and persisting high inequality will continue to push up savings. More flexible and precarious labour markets and an increasing debt burden (both public and private) will also likely have an influence on the savings rate. Last but not least, macroeconomic and geopolitical uncertainty will reduce the propensity to invest (especially in long-term projects) and feed precautionary savings. It is true, on the other hand, that geopolitical uncertainty could lead to a greater propensity to hold safe assets (thus pushing up demand for government bonds) and to make new public investment in previously neglected sectors, such as defence, thus contrasting the tendency towards secular stagnation.
While it is not possible to forecast which of these forces will prevail, it seems unlikely that the huge investments needed to set our economies on the path of ecological and digital transition will be sufficient to compensate for secular structural trends such as aging, rising inequality, uncertainty, and geopolitical instability. It is, therefore, reasonable to think that these forces will again dominate in the medium term and that policy makers will return in a few years to struggle with secular stagnation and deflationary pressures. This is a point also made by Blanchard (2023) and by the already-quoted WEO chapter (IMF 2023). The latter argues that, once the inflationary episode is over, we will return to an era of low interest rates; advanced countries will continue to suffer from reduced productivity growth and population aging, and emerging countries will see a similar situation as the dynamics of their economies catch up and converge with those of richer countries.
This has, of course, strong implications for debt sustainability―globally and for France. If interest rates are bound to remain sufficiently low, then fiscal space will be enhanced even with modest growth rates. In fact, by looking at the past, the growth-interest differential remained positive for most of the past decade (see Figure 2.7).

Fig. 2.7 The Critical Gap (g-r) for France.
Source: Authors’ creation based on data from INSEE.
If this keeps being the case in the medium-term future, sustained investment may be compatible with a stabilization or even with a moderate reduction of public debt.
References
Blanchard, O. J. (2023) ‘Secular Stagnation Is Not Over’, PIIE Realtime Economics Blog January 24, https://www.piie.com/blogs/realtime-economics/secular-stagnation-not-over
Corsello, F., M. Gomellini, and D. Pellegrino (2023) ‘Inflation and Energy Price Shocks: Lessons from the 1970s’, Banca d’Italia Occasional Paper. 709 (July)
Draghi, M. (2012) ‘Speech at the Global Investment Conference in London’, ECB (26 July)
Gordon, R. J. (2016) The Rise and Fall of American Growth: The U.S. Standard of Living since the Civil War. The Princeton Economic History of the Western World. Princeton University Press
IMF (2023) ‘The Natural Rate of Interest: Drivers and Implications for Policy’, chapter 2 of World Economic Outlook. A Rocky Recovery. pp. 45–68. Washington DC : International Monetary Fund
Ministère de l’économie et des finances (2023) ‘Évaluation Des Grands Projets d’investissements Publics’, Annèxe Au Projet de Loi de Finances Pour 2023
Pisani-Ferry, J. and S. Mahfouz (2023) ‘Les Incidences Économiques de l’action Pour Le Climat’, France Strategie, Rapport à La Première Ministre (Mai)
Plane, M. and F. Saraceno (2021) ‘From Fiscal Consolidation to the Plan de Relance’, in F. Cerniglia et al. (eds), The Great Reset―2021 European Public Investment Outlook. Cambridge, UK: Open Book Publishers, https://doi.org/10.11647/OBP.0280
Platzer, J. and M. Peruffo (2022) ‘Secular Drivers of the Natural Rate of Interest in the United States: A Quantitative Evaluation’, IMF Working Papers 2022 (030)
Summers, L. H. (2016) ‘The Age of Secular Stagnation. What It Is and What to Do About It’, Foreign Policy (March/April), https://www.foreignaffairs.com/articles/united-states/2016-02-15/age-secular-stagnation
1 The CDC has third mission which is to support businesses. It invests directly in companies to foster their development, but it also focuses on helping to secure financing for businesses or activities that would otherwise struggle, such as export financing for SMEs or financing for social and solidarity economy enterprises. To achieve this, it utilizes its subsidiary jointly established with the government: BPI France (Banque Publique d’Investissement).
2 Chapter 7 of the report details the sectoral-investment needs and quantifies them in 100 billion euros yearly of additional green investment, of which almost 90% is in transportation (€32bn) and housing (€54bn). If we net these numbers with the reduction in brown investment, the total is €66bn; transportation evens out, while, in housing, the lower brown investment is negligible.
3 The ecological transition will require mostly capital substitution with the objective not of increasing productivity but of greening production.