5. Public Investment, Deficit and Public Debt in Spain, 1995–2022
© 2023 Francisco Pérez and Eva Benages, CC BY-NC 4.0 https://doi.org/10.11647/OBP.0386.05
Over the past three decades, public investment in Spain has followed an extremely irregular trajectory, with periods of significant capital accumulation and others in which net investment has been negative. The sustainability of the pace of investment has been challenged by expenditure policies that are procyclical instead of stabilizing, in addition to fiscal regulations that have not been able to improve public-productive capital by following the golden rule. The revision of the EU’s economic-governance framework should take into account this and other experiences to enhance the compatibility between fiscal rules and the expanded investment envisaged by the Recovery and Resilience Mechanism.
5.1 Introduction
Since the Maastricht Treaty came into force in 1993, Spain’s public investment has gone through very different stages. The causes for these shifts are many. They include the changing overall conditions experienced by the Spanish economy, the scant attention given by spending policies to stabilization and sustainability objectives, the challenges of public-sector financing since the Great Recession, and the fiscal framework established by the Stability and Growth Pact (SGP) in 1997 and its subsequent revisions.
Member States have presented objections to the SGP. The first concerns its design, which gives prominence to the output gap, even though this variable is not observable and is subject to debate due to its dependence on the estimation criteria. The second objection concerns Member States’ limited compliance with fiscal rules and the lack of consequences for non-compliance, leading to a decline in the Pact’s credibility. The third relates to the framework’s complexity, which raises questions about both its political acceptability and the European Commission’s discretionary application of its rules (2022).
Warnings concerning the poor de facto safeguards for public investment in the EU fiscal-policy framework have increased since 2019 (European Fiscal Board 2019; Darvas and Anderson 2020), despite the loosening of deficit restrictions for that purpose. In October 2021, the European Commission relaunched the public debate on the review of the EU’s economic-governance framework, and, in December 2022, it presented a communication about its reform (European Commission 2022) to the European Parliament, the European Central Bank (ECB), the European Economic and Social Committee, and the Committee of the Regions. This communication proposed a framework to address the financing of a green and digital transition towards a climate-neutral economy and to solve the issue of the high public debt-to-GDP ratios reached in the first decades of the twenty-first century. Both challenges require fiscal regulations that enable strategic investments and also protect the viability of fiscal policy.
This reformed approach requires closer attention to the trajectory of public investment than in the past because, while capital formation in the EU as a whole has not suffered significantly over the last three decades, some countries, such as Spain, have seen an important reduction in net investment since 2010. As a result, the public-capital growth rate has been cut in half.
These circumstances raise the question of whether the criteria for calculating the deficit that can be financed with debt should expressly contemplate a golden rule that protects net investment, given that the European Recovery and Resilience Strategy is committed to strengthening investments for the ecological transition; the digital transformation; smart, sustainable, and inclusive growth; social and territorial cohesion; social and institutional health and resilience; and policies for the next generation, children, and youth. It is a strategy that also contemplates investment needs for both tangible and intangible assets.
This chapter argues for an approach to deficit policy in line with the criteria of the golden rule by examining the trajectory of investment and of public-capital stock in Spain between 1995 and 2022. It also reviews the challenges of financing public investment in the context of high fiscal deficits since the onset of the Great Recession.
5.2 The Trajectory of Public Investment in Spain, 1995–2022
After becoming a member of the EU in 1986, Spain implemented a rigorous public investment strategy that was supported, in large part, by European structural funds. Much of this strategy coincided with the Spanish economic expansion between 1995 and 2008; it was fuelled by a powerful real-estate bubble. Figure 5.1 shows that, up until the onset of the financial crisis, public investment doubled in real terms, growing more than GDP. It also shows a sharp fall thereafter.
|
a) €m 2015 |
b) Real Evolution of GDP and Public Investment, 1995=100 |
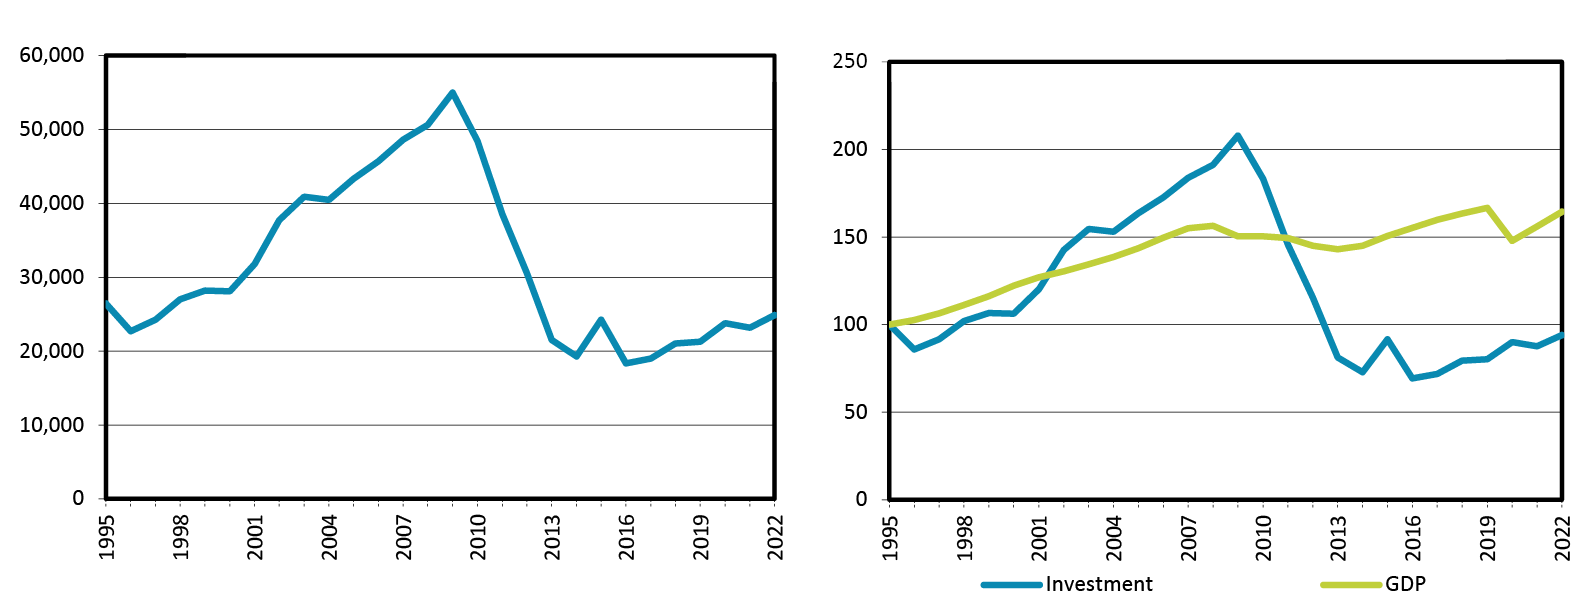
Fig. 5.1 Public Investment in Spain, 1995–2022.
Note: Public investment includes investments made by external agents in infrastructures for public use (ADIF, AENA, State Ports, etc.).
Source: BBVA Foundation-Ivie (2023), INE (CNE), and authors’ elaboration.
The pronounced procyclicality of the trajectory of gross-public capital formation shows that these expenditures have not been sustainable and have in no way contributed to stability. Instead, they have reinforced growth throughout the expansionary phase and accentuated the recession in the most difficult period of the crisis. Despite the recovery experienced in the last five years, gross public investment in Spain remains at lower real levels than in the initial years of the series, being 6% lower in 2022 that in 1995.
The investment effort of the initial long expansionary phase is mostly concentrated in productive infrastructures, mainly transport-related (particularly high-speed railroads). Gross public-capital formation in social infrastructures (educational, health, cultural, social services, administrative, etc.) is also highly important (Figure 5.2). Investment increased by two between 1995 and 2009 in both aggregates, but when the crisis struck, the decline in transport infrastructure was greater and more severe. The recent recovery has focused mainly on social infrastructure, which has returned to its 1995 levels, while productive or transport infrastructure is still 20% below its 1995 level.
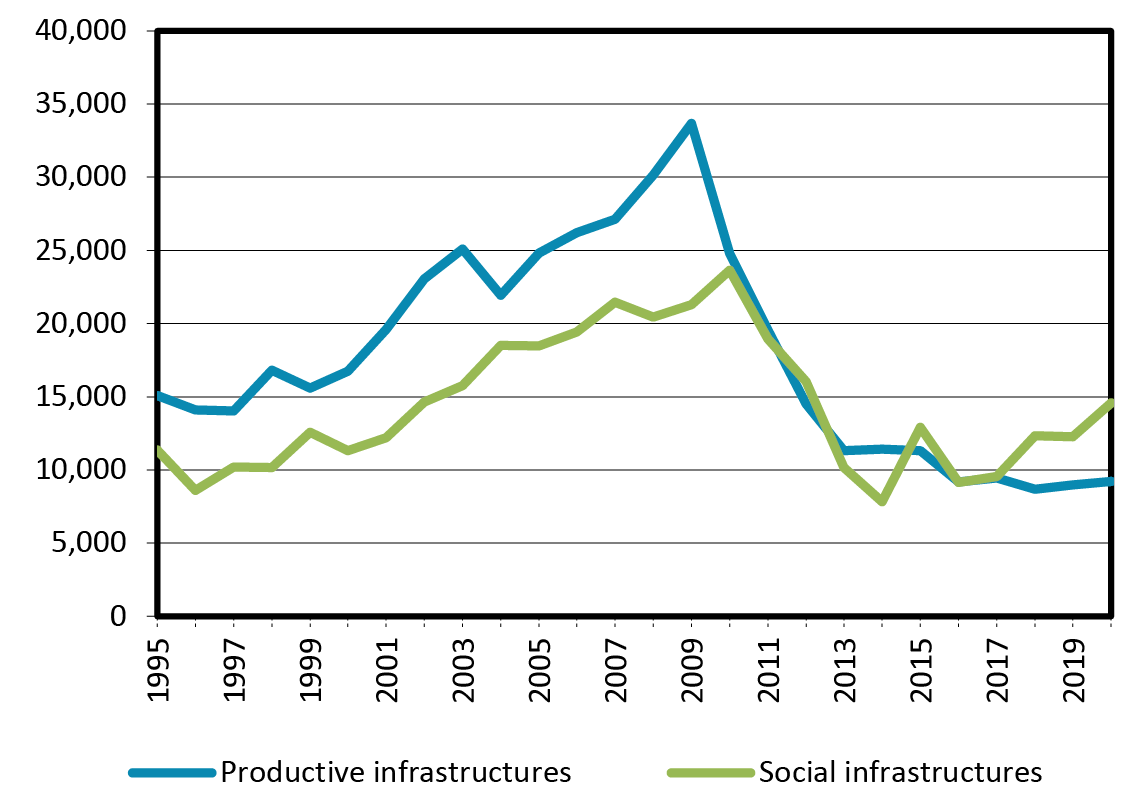
Fig. 5.2 Public Investment in Productive and Social Infrastructures in Spain, 1995–2020, in €m 2015.
Note: Public investment includes investments made by external agents in infrastructures for public use (ADIF, AENA, State Ports, etc.).
Source: BBVA Foundation-Ivie (2023) and authors’ elaboration.
5.3 From Investment to Capital Accumulation
The data on the trajectory of the public fixed capital stock allows us to determine how much of gross investment is absorbed to cover the depreciation of existing public capital and what part of net investment produces changes in capital stock.1
The rapid investment pace between 1995 and 2012 implies an increase in stock of 87%, largely concentrated in productive infrastructure (mainly transport2), which grew by 93%. Although public investment increased during the first two years of the Great Recession, from 2010 onwards it does not even cover the depreciation of the existing stock, which decreased by 5% since then (Figure 5.3).
The part of gross investment that is absorbed by capital accumulation amortizations is always significant (Figure 5.4). In the period of greatest investment effort, consumption of fixed capital represents around 50% of gross investment and the other half represents net investment, that is, that which constitutes stock growth. However, when gross investment fell sharply with the onset of the crisis, consumption of fixed capital represented more than 100%, making net investment negative from 2013 onwards and reducing the stock of public capital.
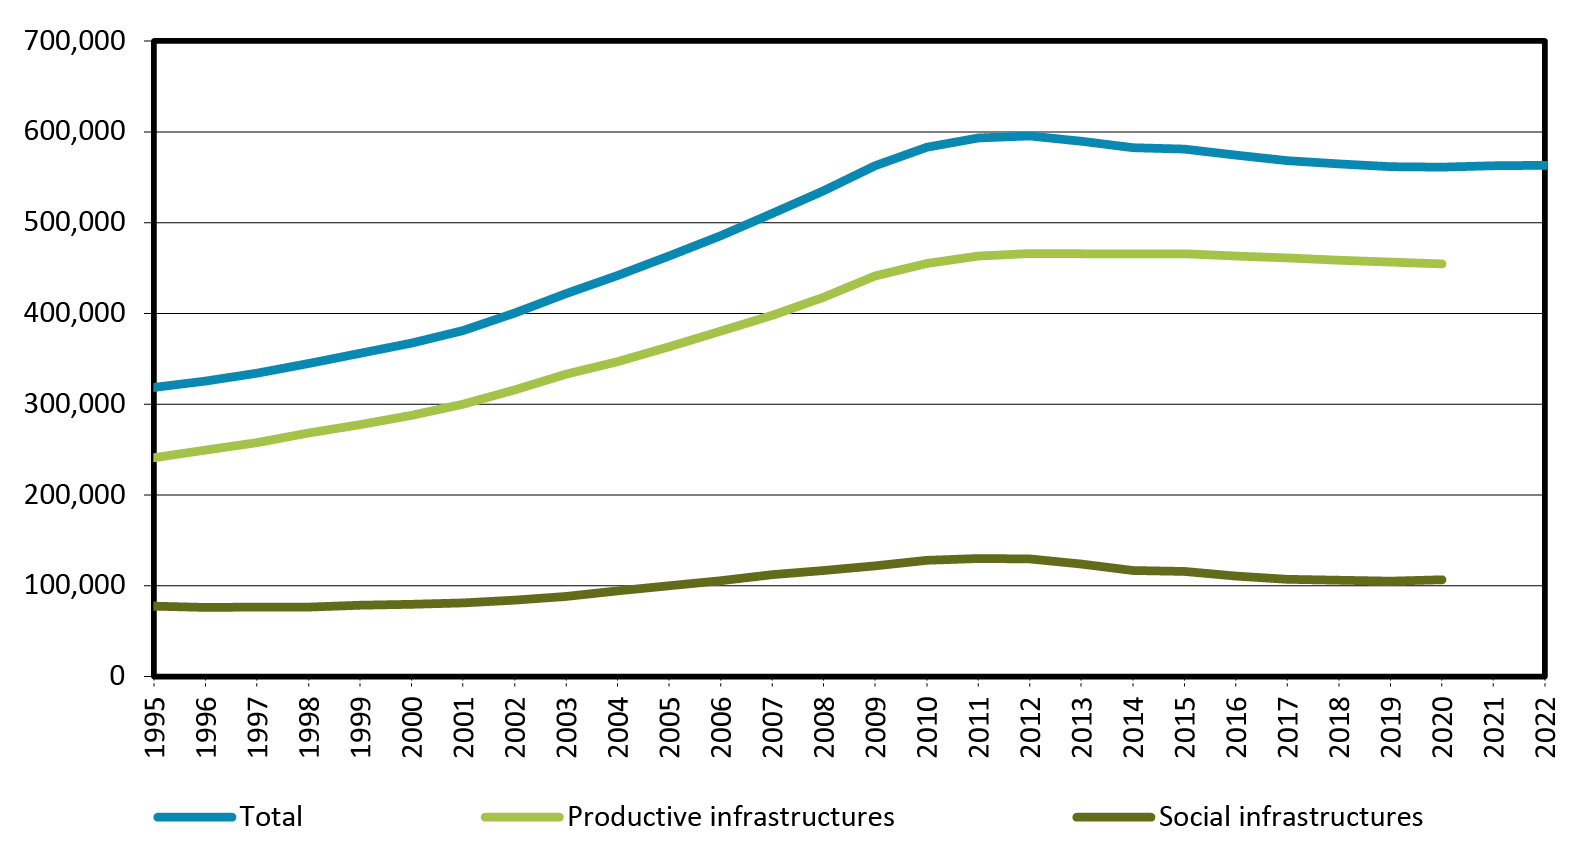
Fig. 5.3 Evolution of Public Capital Stock in Spain, 1995–2022, in €m 2015.
Note: Public capital includes privately owned infrastructures for public use (ADIF, AENA, State Ports, etc.).
Source: BBVA Foundation-Ivie (2023), INE (CNE), and authors’ elaboration.
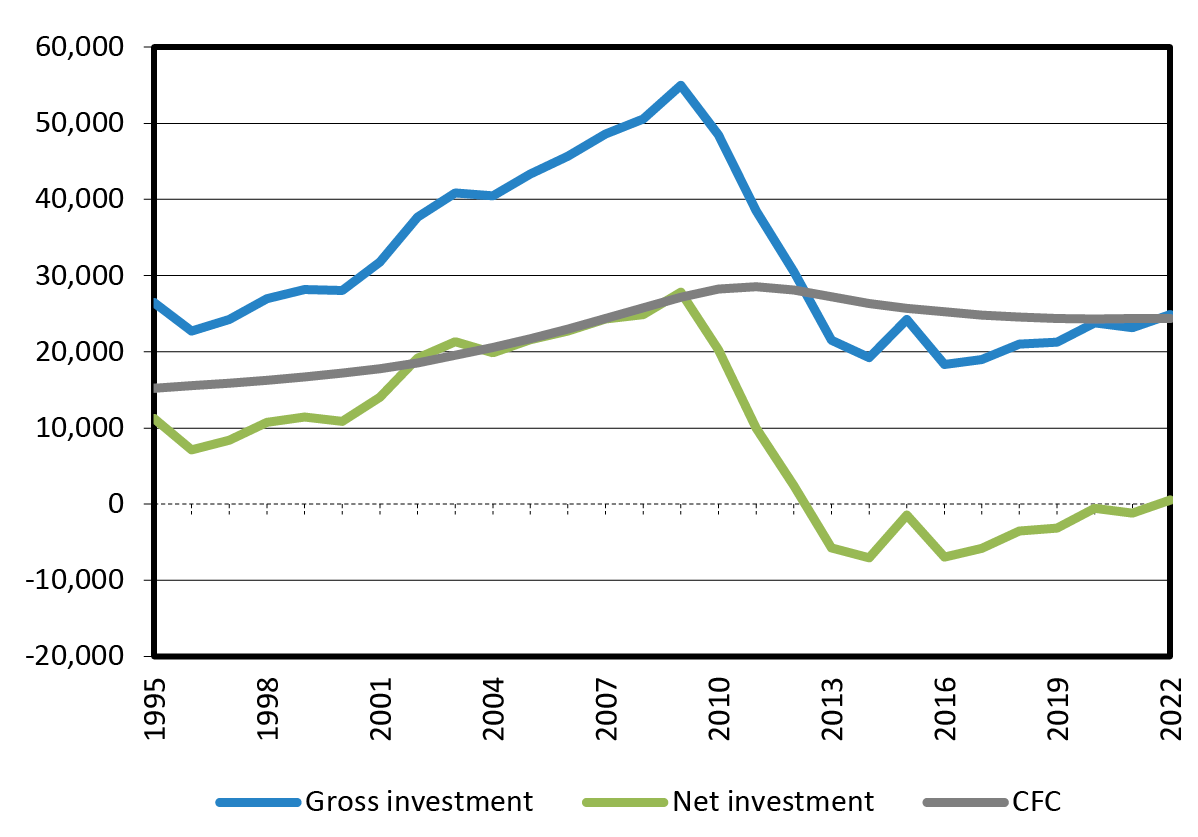
Fig. 5.4 Gross Public Investment, Net Investment, and Consumption of Fixed Capital in Spain, 1995–2022, in €m 2015.
Note: Public investment includes investments made by external agents in infrastructures for public use (ADIF, AENA, State Ports, etc.).
Source: BBVA Foundation-Ivie (2023) and authors’ elaboration.
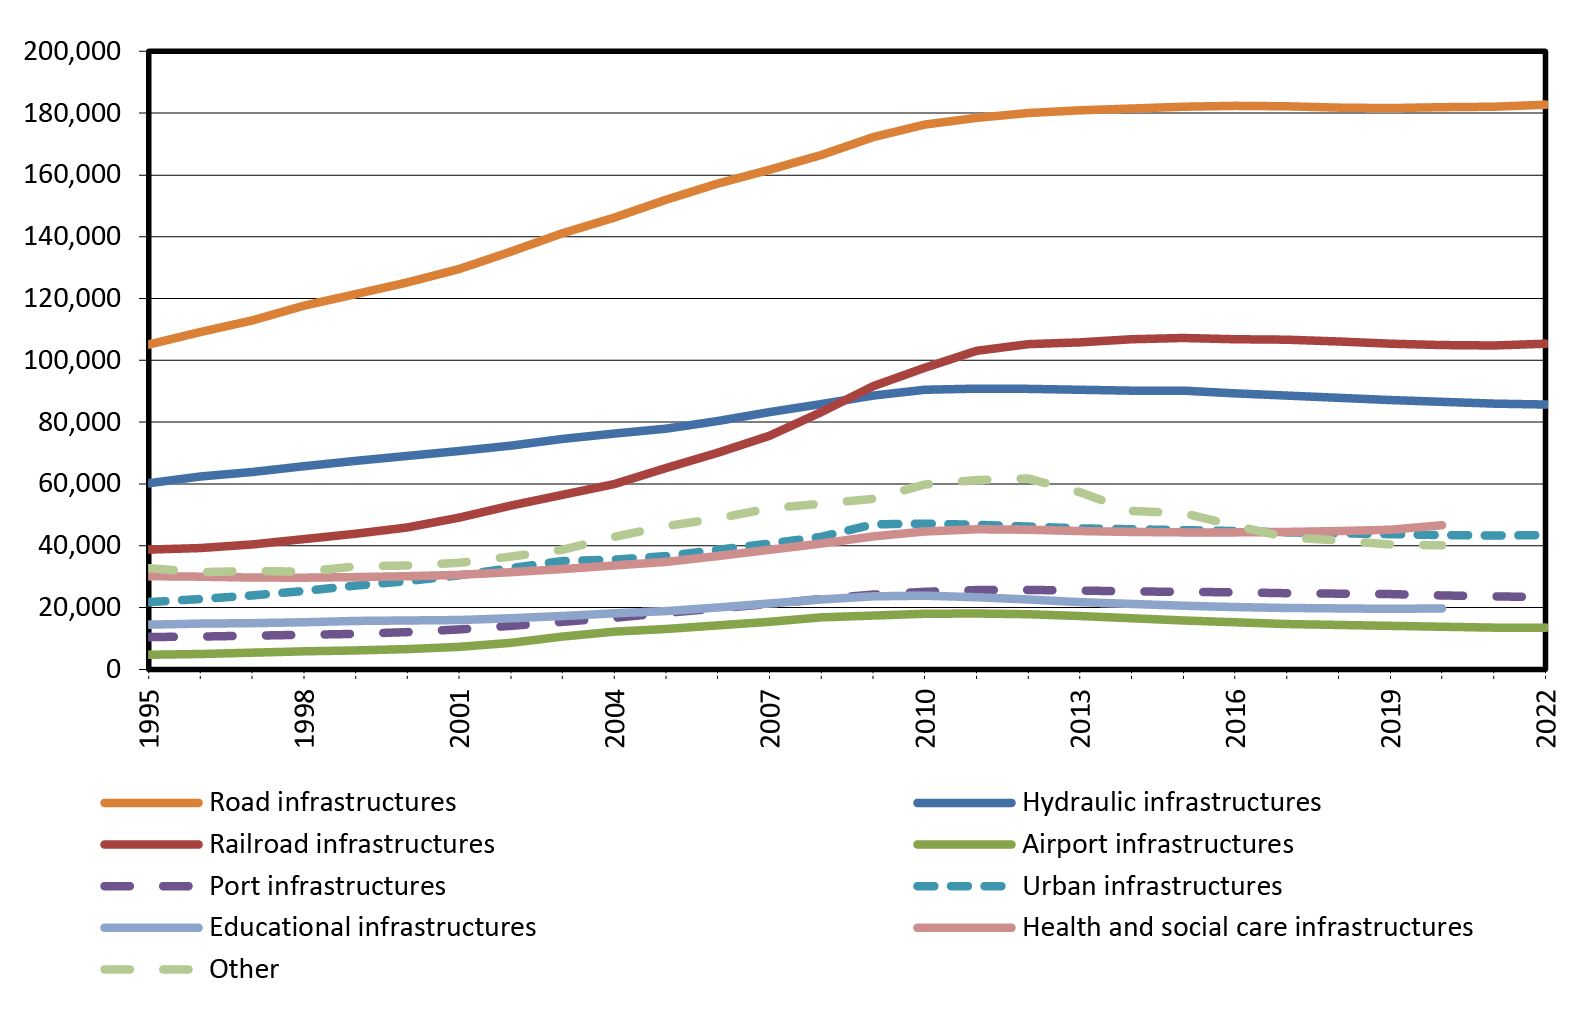
Fig. 5.5 Evolution of Public Capital Stock in Spain by Type of Asset, 1995–2022, in €m 2015.
Note: Public capital includes privately owned infrastructures for public use (ADIF, AENA, State Ports, etc.).
Source: BBVA Foundation-Ivie (2023) and authors’ elaboration.
Figure 5.5 shows that all assets experienced a significant growth in the expansionary phase. When the crisis hit, accumulation stagnated, at least in all of them, and even fell significantly in some cases. Among the assets that failed to cover replacement, the ones that stand out are port and airport infrastructures, educational and social services infrastructures, with cumulative declines of over 9% from 2012 to present.
The gross capital formation of Spain’s public sector has been so irregular that, during the past decade, it has not been possible to maintain the accumulated public capital. Since then, the consumption of fixed capital has absorbed all the gross investment and, because net investment has been negative, the capital stock has aged.3 The question that arises here is: what factors led to the decline in public investment following the Great Recession?
5.4 Investment and Public Deficit Financing
The drop in gross public capital formation in Spain during the Great Recession and subsequent years was mainly attributable to the spending cuts that the central, regional, and local government were forced to implement in order to limit the strong fiscal imbalances that emerged after 2008. The administrations had to make significant adjustments in many of their expenditures. These changes had a greater impact on investment as a result of the Stability and Growth Pact and the non-accommodative monetary policy that implied sharp increases in the cost of financing and the risk premium.
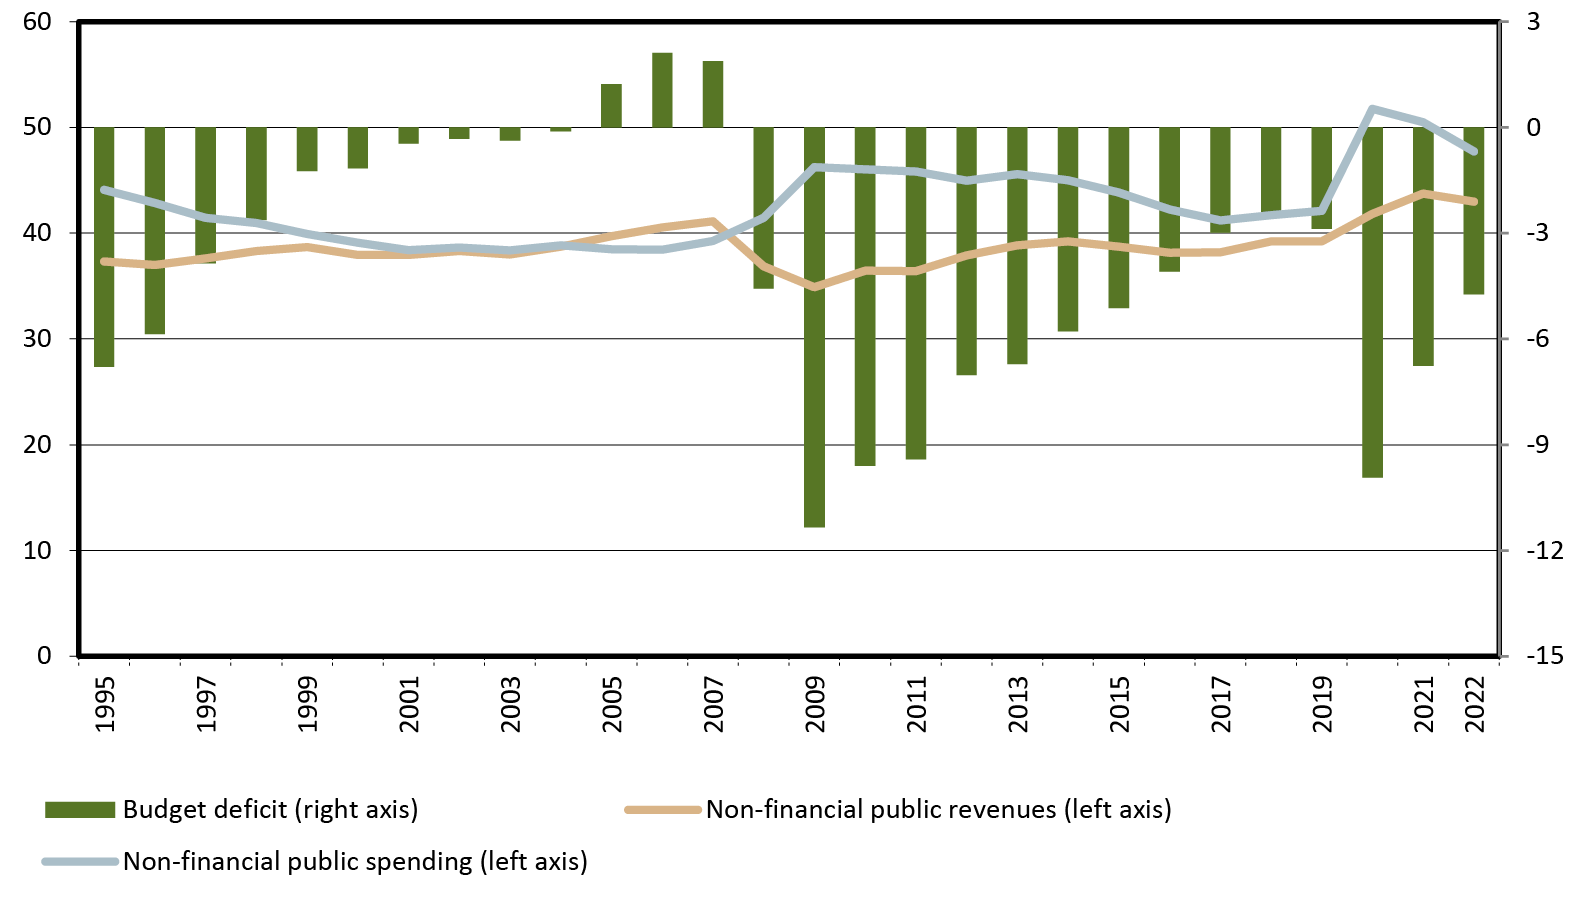
Fig. 5.6 Government Spending, Revenues, and Budget Deficit in Spain, 1995–2022 (% of GDP).
Note: Net public spending and net public revenues of aids to financial institutions have been considered.
Source: IGAE (2023a) and authors’ elaboration.
Figure 5.6 shows that, during the expansionary phase that preceded the financial crisis, public revenues and expenditures followed converging paths that reduced the deficit and allowed for the achievement of budget surpluses between 2006 and 2008. However, the combination of a sharp fall in tax revenues in 2008 and 2009, which was much higher than in other European countries, along with the delayed recognition of the change in scenario on the expenditure side, led to immediate increases in the deficit, pushing it to unsustainable levels close to 10% of GDP in 2009. It remained above 6% until 2013.
A direct result of the evolution of the public deficit is the trajectory of the debt throughout the period analysed. In the initial period from 1995 to 2007, when the deficit was controlled and GDP grew rapidly, the debt-to-GDP ratio significantly decreased, reaching 35.7% in 2007. During the years of the Great Recession—of strong deficit and also falling GDP—the ratio soared to reach 105% in 2014. The recovery of growth from that year until 2019 and the efforts to contain the deficit interrupt the rising trajectory of the debt-to-GDP ratio. However, the COVID-19 crisis pushed the ratio up again, to a peak of 120.4% in 2020. The indicator remains at very high levels since then (113.2% in 2022) (Figure 5.7).
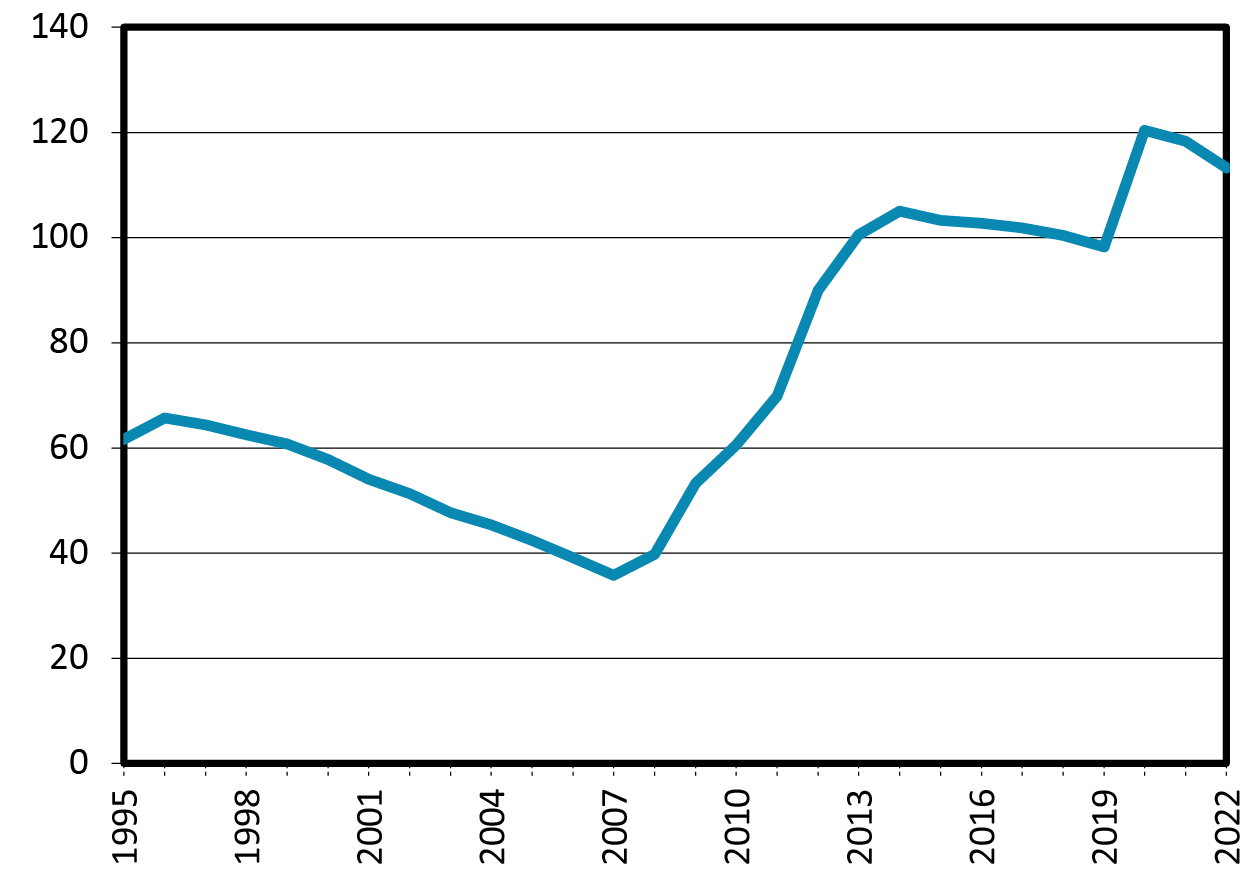
Fig. 5.7 Public Debt in Spain, 1995–2022 (% of GDP).
Source: Bank of Spain (2023).
Thus, despite measures to boost tax collection and reduce spending, efforts to reduce the deficit have not prevented a sharp increase in debt. Tax revenues began to improve as a result of various tax increases and thanks to the recovery of growth from 2014 onwards. Adjustments affected all levels of government but not all spending functions. Social protection was an important exception: there was an increase in spending on unemployment benefits and pensions, both of which are controlled by the central government. Other important social expenditures, such as education and health care, which are decentralized to regional governments in Spain, did experience a decrease.
As seen in Figure 5.8, total public spending stagnated between 2009 and 2017; public investment spending, meanwhile, which had been previously high, fell sharply from 2010 onwards. It remained at levels below those of 1995, despite a minor increase since 2016. With the arrival of the pandemic, public investment increased as a consequence of the different responses given by the EU to the new crisis. This has allowed Spain to rely on significant resources and funding from the Recovery and Resilience Mechanism (RRM) from 2020 onwards.
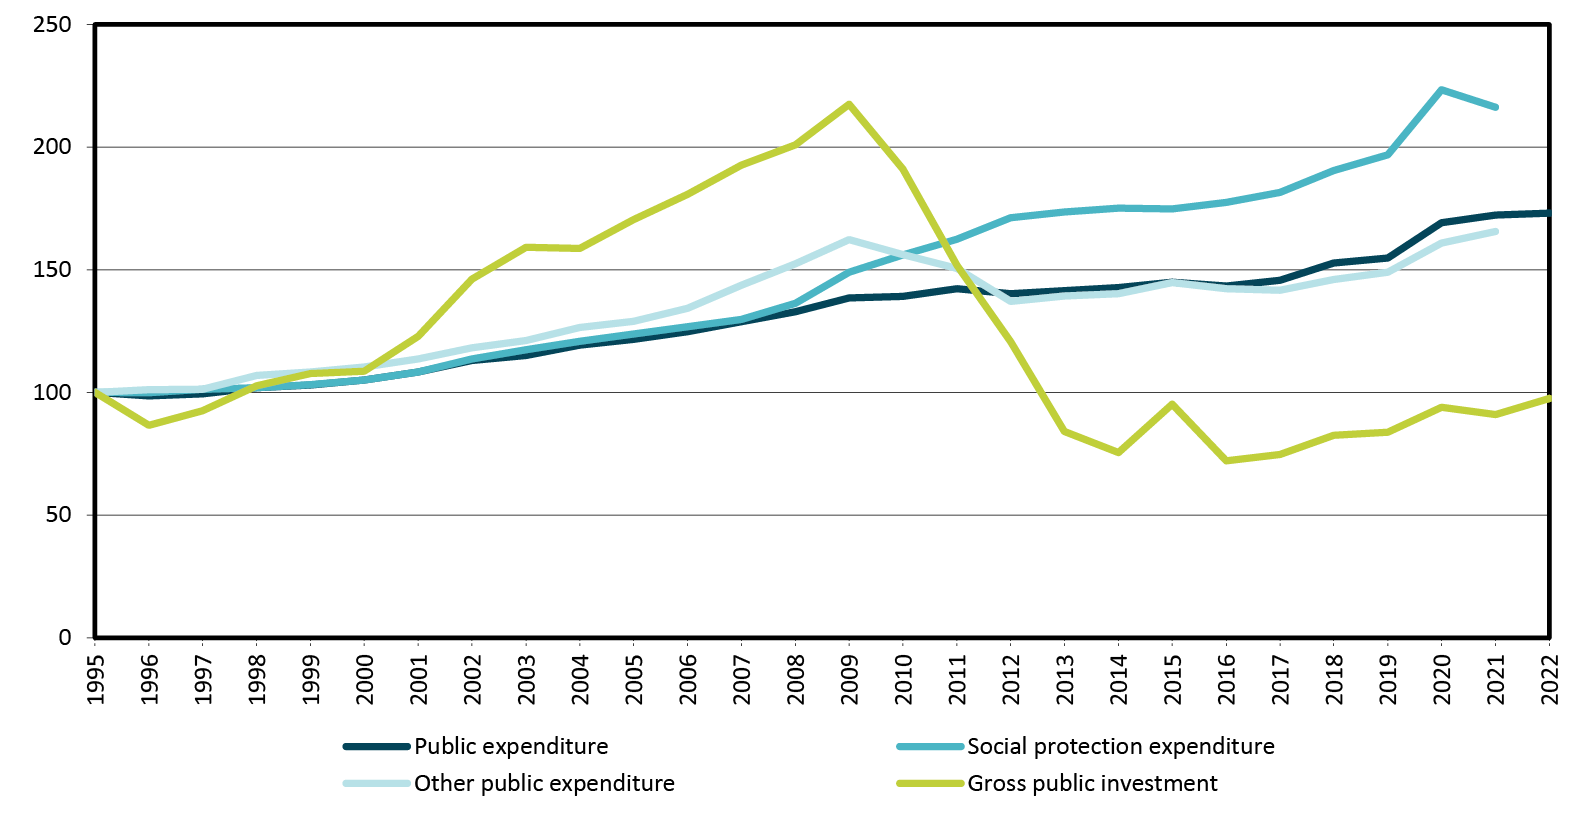
Fig. 5.8 Real Public Spending and Gross Investment in Spain, 1995–2022 (1995=100).
Note: Net public spending of aid to financial institutions has been considered. Public investment includes investments made by external agents (ADIF, AENA, etc.).
Source: BBVA Foundation-Ivie (2023), IGAE (2023a, 2023b), INE (CNE), and authors’ elaboration.
The decline in public investment during the Great Recession and its subsequent stagnation was, de facto, a key tool for deficit control. The cost of this is that investment was not protected when deficit surged with the start of the financial crisis. The public sector faces the challenges of reducing many expenditures, particularly monetary transfers associated with social protection, and adjustments are much more intensely directed towards investment because they do not involve intense tensions with social groups involving pensions, education or healthcare recipients.
Figure 5.9 illustrates how important these reductions in gross investment have been in containing the deficit. It represents the ratio between the annual deficit and the adjustment made in investment (the difference between each year’s investment and 2008 gross investment). When investment adjustments began to be made in 2010, their contribution to deficit control was modest, but this grew as investment remained low and the deficit was gradually reduced. The investment adjustment is equal to 100% of the deficit in 2018. In other words, the deficit would have increased by 100% if, all else being equal, public investment had maintained its 2008 level in 2018. In more recent years, the importance of the contributions of the investment adjustment to deficit control is less significant, since the deficit increased once again with the arrival of the pandemic.
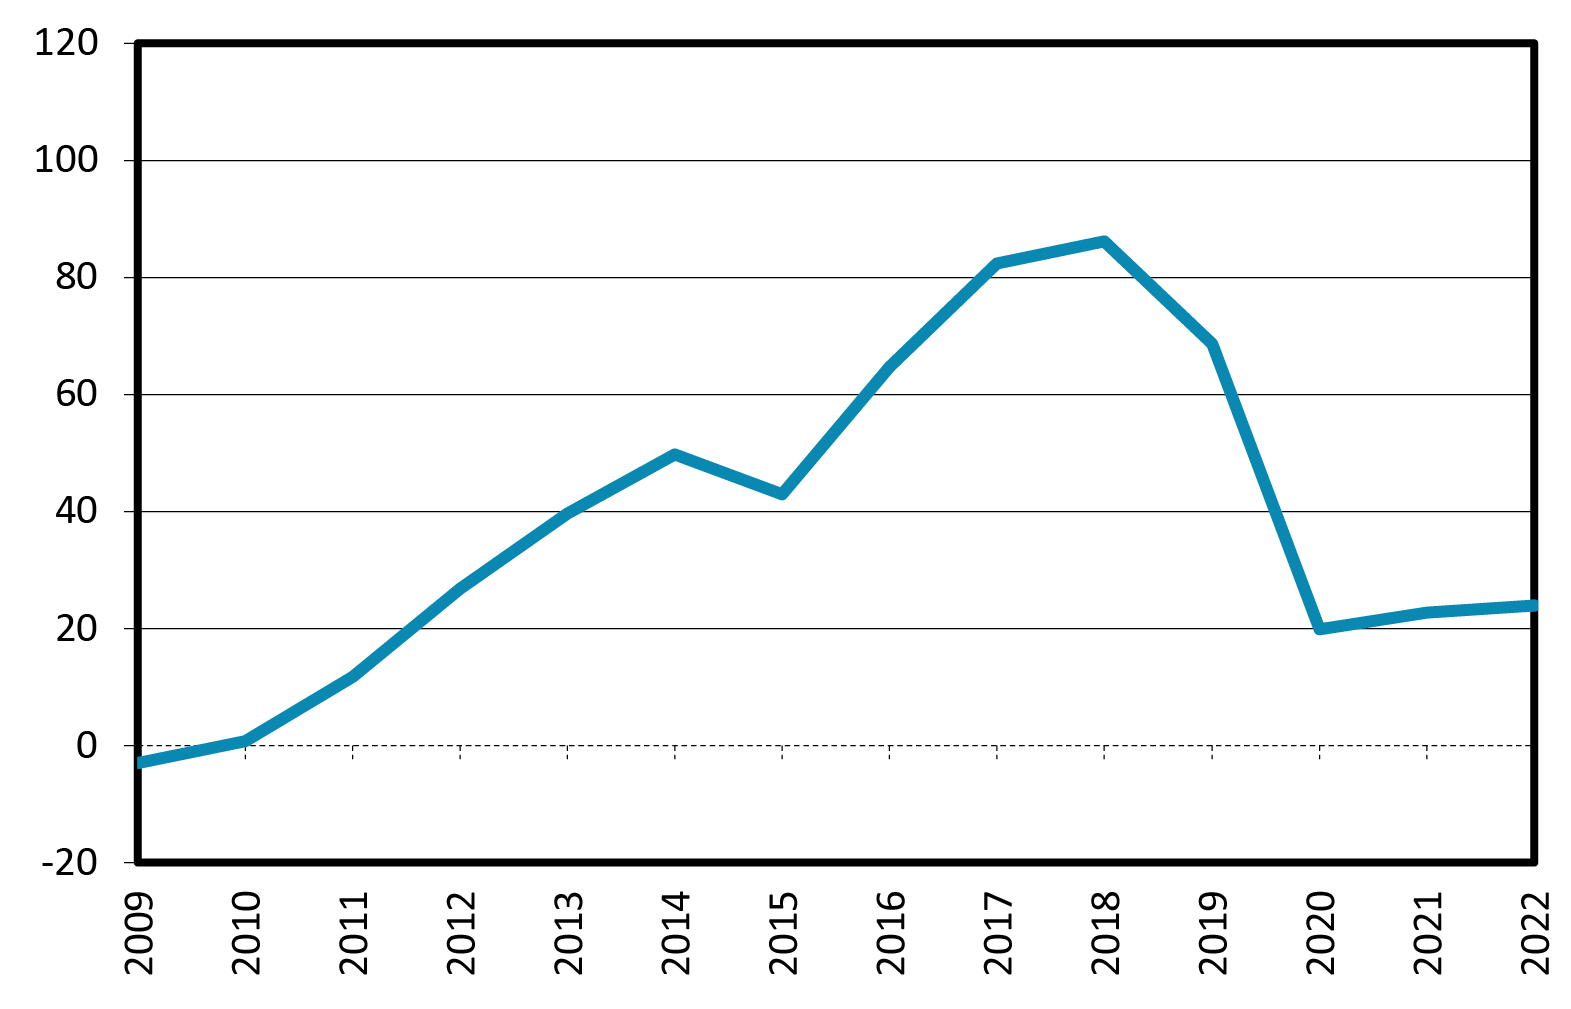
Fig. 5.9 Contributions of Investment Adjustments to the Reduction of Public Deficit in Spain, 2009–2022 (% of Deficit).
Note: Public investment includes investments made by external agents in infrastructures for public use (ADIF, AENA, State Ports, etc.).
Source: BBVA Foundation-Ivie (2023), IGAE (2023a), and authors’ elaboration.
A joint analysis of the trajectory of Spanish public sector gross investment and its contribution to keeping the deficit under control shows that European fiscal laws, as they were implemented in Spain, have not served to protect investment. The justification for financing investment with deficits is that, if net investment is reduced in order to avoid imbalances that threaten the sustainability of public accounts, the consequences could be negative for growth and fiscal sustainability. By not undertaking productive investment projects, economic activity is reduced and tax collection is also affected. This is why the classic interpretation of the golden rule (Blanchard and Giavazzi 2004; Mintz and Smart 2006) contends that public deficits and indebtedness should be permitted if the goal is to finance net investment.
Figure 5.10 shows the trajectories of the government deficit, gross fixed capital formation, fixed capital consumption, and net investment, together with the horizontal line defining the 3% medium-term deficit rule. This rule attempts to prevent debt sustainability problems, while acknowledging that there are reasons that justify the financing of growth-enhancing expenditures, particularly potentially productive investment, with deficits. The figure shows two relevant features of the situation in the period in which Spain’s public deficit has become a problem for compliance with the 3% rule, from 2009 onwards. The first feature is that the most important part of investment spending that is financed by the deficit is the consumption of fixed capital, that is, amortizations that allow the capital stock to be maintained, not increased. However, capital growth is what allows potential output to increase, and the stock does not grow because net investment is negative. Therefore, the growth of public capital is not what justifies the deficit. The second feature is that, despite the fact that the sharp adjustment of net investment makes a powerful contribution to controlling the public deficit, the notable gap between the two variables in the figure suggests that the most relevant part of the mismatch in the public accounts is the existence of recurring expenditure, both current and capital (such as consumption of fixed capital), which should be financed on a regular basis, but since they are not, they are financed with deficits.
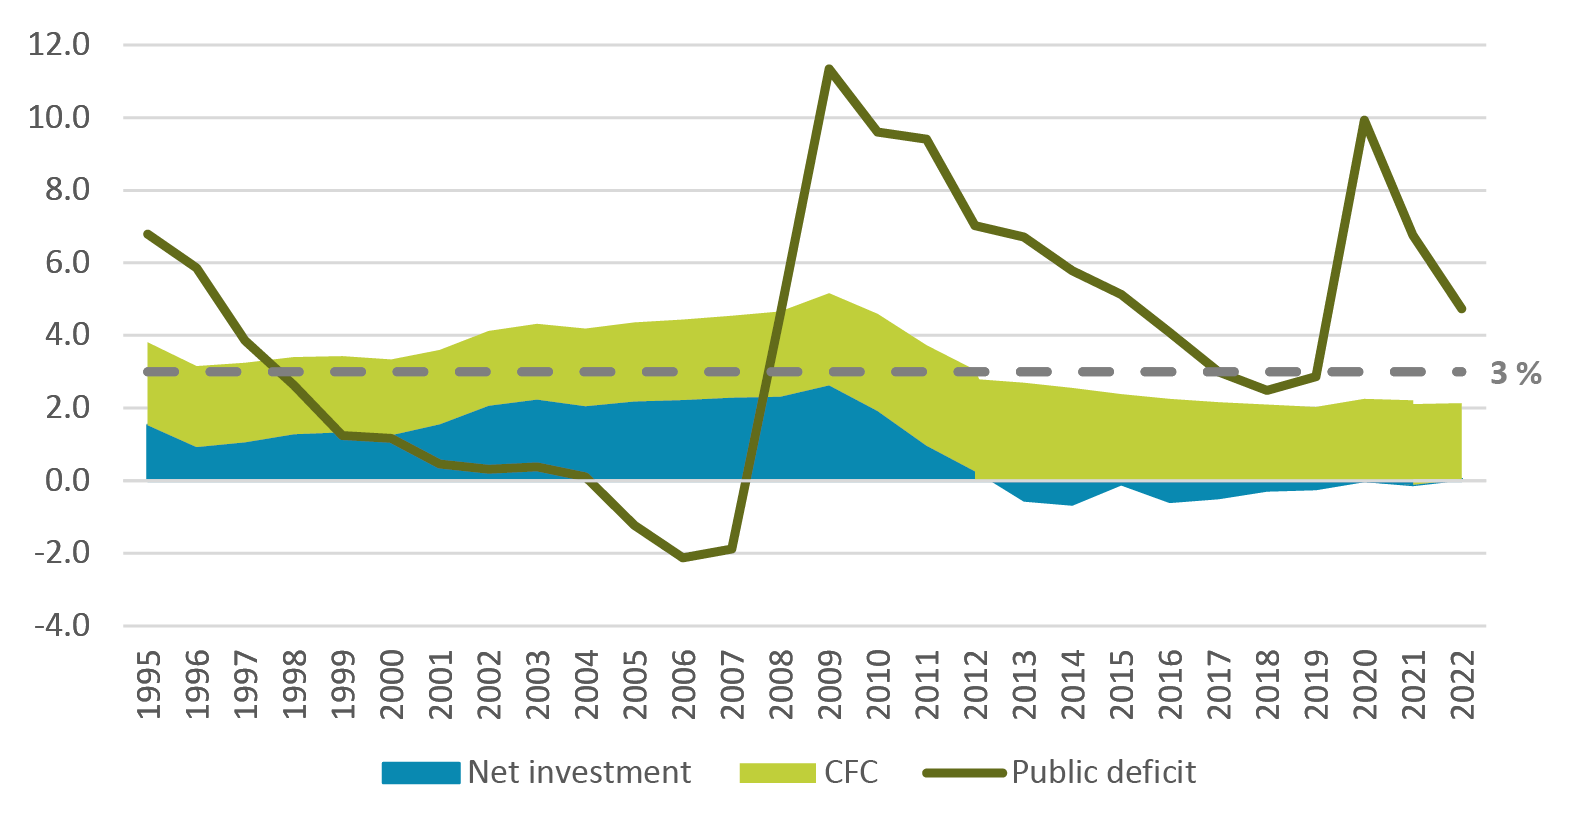
Fig. 5.10 Deficit Used to Finance Gross Investment and Fixed Capital Consumption: Net Investment, Fixed Capital Consumption, and Public Deficit. Spain, 1995–2022 (% of GDP).
Note: Public investment includes investments made by external agents in infrastructures for public use (ADIF, AENA, State Ports, etc.). The net budget balance of financial institution aid has been considered. The deficit is represented in the graph with the opposite sign to allow comparisons.
Source: BBVA Foundation-Ivie (2023), IGAE (2023a), and authors’ elaboration.
5.5 Conclusions
This analysis shows that, in the case of Spain, European fiscal laws are consistent with a situation that presents several undesirable features that call for revision.
The first is that, despite the fact that the fiscal rules contemplate a flexible criterion to maintain investment and public capital stock, it does not exist in practice. This is shown by the negative values of net public investment of the most indebted countries, including Spain.
The second feature is that fiscal rules are not applied in accordance with the golden rule. They allow a large part of the authorized deficit to be used to finance the amortization of existing capital, but covering the consumption of fixed capital does not imply an increase in the capacity to produce goods and services in order to grow. Rather, it suggests the maintenance of the flow of services from public assets.
The third unfavorable aspect is that fiscal rules have not been operating as stabilizing mechanisms for demand and activity. However, they accentuate the cyclical profiles, especially (but not only) through procyclical adjustments to investment during expansionary and recessionary phases.
The European Commission’s proposed review of the EU’s fiscal governance should consider how to address these undesirable features observed in the implementation of fiscal regulations established during periods of high indebtedness in different countries, particularly in Spain. The review of the EU’s economic governance framework should consider this and other experiences, in order to reinforce the compatibility between fiscal regulations and the investment targets set forth by the Recovery and Resilience Mechanism. If they are not protected, it will be increasingly challenging to improve the endowments of both tangible and intangible assets that contribute to the generation of European public goods with capacity to benefit future generations (Giavazzi et al. 2021).
References
Bank of Spain (2023). ‘Statistical Bulletin’. Madrid,
https://www.bde.es/webbe/en/estadisticas/otras-clasificaciones/publicaciones/boletin-estadistico/boletin-estadistico.html
BBVA Foundation and Ivie (The Valencian Institute of Economic Research) (2023). ‘El stock y los servicios del capital en España y su distribución territorial y sectorial’. València, March,
https://www.fbbva.es/bd/el-stock-y-los-servicios-del-capital-en-espana/
Blanchard, O. J. and F. Giavazzi (2004). ‘Improving the SPG through a Proper Accounting of Public Investment’. CEPR Discussion Papers, no. 4220. Washington D. C.: Center for Economic and Policy Research,
https://cepr.org/publications/dp4220
Darvas, Z. and J. Anderson (2020). ‘New Life for an Old Framework: Redesigning the European Union’s Expenditure and Golden Fiscal Rules’. Brussels: European Parliament,
https://www.europarl.europa.eu/thinktank/en/document/IPOL_STU%282020%29645733
EU KLEMS (2009). Growth and Productivity Accounts: November 2009 Release, updated March 2011,
http://www.euklems.net/euk09ii.shtml
—— (2012). Growth and Productivity Accounts: Data in the ISIC Rev. 4 industry classification,
http://www.euklems.net/eukISIC4.shtml
European Commission (2022). ‘Communication on Orientations for a Reform of the EU Economic Governance Framework. Brussels (COM(2022) 583 final’,
https://eur-lex.europa.eu/legal-content/EN/TXT/?uri=CELEX:52022DC0583
European Fiscal Board (2019). ‘Assessment of EU Fiscal Rules with Focus on the Six and Two-Pack Legislation’. Bussels: European Commission,
https://commission.europa.eu/system/files/2019-09/2019-09-10-assessment-of-eu-fiscal-rules_en.pdf
Giavazzi, F., V. Guerrieri, G. Lorenzoni, and C. Weymuller (2021). ‘Revising the European Fiscal Framework’, https://www.governo.it/sites/governo.it/files/documenti/documenti/Notizie-allegati/Reform_SGP.pdf
IGAE (Intervención General de la Administración del Estado). Contabilidad Nacional. Operaciones no financieras. Serie anual. Madrid: Ministerio de Hacienda, https://www.igae.pap.hacienda.gob.es/sitios/igae/es-ES/Contabilidad/ContabilidadNacional/Publicaciones/Paginas/ianofinancierasTotal.aspx
—— Contabilidad Nacional. Clasificación funcional del gasto de las Administraciones Públicas. Madrid: Ministerio de Hacienda, https://www.igae.pap.hacienda.gob.es/sitios/igae/es-ES/Contabilidad/ContabilidadNacional/Publicaciones/Paginas/iacogofseries.aspx
INE (Instituto Nacional de Estadística). Contabilidad Nacional anual de España (CNE). Revisión Estadística 2019. Madrid, https://www.ine.es/dyngs/INEbase/es/operacion.htm?c=Estadistica_C&cid=1254736177057&menu=resultados&idp=1254735576581
Luiss Lab of European Economics (2023). EUKLEMS & INTANProd-Release 2023. Roma: Luiss University, https://euklems-intanprod-llee.luiss.it/
Mintz, J. M. and M. Smart (2006). ‘Incentives for Public Investment Under Fiscal Rules’. Policy Research Working Papers, Washington D. C.: World Bank,
https://doi.org/10.1596/1813-9450-3860
Pérez, F. and M. Mas (Dirs.), E. Benages, J.C. Robledo, and I. Vicente (2020). ‘El stock de capital en España y sus comunidades autónomas. Ajuste de la inversión pública y reducción del déficit’. Working Papers, no. 1/2020. Bilbao: BBVA Foundation,
https://www.fbbva.es/wp-content/uploads/2020/01/DE_2020_DT_1_2020_Stock_de_capital_196-2017_Ivie_prot.pdf
1 The analysis that follows is based on information from the database that has been developed by the BBVA Foundation and the Ivie for over twenty-five years, which corresponds to the information for Spain that is used in different international databases, such as EU KLEMS, funded by the European Commission’s 6th and 7th Framework Program, as well as its successor, the EUKLEMS & INTANProd project, funded by the European Commission’s Directorate General for Economic and Financial Affairs (DG_ECFIN) (EU KLEMS 2011, 2012). The database is available at BBVA Foundation-Ivie (2023). In addition, a report that accompanies the database is published annually. Furter details can be found in Pérez and Mas (Dirs.) (2020).
2 The latest data broken down by type of infrastructure (productive or social) corresponds to 2020.
3 See a detailed analysis in Pérez and Mas (Dirs.) (2020).
