37. Notes on A Catalog of Difference
Andrew Lucia
© 2024 Andrew Lucia , CC BY-NC 4.0 https://doi.org/10.11647/OBP.0390.39
Introduction1
I present here a long-term research and analytic design project whose origins date back to roughly 2008, titled A Catalog of Difference.2 The Catalog, published in 2017, is the culmination of my tenure as the Cass Gilbert Visiting Fellow in the School of Architecture at the University of Minnesota, during which time I had the fortune and resources to refine and collate years of research to date. Intellectually, A Catalog of Difference is an ongoing analytic project in pursuit of two overarching questions:
- How is the material world around us organized?
- How is the information contained within its images structured?

Fig. 37.1 Select representations from A Catalog of Difference, 2017. Printed ceramic models of surface curvature (left), scatter plots of planar and spatial image gradients (middle), and the exhibition catalog (right). © Andrew Lucia (2017).
Physically, the Catalog is a collection of over one thousand studies that survey and analyze degrees of difference across images, objects, and environments. The outcome of these studies is a collection of artifacts comprising a range of representational types including 3D-printed ceramics, digital photography and moving image, 2D-printed renderings and drawings, and speculative texts (Figure 37.1). To date, only a fraction of the entire Catalog has been produced for exhibition, which has been shown in Minneapolis, New York, and Paris.3
The roots of this project are indebted to the theories and writings of Iannis Xenakis, and it is herein that those influences are reflected. For this I humbly give thanks to Xenakis, for opening the door to an expanded way of thinking, and to a group of people with whom I share through theory and practice.
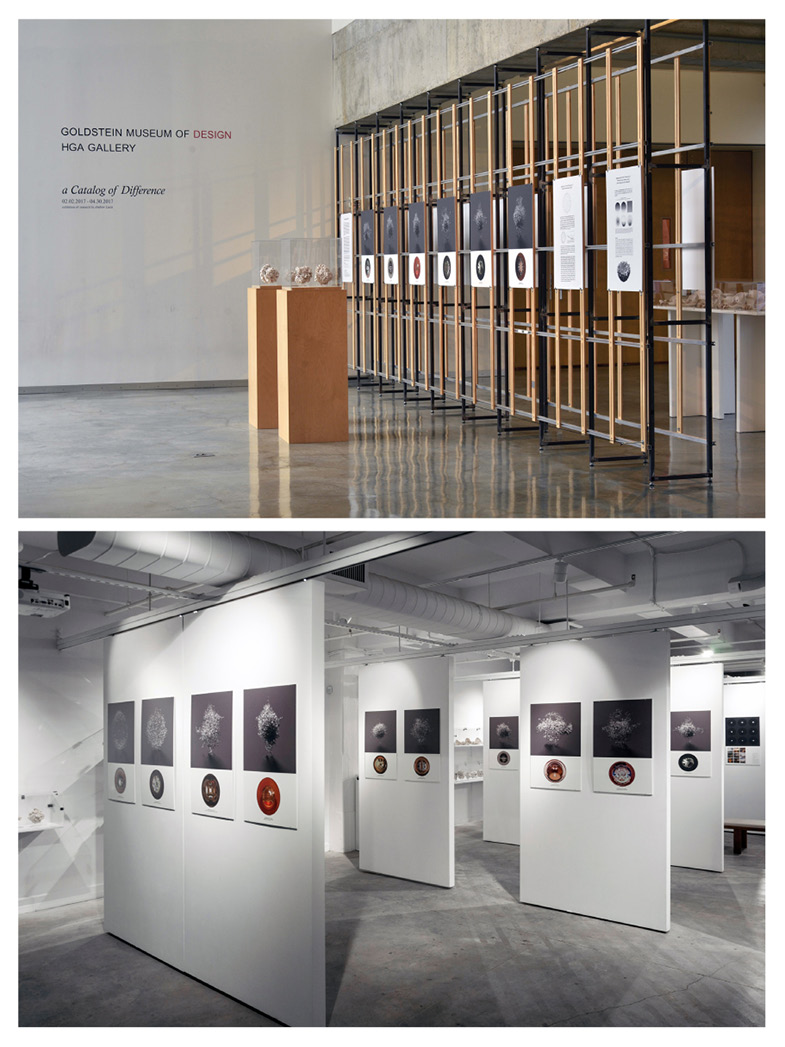
Fig. 37.2 A Catalog of Difference premiere exhibition at the Goldstein Museum of Design, HGA Gallery, Rapson Hall University of Minnesota, February through April 2017. Top image © Andrew Lucia (2017), and at usagiと_newyork, October 2017; lower image © Yuriy Chernets (2017), with permission.
Origins
The origins of the Catalog date back more than a decade, first as a series of questions formulated during my Master of Architecture thesis, Form Between Matter.4 Namely, how do the representational tools we employ impact the way we create and design? I would also extend this question to the model spaces of creation we routinely inhabit, those in architecture being almost exclusively geometric.5 And while there is much we are indebted to in this legacy, one must also ask to what extent its dominance has inhibited alternate modes of conception and expression. This challenge is akin to Xenakis’s pursuits beyond the traditions of Western music.6
The tools (the difference machines) that comprise the Catalog have been implemented and deployed across a range of data throughout the arts and sciences, while challenging assumptions within those disciplines (Figure 37.3). Throughout 2008–11, many of the initial concepts were formalized in LabStudio, a multidisciplinary collaborative spearheaded by Dr. Peter Lloyd Jones and Jenny Sabin, an initiative spanning the arts and sciences housed within the Schools of Design and Medicine at the University of Pennsylvania. It was here that many of the initial tools were developed, albeit in an agnostic manner, ones that could peer equally across scales and subjects into the worlds of biology and architecture.7
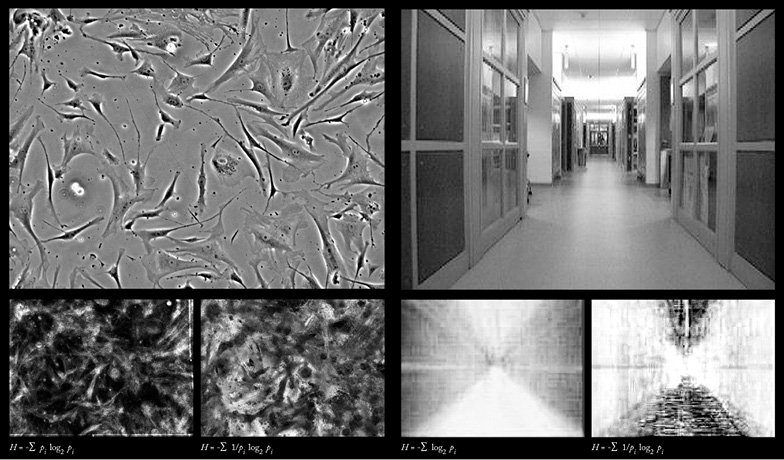
Fig. 37.3 Information calculations across scale and discipline. Information calculations based on the rate of change through moving images of smooth muscle cells under a microscope (left) and as a camera is tracked through a hallway (right). This figure was adapted from the original by Lucia et al., 2013, p. 187–90. © IEEE (2013). Reprinted, with permission, from Proceedings of the 15th International Conference on Information Visualisation (IV), 2011.
Xenakis
As mentioned, my background is in architecture, and it is through that avenue that I discovered Xenakis’s work. Yet it was not Xenakis’s architectural contributions that struck me, though no doubt significant. While one cannot decouple the conceptual thinking behind the development of his architectural and musical outputs (Figure 37.4), I want to stress that it was his sonic works and compositional theories that had an indelible impact on my thinking, particularly as they would relate to the perceptual world of material, its organization, and ultimately its appearance.8
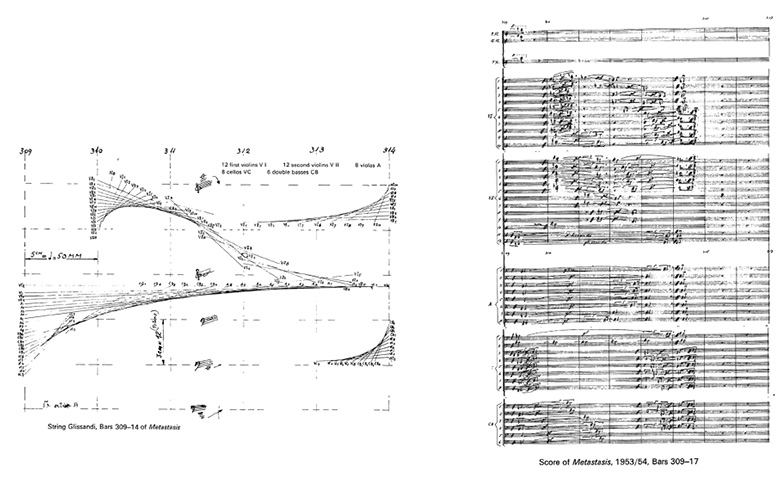
Fig. 37.4 Metastasis: notation of string glissandi, bars 309–14 (left), reprinted courtesy of Pendragon Press; and score (1953/54), bars 309–17, © 1967 by Boosey & Hawkes Music Publishers Limited, with kind permission of Boosey & Hawkes Bote & Bock, Berlin.
Of all Xenakis’s musical works, Metastasis is unique in its overlap with his architectural output, notably in the glissandi diagram’s relationship to that of the ruled surfaces present in the geometry of the 1958 Philips Pavilion.9
It was Xenakis’s writings and approaches to composition (and more broadly sound as a material), rooted in statistics and information theory that was, for me, revolutionary. Pithoprakta, for example, borrows from James Clerk Maxwell (1831–79) and Ludwig Boltzman’s (1844–1906) kinetic theory of gasses (Figure 37.5).
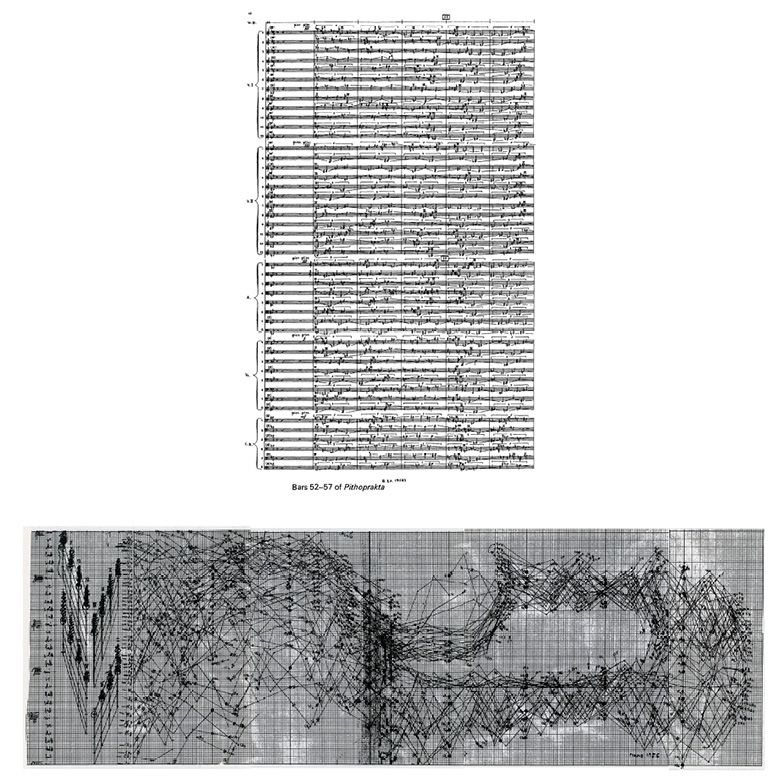
Fig. 37.5 Pithoprakta: score (1955/56), bars 52–7 (top) © 1967 by Boosey & Hawkes Music Publishers Limited, with kind permission of Boosey & Hawkes Bote & Bock, Berlin. Graph (bottom), reprinted courtesy of Pendragon Press. The graph represents a set of “speed temperatures” relating to the distribution of sonic elements, borrowing from Maxwell and Boltzmann’s kinetic theory of gasses. The score makes evident the body of simultaneous discrete elements, as if a gaseous mass. Reproduced in Xenakis, 1992, p. 17–21.
The approaches to a complex material world outlined in Xenakis’s Formalized Music opened a window that was undeniably prescient, one which could not be ignored. If, for Xenakis, sound was material, my parallel material-perceptual world in architecture was light.10 The query embedded at the core of A Catalog of Difference shares Xenakis’s way of thinking in a granular manner, in a way that considers the organization of material as probabilistic and cloud-like (Figure 37.7).
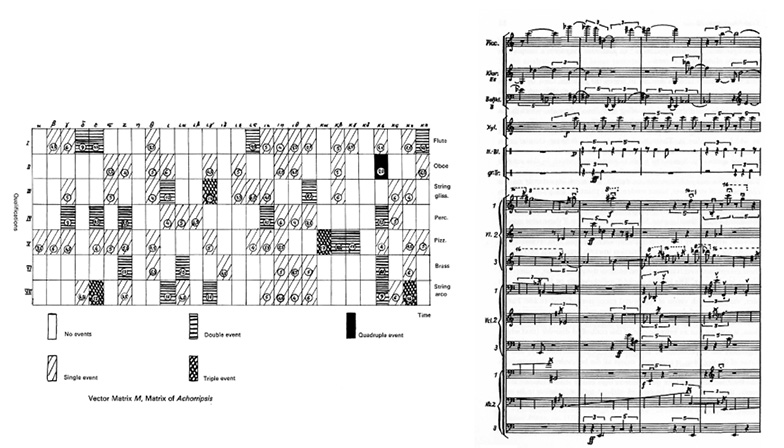
Fig. 37.6 Achorripsis: Vector Matrix M (left), reprinted courtesy of Pendragon Press; and (right) bars 104–8 (1956/57), © 1967 by Bote & Bock Musik- und Bühnenverlag GmbH & Co., with kind permission of Boosey & Hawkes Bote & Bock, Berlin. The likelihood of sonic events considered in a stochastic manner. Reproduced in Xenakis, 1992, p. 26–8.
Achorripsis (1958) offers one such example whereby the density and likelihood of sonic events were considered in a stochastic manner (Figure 37.6). Xenakis offered a model of the material and perceptual world in which things are not treated as finite “things,” but rather as flows of informational events; flows that have an order (taxis), organization (systasis), structure, and probability of occurrence (tyche).11 In short, a world of perception that is composed of discrete micro-events, in aggregate comprising a macro-event; events whose quantization is a consequence of the limits of the perceptual body encountering those flows of information.
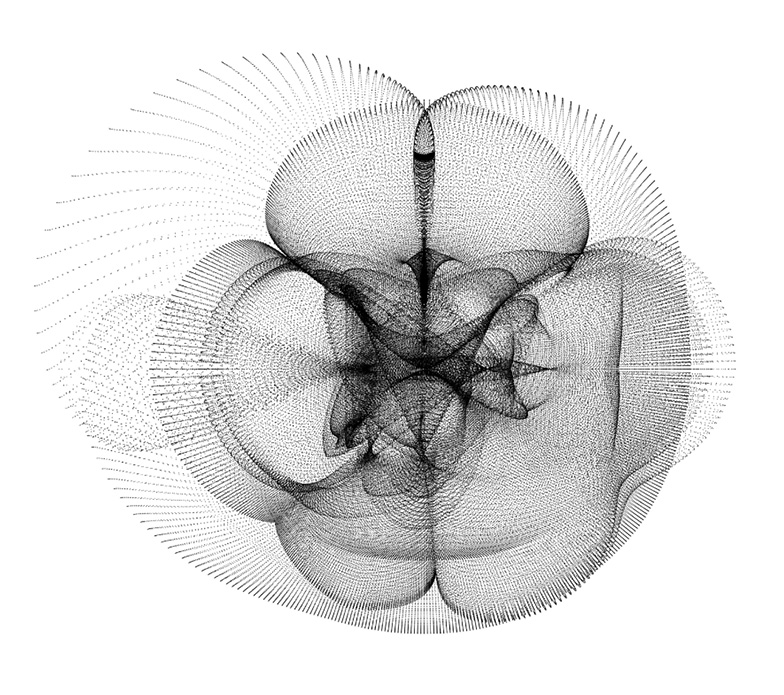
Fig. 37.7 Intrinsic Curvature Study of a Deformed Torus #2 from A Catalog of Difference, 2017. © Andrew Lucia (2017).
Xenakis’s Formalized Music was transformative in demonstrating approaches to my own questions concerning more stable matter and its ephemeral image.12 Like Xenakis, the methods of the Catalog were developed as a means of questioning inherited formal legacies, those in architecture spanning centuries to the foundations of the discipline—namely those of descriptive and projective geometry (Figure 37.8). Alternatively, how might we reframe this discussion in an informational, rather than geometric, understanding of space and its perception?13
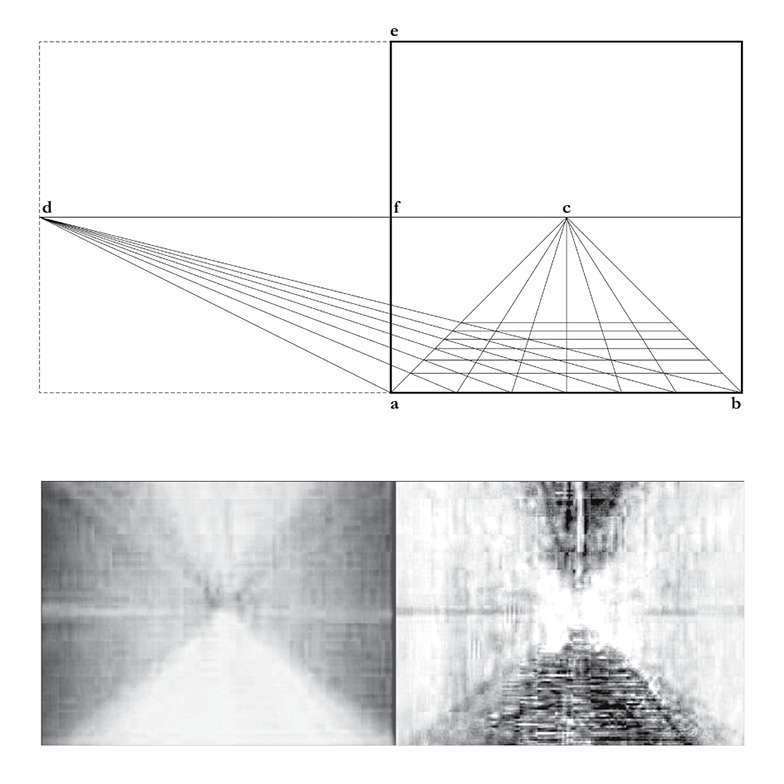
Fig. 37.8 From geometry to information. Diagram of Perspective Construction (top) after Leon Battista Alberti: De Pictura (conceived 1435–6): (ab) ground plane; (c) vanishing point (centric); (d) viewer’s eye; (abe) picture plane; (df) viewing distance; (dfc) horizon line. Cumulative summation value for information derived from a video as a camera is tracked down a corridor (Bottom). Weighted “moderate” and “rare” event information (left and right). Portions of the bottom figure were adapted from the original by Lucia et al., 2013, p. 190. © IEEE (2013). Reprinted, with permission, from Proceedings of the 15th International Conference on Information Visualisation (IV), 2011.
Difference
As the tools and theories behind A Catalog of Difference began to evolve and expand, so too did the cast of referents. No doubt, the application of information theoretic ways of thinking were not exclusively the purview of Xenakis, although he was certainly the foremost revolutionary of these concepts in music.14 It would be beyond the arts that the works of others began to enter into my thinking, one notable figure and the namesake behind the Catalog being the anthropologist Gregory Bateson (1904–80).15 Like Xenakis, his ability to synthesize disparate realms of knowledge under one umbrella echoes strongly. Importantly, Bateson is remarkable for his embrace of information theoretic principles more broadly into the evolutionary sciences, anthropology, perception, linguistics, biology, aesthetics, and design. It was from here that parallels can be drawn to Bateson’s usage of the term difference, specifically his notion that it is those differences that make a difference that matter in so many aspects of our conscious and unconscious lives.16
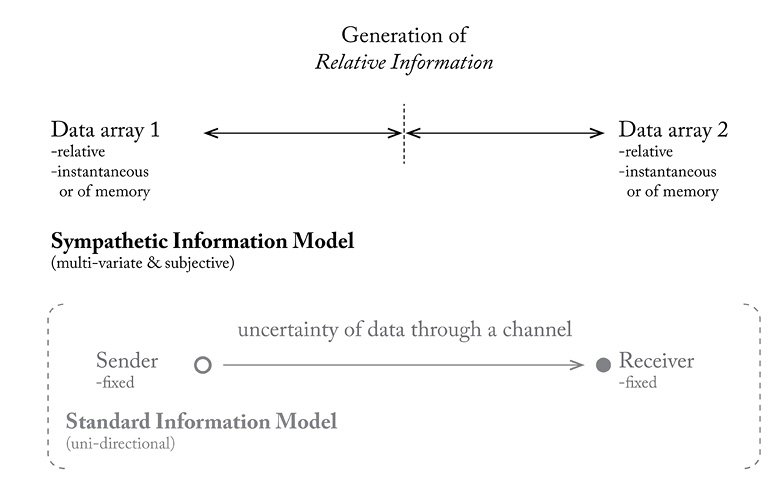
Fig. 37.9 From standard to sympathetic information models through a fusion of relative data. Note the distinction from the classic standard model of information with that of the sympathetic model proposed here. The latter relies on the comparison of two relative data arrays while the former describes a unidirectional flow of information through a discrete channel. Lucia, 2017, p. 104. © Andrew Lucia (2017).
Bateson states, “To produce news of difference, i.e., information, there must be two entities (real or imagined) such that the difference between them can be immanent in their mutual relationship.”17 Bateson similarly notes, “[…] perception operates only upon difference. All receipt of information is necessarily the receipt of news of difference, and all perception of difference is limited by threshold. Differences that are too slight or too slowly processed are not perceivable.”18 Ultimately, for all of the many figures that have embraced information theoretic principles, it is difference that underlies the generation of information, particularly perceptual information.19
For Xenakis, these perceptual and informational principles were inherently embedded within his theories and methods. Here we see his diagrams describing how one might embed the limits of perception into sonic compositional material (Figure 37.10). These exist at the upper and lower thresholds of audible perception, and durationally as the just-noticeable difference.20
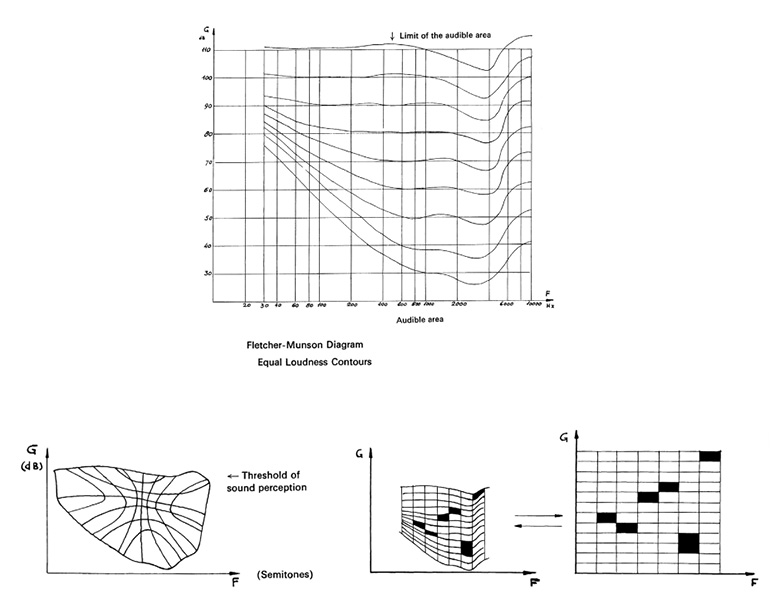
Fig. 37.10 Fletcher-Munson diagram of equal loudness contours (top) and their remappings based upon the sensitivity of human perception to the density of sonic events (bottom). Reproduced in Xenakis, 1992, p. 48–9. Images used with permission of Sharon Kanach and Pendragon Press.
Image in Motion: The Probability of Change across Images Through Time
The various tools and processes embedded in the representations of the Catalog were developed in parallel over the course of several years. Before discussing the static representations comprising the 2017 and 2018 exhibitions of the work, it is necessary to cover the dynamic studies and tools underpinning their creation—those whose origins are directly influenced by Xenakis’s Markovian stochastic theories of composition outlined in Formalized Music.21
Xenakis would conceive of his sonic materials existing as grains of sound composed of duration, frequency, and intensity that were “adequately disposed in time” and could be “resolved into elementary acoustic signals of very short effective durations, whose amplitude can be divided equally into quanta in the sense of information theory.”22 Xenakis devised a vector space for the life of all sonic events, whereby grains of sound were disposed on conceptual “screens,” or “time-sheets,” whereby a “book of screens equals the life of a complex sound.”23 Xenakis’s “book of screens” is an abstract space depicting the quality and organization of sonic events through time (Figures 37.11 and 37.12). Albeit not a 1:1 translation, taking license with this abstraction, one can equally consider the moving image in a similar manner. An individual sheet of visual material (i.e., an image) inherently contains many of the same variables as Xenakis’s granular sonic materials, and even more so when considered through time.

Fig. 37.11 Distribution of elementary sonic grains as vectors disposed along a frequency (f) and intensity (G, dB) axes through time (t), with the top diagram demonstrating continuous tones and the bottom depicting glissandi events. Reproduced in Xenakis, 1992, p. 50, 55. Images used with permission of Sharon Kanach and Pendragon Press.
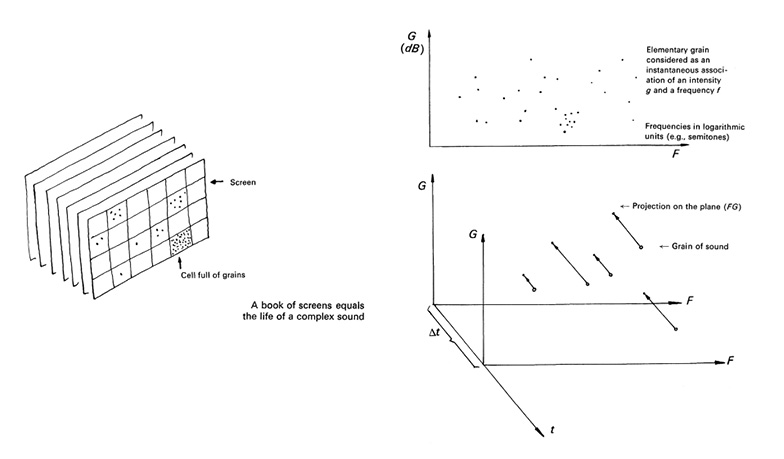
Fig. 37.12 A “book of screens” upon which granular sonic elements are distributed; a series of discrete temporal planes for the life of complex sounds. Reproduced in Xenakis, 1992, p. 46, 51. Images used with permission of Sharon Kanach and Pendragon Press.
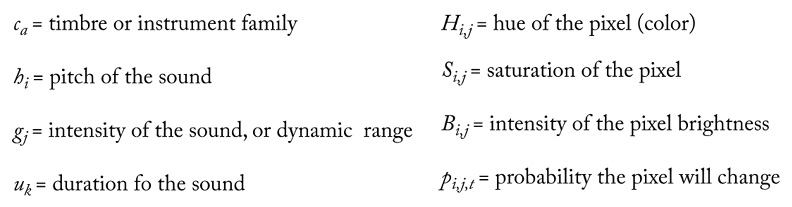
Fig. 37.13 Variables of sound and moving image. Xenakis’s definition of sonic entities (left), “represented in a first approximation by vectors of four usually independent variables” (adapted by author from Xenakis, 1992, p. 23). By comparison, variables associated with moving images are defined by hue, saturation, and brightness of pixel values, with the probability of a pixel’s change being substituted for its duration.
By the very nature of digital consumer image technology, a static image comes ready-made and composed of individual elements in the form of pixels, whose variables include intensity and color rendered within the limits of human visual perception (hue, saturation, and brightness), with the probability of change being a variable through time (Figure 37.13). I want to take a moment to walk through an example, one that considers these variables.
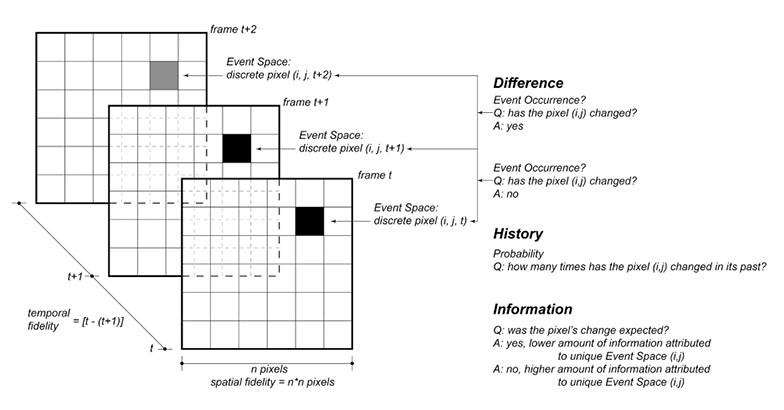
Fig. 37.14 Schematic diagram of pixel event space; difference, history and information. Original figure by Lucia et al., 2013, p. 188. © IEEE (2013). Reprinted, with permission, from Proceedings of the 15th International Conference on Information Visualisation (IV), 2011.
In this schematic diagram (Figure 37.14), every pixel is queried as to whether its state has changed within a given brightness threshold. This is a question of difference. Next, its history is examined for the probability of its likelihood to change. Based on its current state (change or no change), its information may be tabulated. For this the general equation utilized by Xenakis and developed by Claude Shannon (1916–2001) and Warren Weaver (1894–1978) is used, H = –∑ pi log2 pi , whereby H is the amount of uncertainty in the occurrence of an event, p is the probability of an event occurring.
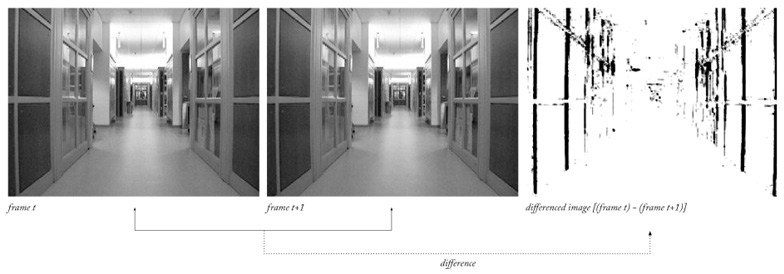
Fig. 37.15 Image differencing. Difference in pixel contrast (right) between consecutive digital video images (left and middle) as a camera is tracked down a hallway. This figure was adapted from the original by Lucia et al., 2013, p. 187. © IEEE (2013). Reprinted, with permission, from Proceedings of the 15th International Conference on Information Visualisation (IV), 2011.
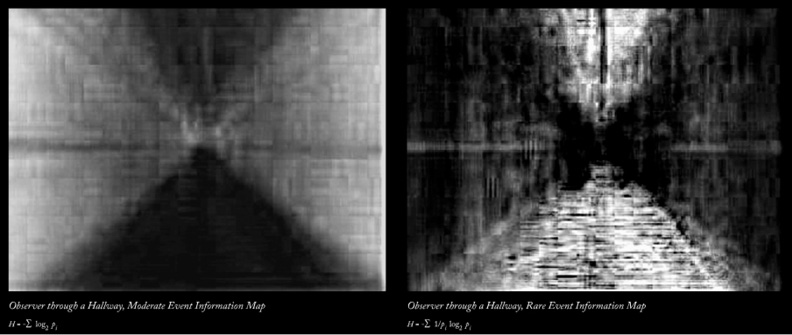
Fig. 37.16 Information maps. Cumulative summation values for information maps derived from a video as a camera is tracked down a corridor demonstrating weighted moderate and rare event information for an observer traversing a hallway. This figure was adapted from the original by Lucia et al., 2013, p. 190. © IEEE (2013). Reprinted, with permission, from Proceedings of the 15th International Conference on Information Visualisation (IV), 2011.
In Figures 37.15 and 37.16, we take the example of a recording device traversing a hallway. The brightness intensity of sequential images is subtracted from one another, resulting in their difference. As the difference is calculated, the cumulative summation of information is tabulated and weighted in a manner that favors common or rare events in the pixel field.24
Xenakis’s compositional methods were developed in abstract mathematical spaces, or vector spaces. In doing so, he was operating one step removed from the direct material at his disposal, one of several means utilized to break from Western traditions. These information mappings now describe visual material in probabilistic terms, yet as a static image they are not situated in an abstract vector space describing their changing disposition. The second half of this chapter focuses on this phenomenon while asking: “How different am I from my neighbor?”, which makes up the foundational question of A Catalog of Difference.
A Catalog of Difference (2017)25
While the tools that comprise the Catalog have found application to data across an array of disciplines and scales, I present here the instantiation of the project that exclusively examines human-scaled spaces, surfaces, and their images. The research is divided into three distinct yet related subsets, examining the order and organization of planar ambient light, spherical ambient light, and surface curvatures. The studies in each of these subsets questions form versus its appearance. An important translational goal of the Catalog was to render each entity removed from its outward metric image, to represent it in an abstract vector space in terms of its degrees of difference and order. Each representational artifact is an aggregate of micro-entities that in total suggests a cloud-like macro-form.
Analysis on the Order and Structure of Ambient Light Embedded within Planar Imagery
The first subset of the research begins with an examination into the structure of ambient light projected to a picture plane—as this is the historically dominant modality by which images have been constructed and transmitted.
Method and Analysis
For these studies, the gradient vectors within each image are calculated, extracted, and remapped to a polar coordinate system forming a scatter plot (Figure 37.17). The scatter plot of each image gradient depicts the changing intensity and direction of light within the image. To do so, each data point is measured locally within the image at every pixel in comparison to its neighbors. Alternately stated, every point in an image asks itself, “to what degree and in which dominant direction am I different from my neighbors?”
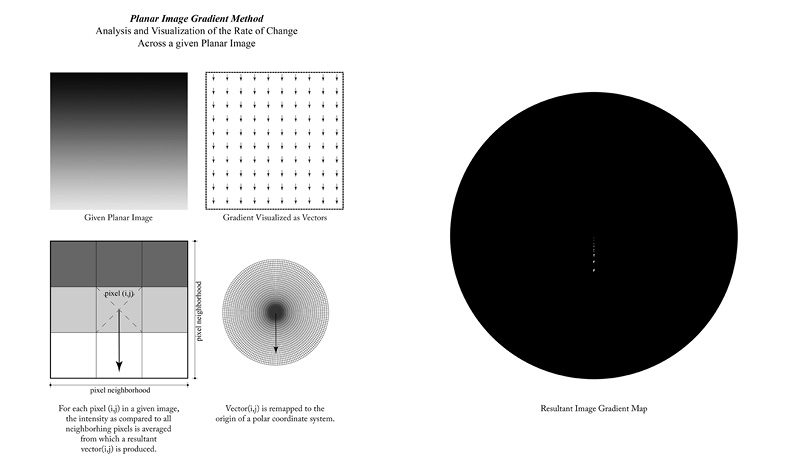
Fig. 37.17 Planar image gradient method from A Catalog of Difference, 2017. © Andrew Lucia (2017).
The result is a visualization of the structure of difference within the image. Removed from its respective appearance, this light-based signature is thus a qualitative and quantitative description of the order within a scene’s image. Here, I present the scatter plots for images of clouds, flora, and urban scenes (Figures 37.18, 37.19, and 37.20, respectively). Additionally, the number noted for each study is a measure of the amount of redundancy within each gradient, an account of the redundancy within the spatial difference of light values across the entire image. These values are plotted logarithmically with higher values indicating less redundancy, more disorder, and thus more information. This type of difference ultimately underlies the spatial structure of ambient light-based information within a given scene.
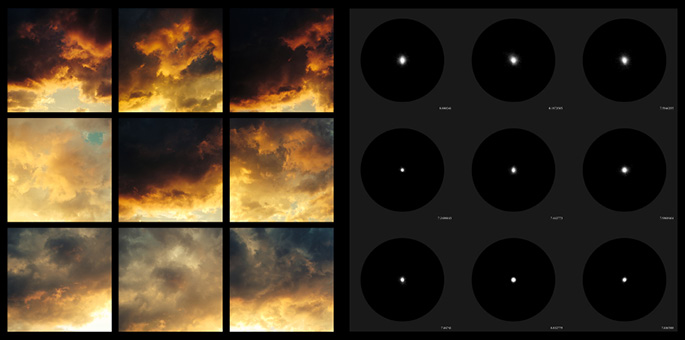
Fig. 37.18 Study of nine images of clouds (left) and their image gradients (right) from A Catalog of Difference, 2017. Each image gradients’ information content is calculated as [H = –∑ pi log2 pi] and noted numerically. © Andrew Lucia (2017).
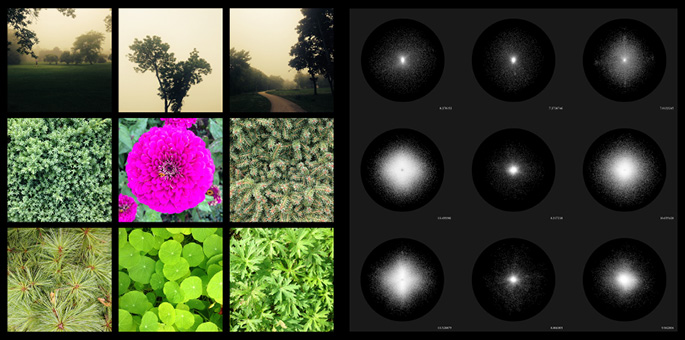
Fig. 37.19 Study of nine images of flora (left) and their image gradients (right) from A Catalog of Difference, 2017. Each image gradients’ information content is calculated as [H = –∑ pi log2 pi] and noted numerically. © Andrew Lucia (2017).
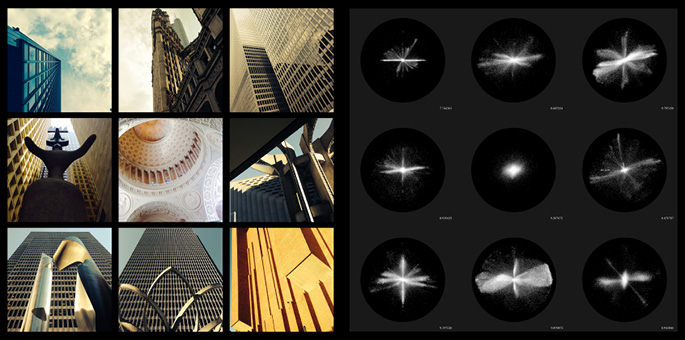
Fig. 37.20 Study of nine images of the built environment (left) and their image gradients (right) from A Catalog of Difference, 2017. Each image gradients’ information content is calculated as [H = –∑ pi log2 pi] and noted numerically. © Andrew Lucia (2017).
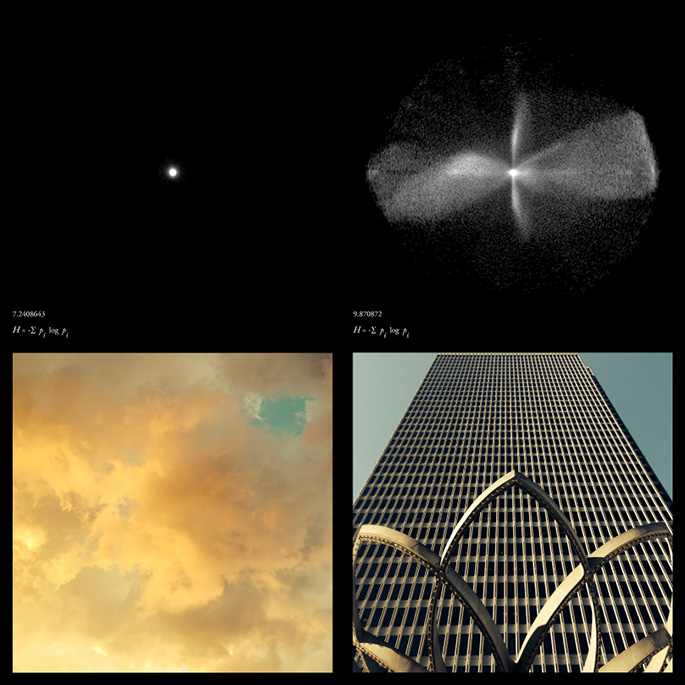
Fig. 37.21 Comparison of the image gradients of clouds and an urban environment, and their respective gradients’ information content [H = –∑ pi log2 pi]. © Andrew Lucia (2017).
Lastly, it should be noted that the order of physical material within the original scene is not an indicator of the amount of order in the light-based information that is contained within that scene’s image. For instance, the information in the appearances of many urban scenes’ gradients exceeds that of the natural environments (Figure 37.21). Clouds in particular have a highly ordered ambient reflection and thus their images have a lower information content. Though static in nature, this type of measurement can be seen as akin to Xenakis’s ideas of ataxy, allowing images to be categorized purely based on their structures’ degrees of order or disorder, rather than by their symbolic or linguistic significance. Here, the images from Figures 37.19 and 37.20 are arranged according to the amount of order within their gradients (Figures 37.22 and 37.23).
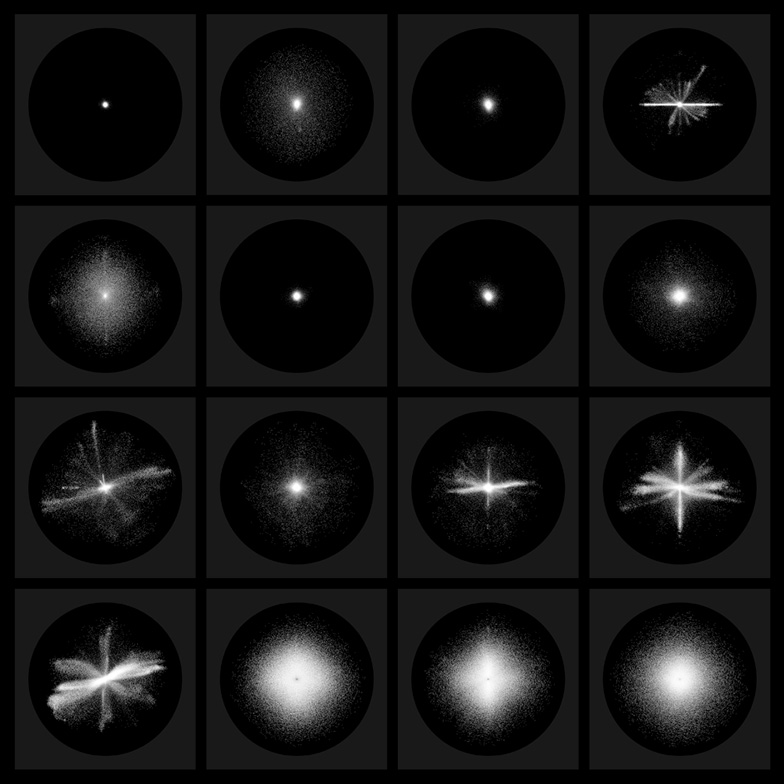
Fig. 37.22 Matrix of nine image gradients arranged according to their information content (lower, upper left to higher, bottom right). This type of arrangement can be seen as akin to Xenakis’s ideas of ataxy, allowing images to be categorized purely based on their structures’ degrees of order or disorder, rather than by their symbolic or linguistic significance. © Andrew Lucia (2017).

Fig. 37.23 Matrix of nine images arranged according to their gradients’ information corresponding to the content in the previous figure. © Andrew Lucia (2017).
Analysis on the Order and Structure of Omni-directional Ambient Light
Here, a major two-fold shift occurring in modalities of visual representation is undertaken (Figure 37.24): the first is a transition from planar to spherical modes of projection, followed by an extrinsic to intrinsic reframing of an observer relative to their perceptual environments.26 The light captured on a picture plane is but a subset of all the omnidirectional ambient light reaching an observation point within an environment. That limited subset, typically manifest as a framed planar image, is ultimately a fragment of a much larger spherical domain of light—a unique point of observation containing all light-based information about an environment—within a sphere of observation.
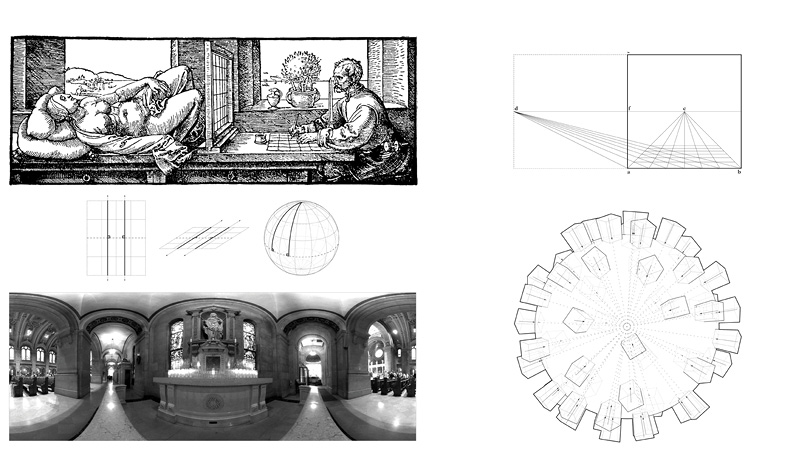
Fig. 37.24 From plane to sphere. Draughtsman Drawing a Recumbent Woman, Albrecht Dürer, 1525 (top left, public domain); violation of the parallel postulate in positively curved spherical-space (middle left); spherical image remapped to planar representation (bottom left); Diagram of Perspective Construction (upper right) after Leon Battista Alberti: De Pictura (conceived 1435–6); diagram of a spherical image subdivided by discrete picture frames (bottom right). Lucia, 2017, p. 76, 106. © Andrew Lucia (2017).
Method and Analysis
The gradient vectors for each environment’s spherical image are calculated, extracted, and remapped to a common origin forming a spatial scatter plot in the form of a point cloud. The method used here, illustrated in Figure 37.25, is similar in nature to that of the planar image gradient extraction described earlier. Lastly, after remapping the vectors as points, for visualization purposes moments of density within the resultant point cloud are figured and solidified as a surface.
For demonstration, the light spheres for two interior scenes (Figure 37.26) are set against two scenes from an outdoor natural environment (Figure 37.27). We see here, again, nine studies on the structure of light embedded within human-made built environments (Figure 37.28), contrasted against nine demonstrating those of natural environments (Figure 37.29). In the former, discernible structure is evident, whereas the latter is far more evenly distributed.
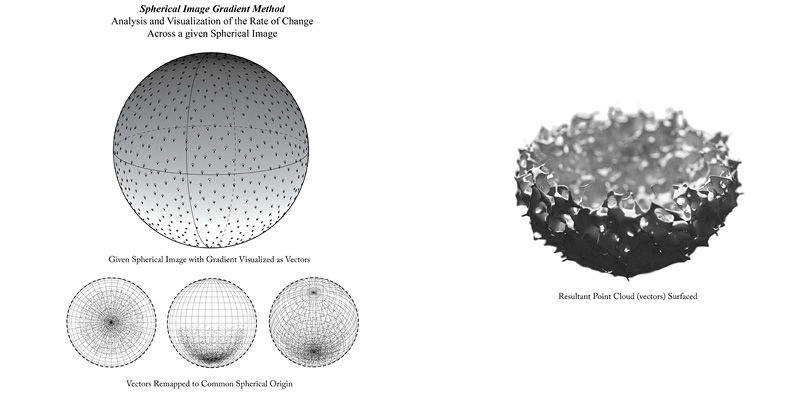
Fig. 37.25 Spherical image gradient method from A Catalog of Difference, 2017. © Andrew Lucia (2017).
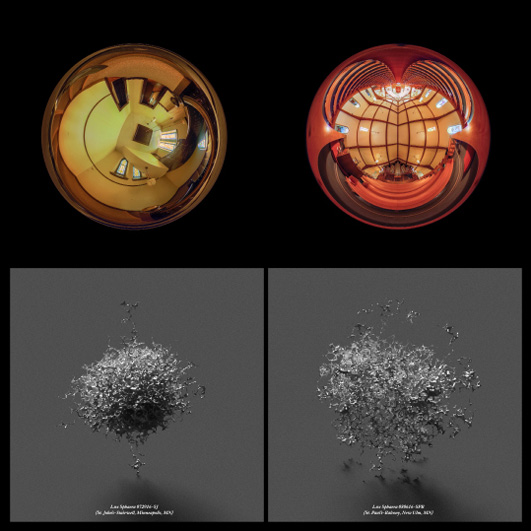
Fig. 37.26 Two studies on the structure of light embedded within human-made built environments from A Catalog of Difference, 2017. © Andrew Lucia (2017).
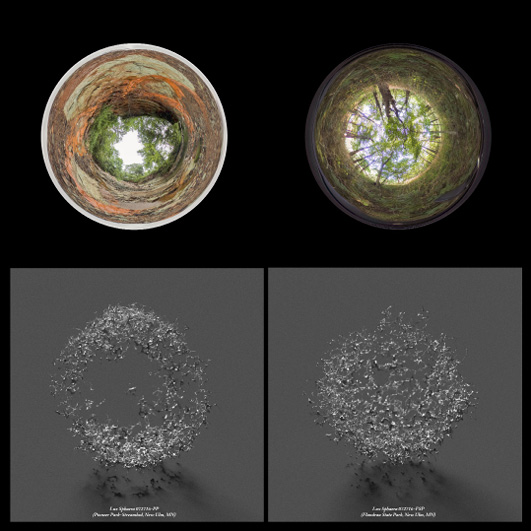
Fig. 37.27 Two studies on the structure of light embedded within natural environments from A Catalog of Difference, 2017. © Andrew Lucia (2017).
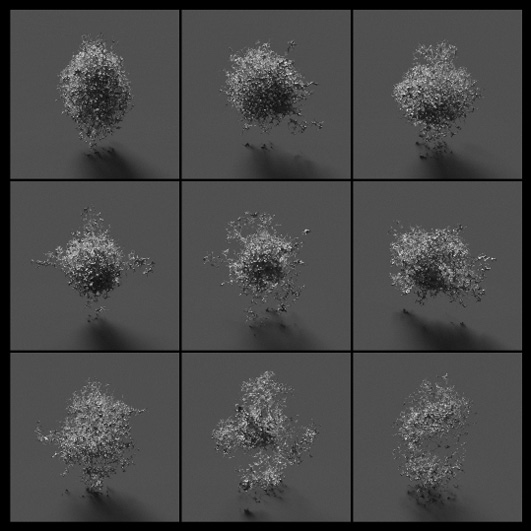
Fig. 37.28 Nine studies on the structure of light embedded within human-made built environments from A Catalog of Difference, 2017. © Andrew Lucia (2017).
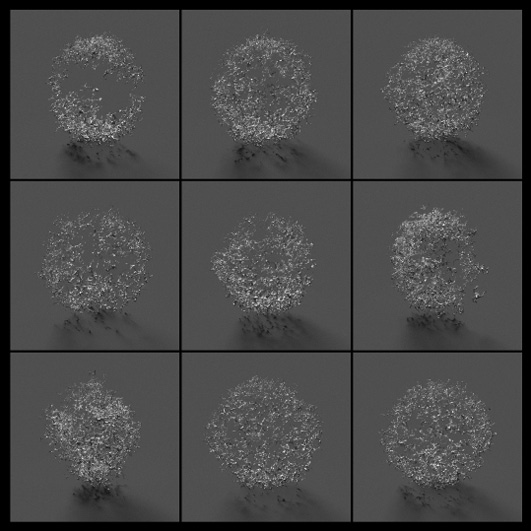
Fig. 37.29 Nine studies on the structure of light embedded within natural environments from A Catalog of Difference, 2017. © Andrew Lucia (2017).
Analysis on the Order and Structure of Surface Curvature
Similar to the prior studies in ambient light, these surficial inquiries challenge the notion of an object’s underlying formal structure versus that of its appearance. Here, through a measure of intrinsic curvature (the Gaussian curvature), an object is represented as a description of the change across itself. One is no longer concerned with the object as a thing, but rather with how that thing is intrinsically changing. What would typically be a discussion of an object’s shape and surface is now framed akin to the approaches undertaken throughout the light-based portions of this research—those asking how a system is changing across itself. These types of systems do not rely on external observation and depend entirely on local understandings of difference.27
Method and Analysis
Here, the rate of change across a given surface is evaluated, visualized as a vector, and remapped to a common origin producing a spatial scatter plot in the form of a point cloud (Figure 37.30). As with the image gradients, each point of evaluation upon the surface is taken and measured locally. Alternately stated, every point on the surface asks itself, “to what degree and in which direction am I different from my neighbors?”
Taken further, a point cloud of infinite density is ostensibly a surface (Figures 37.32 and 37.33). In that regard, I present five studies on the intrinsic curvature of Plücker’s conoid, and five studies on the intrinsic curvature of annuli.
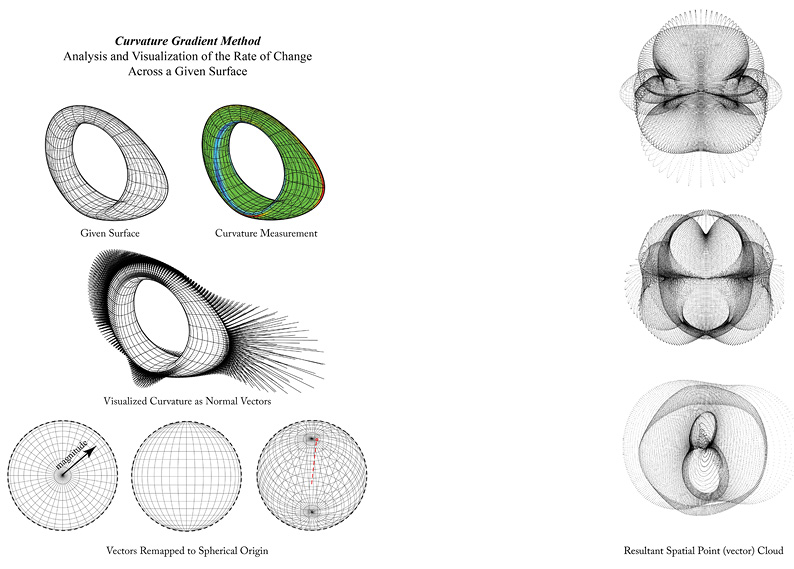
Fig. 37.30 Curvature gradient method from A Catalog of Difference, 2017. This figure was adapted from the original by Lucia et al., 2013, p. 194–5. © IEEE (2013). Reprinted, with permission, from Proceedings of the 15th International Conference on Information Visualisation (IV), 2011.
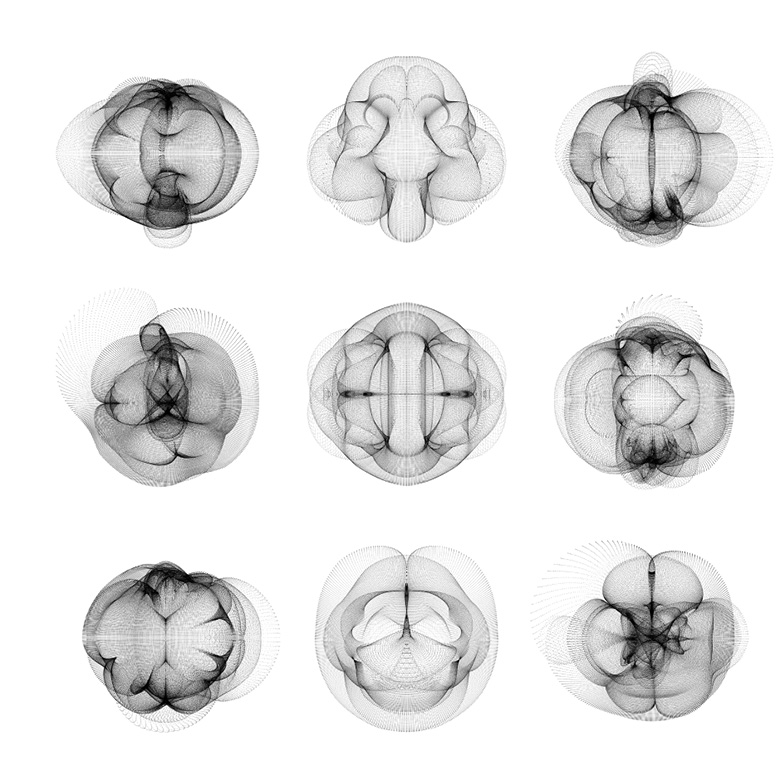
Fig. 37.31 Nine studies on the intrinsic curvature of deformed tori from A Catalog of Difference, 2017. © Andrew Lucia (2017).
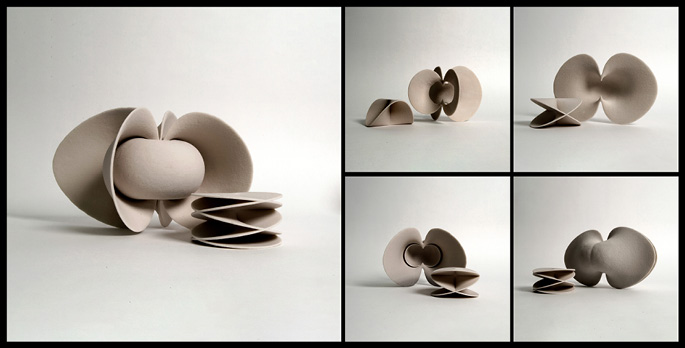
Fig. 37.32 Five studies on the intrinsic curvature of Plücker’s conoid from A Catalog of Difference, 2017. © Andrew Lucia (2017).
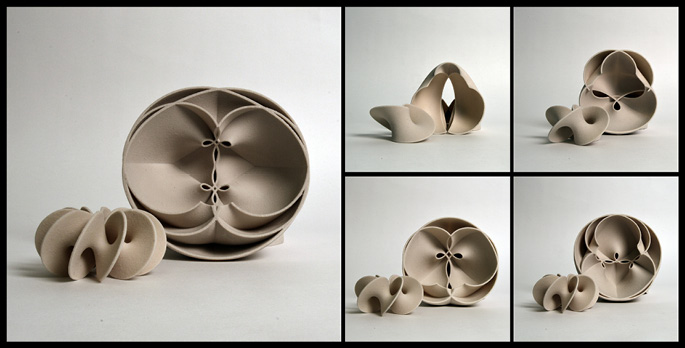
Fig. 37.33 Five studies on the intrinsic curvature of annuli from A Catalog of Difference, 2017. © Andrew Lucia (2017).
Conclusion
The studies comprising A Catalog of Difference do not purport to be a direct translation of Xenakis’s methods from the sonic realm into that of the visual. Rather, the difference machines elaborated on in the Catalog are a suite of methodologies that, in concert, ask questions of the visual world of matter akin to that in which Xenakis’s generative methods operate sonically. This is but a moment along the journey of an ongoing adventure in perception.28
References
BATESON, Gregory (2002), Mind and Nature: A Necessary Unity, Cresskil, New Jersey, Hampton Press.
BATESON, Gregory (2000), “Form, Substance and Difference,” in Steps to an Ecology of Mind, London, University of Chicago Press, p. 454–71.
GIBSON, James J. (1986), The Ecological Approach to Visual Perception, Hillsdale, New Jersey, Lawrence Erlbaum Associates.
LUCIA, Andrew (2017), A Catalog of Difference, Minneapolis, Minnesota, UMinn Papers on Architecture.
LUCIA, Andrew (2010), Form Between Matter: A Thesis, Pennsylvania, Philadelphia, self-published.
LUCIA, Andrew, SABIN, Jenny E., and JONES, Peter Lloyd (2013), “Memory, Difference, and Information: Generative Architectures Latent to Material & Perceptual Plasticity,” in Frank T. Marchese and Ebad Banissi (eds.), Knowledge Visualization Currents: from Text to Art to Culture, London, Springer-Verlag, p. 179–97, https://doi.org/10.1007/978-1-4471-4303-1_10
LUCIA, Andrew with SABIN, Jenny E., and JONES, Peter Lloyd (2018), “Motility and the Observation of Change,” in Sabin and Jones (eds.), Labstudio, Design Research between Architecture and Biology, New York, Routledge, p. 215–30.
LUCIA, Andrew and SABIN, Jenny E. (2014), “Rethinking Xenakis and the Role of Information in the Immediate Production of Architectural Affects,” in Michael Benedikt (ed.) CENTER 18: Music in Architecture—Architecture in Music, University of Austin, Texas, p. 192–203.
MOLES, Abraham (1968), Information Theory and Esthetic Perception, Urbana, Illinois, and London, University of Illinois Press.
XENAKIS, Iannis (1958), Achorripsis (score), Berlin, Bote & Bock.
XENAKIS, Iannis (1992), Formalized Music: Thought and Mathematics in Music, additional material compiled and edited by Sharon Kanach (rev. ed.), Stuyvesant, New York, Pendragon.
XENAKIS, Iannis (1953/54), Metastaseis (B) (score ISMN 9790060029998), London, Boosey and Hawkes.
XENAKIS, Iannis (1955/56), Pithoprakta (score BH 03801), London, Boosey and Hawkes.
1 The following chapter is largely based on Notes on A Catalog of Difference as it was presented for the occasion of the Meta-Xenakis Global Symposium on 30 September 2022 in New York City. This chapter is dedicated to the memory of Peter Lloyd Jones (1965–2022). Footnotes will be used for expanding on the original presentation, either for the purposes of re-introducing content that had been edited for time, or for additional comment and elaboration that came about as a result of conversation during the symposium.
2 Lucia, 2017. The research conducted for this 2017 instantiation of the project was undertaken and supported through the Cass Gilbert Visiting Fellowship in the School of Architecture, University of Minnesota and generously funded therein. A very special thanks to Zhetao Dong, Samantha Kowalke, and Mohsin Khokhar, my undaunted research assistants without whom this would not have been possible.
3 Showings have included the premiere exhibition at the Goldstein Museum of Design, HGA Gallery, Rapson Hall University of Minnesota, February through April, 2017; at usagiと_newyork, October, 2017; and as part of a group show with Young and Ayata for DRAWBOT #2: Post Digital Drawing in Architecture and Art, 9 February through 3 March 2018 at the AA[n+1], curated by Emmanuelle Chiappone-Piriou and Leslie Ware.
4 Lucia, 2008. My graduate architecture thesis, presented in 2008 at the University of Pennsylvania, School of Design, was largely informed by my research into particular twentieth century avant-garde music composition and theories including those of, among others, Morton Feldman (1926–87), Karlheinz Stockhausen (1928–2007), John Cage (1912–92), Steve Reich (b. 1936), Alvin Lucier (1931–2021), György Ligeti (1923–2006), and importantly Iannis Xenakis. Specifically, I found inspiration in Xenakis’s production of new compositional methods, which required invention towards the pursuit of novel aural material rooted in systems and information theory, and a way of thinking about the material world in a granular manner.
5 See, for instance, Xenakis, 1992, p. 242–54. The whole of Chapter IX, “New Proposals in Microsound Structure” is concerned specifically with the inherited system of Fourier harmonic analysis, its inherent biases and limitations.
6 Ibid., p. 5–8, 192, 207–8 for Xenakis’s critique of serialism.
7 As a member of LabStudio I questioned issues inherent to the biological sciences that I had been similarly critical of within architecture; many of the adopted (and trusted) quantitative and qualitative visualization tools deployed in the biological sciences were similarly born of geometry (cell segmentation, for example), a tool unfit for the noisy, non-bounded and non-fixed biological material in question. See, for example, Lucia, 2013 and especially Lucia, 2018.
8 See Lucia et al., 2014. This conference paper, presented at the Music in Architecture-Architecture in Music symposium at the University of Texas at Austin, was the first, and to date only, text to explicitly outline the connections between the material-spatial theories of Xenakis and the tools that would eventually form the basis of A Catalog of Difference.
9 Reproduced in Xenakis, 1992, p. 2–3.
10 This differs from Xenakis’s design of light through the Polytopes in that The Catalog of Difference comprises the analysis of existing structures rather than their generation.
11 Xenakis, 1992, p. 4.
12 While all matter is, in a sense, non-stable, the use of the term stable matter here refers to that which would be so in relation to human perceptual time scales, i.e. architecture and other “fixed” environments, etc.
13 The legacies questioned by Xenakis in Formalized Music directly paralleled conversations in which I was surrounded in 2008 during my graduate architecture education, namely those involving discussions of the novel production of affect. These 2008 discussions were occurring amidst an onslaught of newly developed geometric playgrounds made possible by radical advancements in architectural computation. While on the one hand these new computational capabilities were able to generate novel tools, methods of production and formal outcomes, they were simultaneously mired in centuries old languages of architectural legacy—namely those of descriptive and projective geometry—and thus not free of their inadequacies.
14 I am thankful to Olga Touloumi and Anton Vishio who, during the discussion portion of the symposium, reminded me of the pioneering works into cybernetics and perception by Abraham Moles (1920–92), with whom Xenakis was known to have been introduced and held discussions concerning information and aesthetics. The notes on these meetings, according to Touloumi, reside in Paris. (Moles, 1968).
15 I am thankful for my introduction to Bateson that came at the insistence of David Salomon, who had been familiar with my line of research into difference and information theories through Xenakis.
16 The phrase differences that make a difference is adapted from the original, “…what we mean by information—the elementary unit of information–is a difference which makes a difference…” (Bateson, 2000, p. 459).
17 Bateson, 2002, p. 64.
18 Ibid., p. 27.
19 Another notable figure of importance to this discussion, and whose theories also influenced the development of the Catalog, is the perceptual psychologist James J. Gibson (1904–79). Gibson’s Ecological Approach to Visual Perception posited ambient optic arrays of visual information. Again, for Gibson, a notion of difference is fundamental to the production and perception of visual information, “Only insofar as ambient light has structure does it specify the environment. I mean by this that the light at the point of observation has to be different in different directions (or there have to be differences in different directions) in order for it to contain any information. The differences are principally differences of intensity.” (Gibson, 1986, p. 51).
20 I am thankful to James Harley who, during the discussion portion of the symposium, encouraged a revisiting of Xenakis’s later writings that concern one’s being inside or outside time, and its perception. These concepts are notably elaborated on in Chapter 10 of Formalized Music, “Concerning Time, Space and Music.” In one especially relevant passage concerning difference and one’s being “inside or outside” of time Xenakis speculates, “What is the flux of time which passes invisibly and impalpably? In truth, we seize it only with the help of perceptive reference-events, thus indirectly, and under the condition that these reference-events be inscribed somewhere and do not disappear without leaving a trace.” He would continue, “[…] if events were absolutely smooth, without beginning or end, and even without modifications or ‘perceptible’ internal roughness, time would likewise find itself abolished. It would seem that the notion of separation, of bypassing, of difference, of discontinuity, which are strongly interrelated, are prerequisite to the notion of anteriority. In order for anteriority to exist, it is necessary to be able to distinguish entities, which would then make it possible to ‘go’ from one to the other. A smooth continuum abolishes time, or rather time, in a smooth continuum, is illegible, inapproachable.” (Xenakis, 1992, p. 262).
21 Ibid., p. 1–78.
22 Ibid., p. 373.
23 Ibid., p. 51.
24 Modifications to the standard equation for information [H = –∑ pi log2 pi] are made in order to give priority to moderate [H = –∑ log2 pi] and rare [H = –∑ 1/pi log2 pi] events within the pixel field.
25 Portions of the following were adapted from Lucia, 2017.
26 This latter spherical type of projection has always physically existed but has largely been conceptually neglected at the expense of neatly framed and geometrically managed windows to the world—those mediating devices that separate us from our environments.
27 Gaussian curvature is implicitly differential. That is, Gaussian curvature has embedded within its measure an intrinsic account of instantaneous rates of change at any discrete point along a given surface, defined as the product of the principal curvatures, K=k1⋅k2.
28 I would like to additionally and warmly thank Sharon Kanach for reaching out and inviting me to submit an abstract for consideration to this remarkable global symposium, and for her unflinching dedication to the legacy of Iannis Xenakis, of which her organization and leadership of this event is evidence. Many thanks, also, to Carey Lovelace, Barbara Mackenzie, and to the Xenakis Project of the Americas in helping to make this event a resounding success.