
13. Building the scientific and analytical framework for Dynamic Ocean Management
Elliott L. Hazen,1 Briana Abrahms, Hannah Blondin, Kylie Scales and Heather Welch
©2025 Elliott L. Hazen, et al., CC BY-NC-ND 4.0 https://doi.org/10.11647/OBP.0395.13
The combined impacts of climate change, coastal development, and intensifying use of the ocean are leading to rapid and widespread changes in the structure and function of marine ecosystems (Halpern et al., 2019). As species respond to new environmental regimes and anthropogenic threats redistribute and intensify (Figure 13.1), species management plans based on static approximations of biodiversity distribution may become rapidly outdated and therefore ineffective (Hazen et al., 2018; Oliver et al., 2018; Oestreich et al., 2020). Adaptive management approaches use repeated expert assessment to adapt management approaches during a management cycle to allow for timely intervention in the processes that link population status and anthropogenic threats, so they are particularly useful for threat mitigation under changing conditions (Maxwell et al., 2015). A drawback of such approaches, however, is that they require expert elicitation to update any information that goes into making management decisions, which can slow the process (Wilson Jono et al., 2018; Lomonico et al., 2021). Dynamic ocean management automates the process of updating management decisions as new information and data become available, and so can offer greater opportunity for climate-ready management by allowing more rapid responses to changing ocean conditions (Maxwell et al., 2015. Welch et al., 2019a; Maxwell et al., 2020).
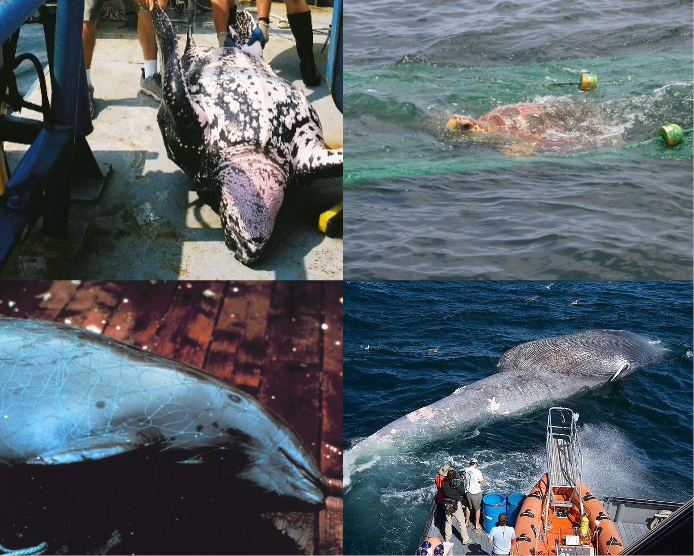
Fig. 13.1 Interactions between protected species and human uses of the ocean are leading to new risks and unwanted mortality. a) Leatherback turtles (ELH) and b) loggerhead turtle in shrimp trawls in the Gulf of Mexico (ELH), c) Harbor Porpoise entangled in a gillnet (CC), d) blue whale struck by a ship (CC).
Dynamic ocean management (DOM) is an approach to managing marine resources that ‘changes rapidly in space and time in response to the shifting nature of the ocean and its users based on the integration of new biological, oceanographic, social and/or economic data in near real-time’ (Maxwell et al., 2015). The key difference to more conventional adaptive management is that, in DOM, an initial set of ‘control rules’ for management decisions are chosen, and then management decisions are made based on incoming data in accordance with the control rules, as opposed to requiring expert elicitation at each step. An example of a control rule would be: “If spatial models predict fisheries bycatch risk—the incidental capture of non-target species—above a specific threshold in a given area, that area can be closed to fishing” (Howell et al., 2008; Hobday et al., 2011; O’Keefe and DeCelles, 2013; Hazen et al., 2018; Breece et al., 2021). In this scenario, expert opinion is not needed to adjust the management decision. This approach enables more fluid management strategies that can be frequently and automatically adjusted, allowing management decisions to reflect biological, environmental, economic, and social conditions in real time and with the goal of continuous separation between species of conservation concern and anthropogenic threats (Lewison et al., 2015; Dunn et al., 2018; Hazen et al., 2018). But initial efforts to operationalize DOM tools can be more onerous than other adaptive management approaches, since there are inherent requirements that a) data are regularly collected, b) clear decision rules are implemented and remain effective across changing conditions, and c) results are regularly delivered to managers or resource users (Hobday and Hartog, 2014; Welch et al., 2019a).
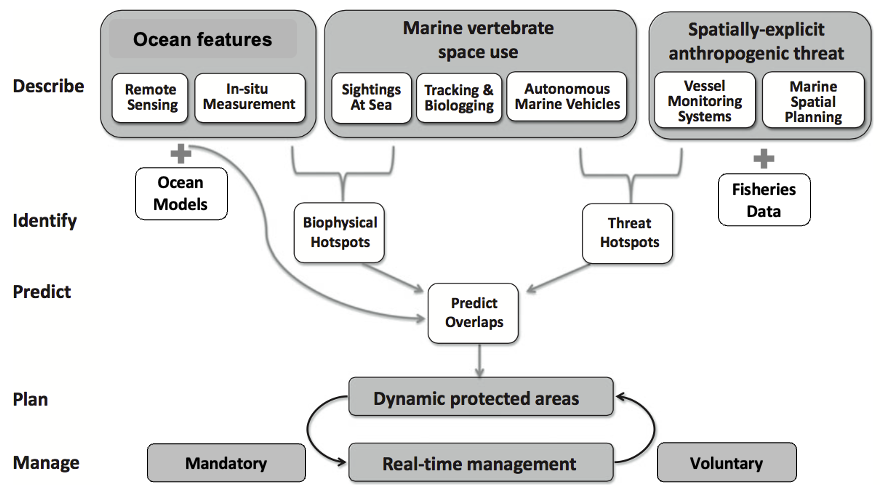
Fig. 13.2 Dynamic Ocean Management flowchart (adapted from Scales et al., 2014). Data on ocean features, biological space use, and threats can be combined to predict overlaps in time and space. Real time DOM implementation can be mandatory (e.g., tuna in eastern Australia; Hobday and Hartog, 2011) or voluntary (e.g., TurtleWatch).
While dynamic management is increasingly explored for use in marine resource management, it is not unique to marine systems (Oestreich et al., 2020). For example, automated predictions are used by air traffic control to assign runways, arrivals, and departure times based on weather conditions; for travel duration estimates in maps that update continuously based on real-time traffic data; and in weather prediction where nowcasts and forecasts inform multiple scales of planning for a wide range of applications from agriculture to tourism (Welch et al., 2018; Oestreich et al., 2020). In marine systems, DOM tools have been developed to predict harmful algal blooms (Anderson et al., 2015); reduce whale ship strikes and entanglements (Hazen et al., 2017; Meyer-Gutbrod et al., 2018; Abrahms et al., 2019); reduce fisheries bycatch (Howell et al., 2008; Hobday et al., 2011; O’Keefe and DeCelles, 2013; Howell et al., 2015; Hazen et al., 2018; Breece et al., 2021); and improve the efficiency of fisheries by predicting the dynamic distributions of target species (Spillman and Hobday, 2014; Hobday et al., 2018). These approaches integrate new data into the decision-making process, for example from the previous day’s bycatch numbers (O’Keefe and DeCelles, 2013) or oceanography-based models that use species-environment relationships to predict species distributions (Hobday et al., 2011; Hazen et al., 2018; Abrahms et al., 2019) which can automatically provide advice, or, with control rules, can automatically provide management actions without the need for user input or manual adjustments (Figure 13.2). DOM can rely on sophisticated, data-driven analytical approaches that incorporate a range of datasets and cross disciplinary boundaries, and it is therefore a progressive and rapidly developing field with emerging applications that support the resilience of marine resource extraction industries against the impacts of climate change. In this chapter we discuss the different approaches to DOM, from data, to analytics, to decision-making, to guide DOM implementation in new regions. We end with future directions of DOM in supporting climate-ready fisheries and navigating the novel human-wildlife conflicts our ecosystems are facing.
DOM analytical approaches
Dynamic ocean management tools rely on biological, environmental, economic, and/or societal data (Lewison et al., 2015; Oestreich et al., 2020), frequently in combination, to describe features of management relevance (Figure 13.2). Of these, biological and environmental data are most commonly used. Biological data can be collected by fisheries observer programs (Hazen et al., 2018), logbooks (O’Keefe and DeCelles, 2013; Merrifield et al., 2019), satellite telemetry data (Hazen et al., 2018), acoustic receivers (Clark et al., 2005; Breece et al., 2021), eDNA (Gallego et al., 2020), citizen science data (Wiley et al., 2013), and aerial or shipboard surveys (Becker et al., 2020). Environmental data are frequently sourced from Earth Observation satellites (Hobday et al., 2010; Hartog et al., 2011; Dierssen et al., 2015; Anderson et al., 2016), or ocean model products (Abrahms et al., 2019; Welch et al., 2020) (Figure 13.2). A range of simple to complex DOM tools exist based on the species being managed, the data available, and the technological capacity of the end users (Figure 13.3, Box 13.1). Below we describe four different ways DOM tools utilize biological and environmental information to inform real-time management (daily to monthly): aggregation and summation, heuristic algorithms, predictive models, and synthetic tools that combine two or more methods.
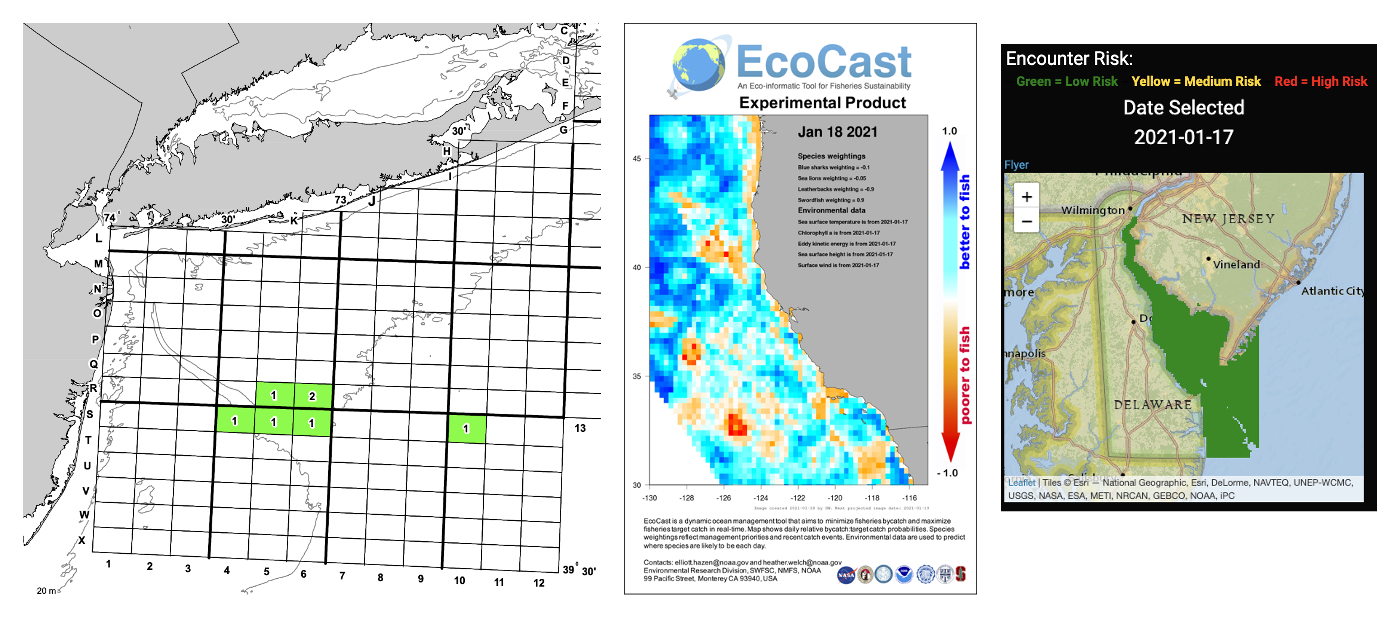
Fig. 13.3 Examples of North American products for dynamic ocean management. a) SMAST product for Atlantic scallop fisheries on the east coast of the US avoid bycatch of yellowtail and window pane flounder (also delivered as text-based zones), b) EcoCast product for swordfish to avoid bycatch of leatherback turtles, sea lions, and blue sharks, and c) ASMR product to avoid fishery interactions with Atlantic Sturgeon. These products can be delivered as a map (shown here) but a) & c) via text message as well for fishers with only limited cell access.
Box 13.1
DOM approaches can be simple to complex. These examples show how the various approaches have been implemented throughout north America.2
Aggregation and summation
The simplest and most reliably tested form of dynamic ocean management is based on the aggregation and summation of pooled biological data such as fisheries logbooks or observer data (O’Keefe and DeCelles, 2013; Hobday and Hartog, 2014; O’Keefe et al., 2014; Lewison et al., 2015; Dunn et al., 2016; Keith et al., 2020; Oestreich et al., 2020). For example, in applications that seek to minimize bycatch in commercial fisheries, logbook or observer data on bycatch events can be shared in real time via mobile devices (Merrifield et al., 2019) or aggregated and shared a day later (Gilman et al., 2006; O’Keefe and DeCelles, 2013). Similar approaches are implemented to reduce ship-strike risk to North Atlantic right whales (Eubalaena glacialis) when three or more right whales are sighted within a discrete area, termed Dynamic Management Areas (Meyer-Gutbrod et al., 2018). These are put in place alongside existing seasonal and static ship speed restrictions to provide extra layers of confidence to management strategies that seek to protect threatened species in heavily trafficked or rapidly changing ecosystems.
As with all DOM applications, there are benefits and drawbacks of reliance on real-time biological data for informing management decisions. Aggregation and summation-based DOM approaches rely on timely delivery of biological data rather than environmental data. As such, regular surveys, observer programs (O’Keefe and DeCelles, 2013), or acoustic data (Meyer-Gutbrod et al., 2018; Baumgartner et al., 2019) must be maintained to ensure that dynamic management approaches are updated as conditions change. Observational data can be used to close an area to fishing in the case of bycatch, reduce ship speeds in the case of ship-strike risk, or to dictate move-on rules where fishing is displaced based on real-time observations of bycatch events (Dunn et al., 2016). Real-time observational biological data are a “gold standard” for DOM since the data are direct measures of species occurrence rather than model-based inferences. These data can provide greater confidence in the DOM process, particularly when species’ movement rates are low (Dunn et al., 2016). However, aggregation and summation approaches will be biased towards where the observers or surveys are, in contrast to model-based inference than can extrapolate in space and time. Additionally, gaps in data collection due to unpredictable events such as inclement weather, phenomena such as COVID-19, or movement of species beyond their historical ranges (Davies and Brillant, 2019; Rutz et al., 2020), can render aggregation and summation approaches less effective (Meyer-Gutbrod et al., 2018; Rutz et al., 2020). Furthermore, for fisheries-dependent data, such data-pooling approaches require high trust in the fishery as they call for accurate and transparent reporting. Some of the most successful aggregation and summation approaches have used either bycatch pooling, where participants receive a greater bycatch quota for reporting incidents (O’Keefe and DeCelles, 2013), or an industry-run approach towards data pooling and sharing (Gilman et al., 2006; Merrifield et al., 2019).
Heuristic algorithms
A second type of dynamic ocean management approach relies on heuristic algorithms, i.e., rule-based rather than model-based approaches, to describe the relationships between target features or species of management interest and the physical environment, with the ultimate aim of identifying and predicting the presence of target features or species in near real time. For example, TurtleWatch (Howell et al., 2008) uses an algorithm that describes the relationship between endangered loggerhead turtles (Caretta caretta) near Hawaii and sea surface temperature (SST) in order to identify areas to avoid fishing to reduce loggerhead bycatch each day.3 Similarly, the Temperature Observations To Avoid Loggerhead (TOTAL) tool (Welch et al., 2019b) uses an algorithm that captures the relationship between loggerhead turtles and SST anomalies to guide the timing of the Loggerhead Conservation Area in the Southern California Bight.4 Coral Reef Watch (Liu et al., 2006) uses an algorithm that describes the relationship between coral bleaching events and temperature in order to predict bleaching hotspots each day. Similar algorithms have been developed to identify Harmful Algal Blooms (Kavanaugh et al., 2013; Anderson et al., 2016), and to identify Sargassum blooms (Dierssen et al., 2015) for the benefit of faster management responses.
Algorithm-based tools have the advantage of being relatively simple to develop and operationalize compared to tools that rely on predictive models or synthetic tools. They also alleviate challenges associated with the real-time data collection that aggregation and summation-based tools rely on, since algorithm-based tools often use remotely sensed data or data-assimilative ocean models (Figure 13.2). However, this simplicity comes at the cost of flexibility: algorithm-based tools assume stationary relationships between target features and environmental information. As climate change continues to accelerate and produce anomalous environmental conditions, these relationships can break down (Muhling et al., 2020) as species are forced to form new habitat associations or novel threats emerge. Additionally, algorithm-based tools frequently rely on relationships between target features and a single environmental variable, such as temperature, while in reality, species distributions can be driven by multiple environmental factors. These complex species-environment relationships can be more accurately captured by species distribution models (SDMs), which are able to describe multivariate relationships. However, SDMs are data-hungry, requiring a significant amount of biological data in order to build robust and high-performing models. When there is a paucity of biological data, the relatively parsimonious algorithm-based tools may be necessary.
Predictive models
A third type of dynamic ocean management approach relies on data from predictive models, which can fall into the category of species distribution, or habitat, models (SDMs) or less commonly mechanistic models (Fiechter et al., 2016). SDMs relate species occurrence to environmental variation in order to predict species distributions in novel locations and times, and they are increasingly used in spatial planning (Elith and Leathwick, 2009). When applied to dynamic ocean management, SDMs use dynamic environmental variables that can provide predictions of species occurrence at temporal scales relevant to the timescales needed to make management decisions (Gallego et al., 2020). For example, oceanography-based species distribution models can be automated to update species distributions as new physical variables come in (Hazen et al., 2018; Abrahms et al., 2019; Becker et al., 2019). With the advancement of statistical modeling approaches and the availability of high-resolution environmental data, examples of SDMs developed for DOM are rapidly growing. For example, the Atlantic Sturgeon Risk Model provides daily predictions of endangered Atlantic sturgeon (Acipenser oxyrhynchus oxyrhynchus) in the mid-Atlantic based on an SDM with the goal of minimizing interaction with human activities (Breece et al., 2018; Breece et al., 2021). In contrast, the Tuna Seasonal Forecast System uses an SDM to forecast southern bluefin tuna (Thunnus maccoyii) distributions in the Great Australian Bight in order to maximize catch (Eveson et al., 2015). EcoCast 5offers a novel combination of these goals by providing daily SDM predictions for target species (swordfish Xiphias gladius; Scales et al., 2017) and non-target bycatch species along the U.S. West Coast to help fishers and managers better allocate fishing effort to optimize catch while minimizing accidental bycatch (Hazen et al., 2018).
Predictive models alleviate many of the challenges associated with relying on aggregation and summation or heuristic rules. The predictive nature of such tools allows for a regular stream of near-real-time, and in some cases forecasted, data. In the widely adopted case of species distribution models, the ability to predict species occurrence spatially has demonstrated value for informing management decisions that are spatial in nature, such as time-area closures, protected area designation, zoning development decisions, and more. Because predictive models in a DOM context incorporate recent or forecasted physical variables, they can ensure that DOM approaches are climate-ready (Hazen et al., 2018; Holsman et al., 2019), with the caveat that predictive skill of management information remains high under anomalous environmental conditions (Muhling et al., 2020). These approaches require data on both species occurrences and underlying environmental or habitat conditions, and, given their complexity, take significant effort to build and validate. As such, a wide literature exists regarding best practices for developing (Araújo and New, 2007; Elith and Leathwick, 2009; Barbet‐Massin et al., 2012; Robinson et al., 2017; Derville et al., 2018) and evaluating (Allouche et al., 2006; Fourcade et al., 2018) SDMs. In addition, the spatial or temporal resolution of predictive models are only as good as the underlying environmental data upon which they rely. For instance, WhaleWatch (fisheries.noaa.gov/west-coast/marine-mammal-protection/whalewatch), an SDM product for blue whales (Balaenoptera musculus) developed to reduce whale-ship collisions, relied on satellite-derived oceanographic variables provided at a monthly resolution (Hazen et al., 2017); however, an updated version of the tool, WhaleWatch 2.0 (https://coastwatch.pfeg.noaa.gov/projects/whalewatch2/), uses oceanography derived from a data-assimilative ocean model which allows for predictions at a daily timescale (Abrahms et al., 2019).
Synthetic tools
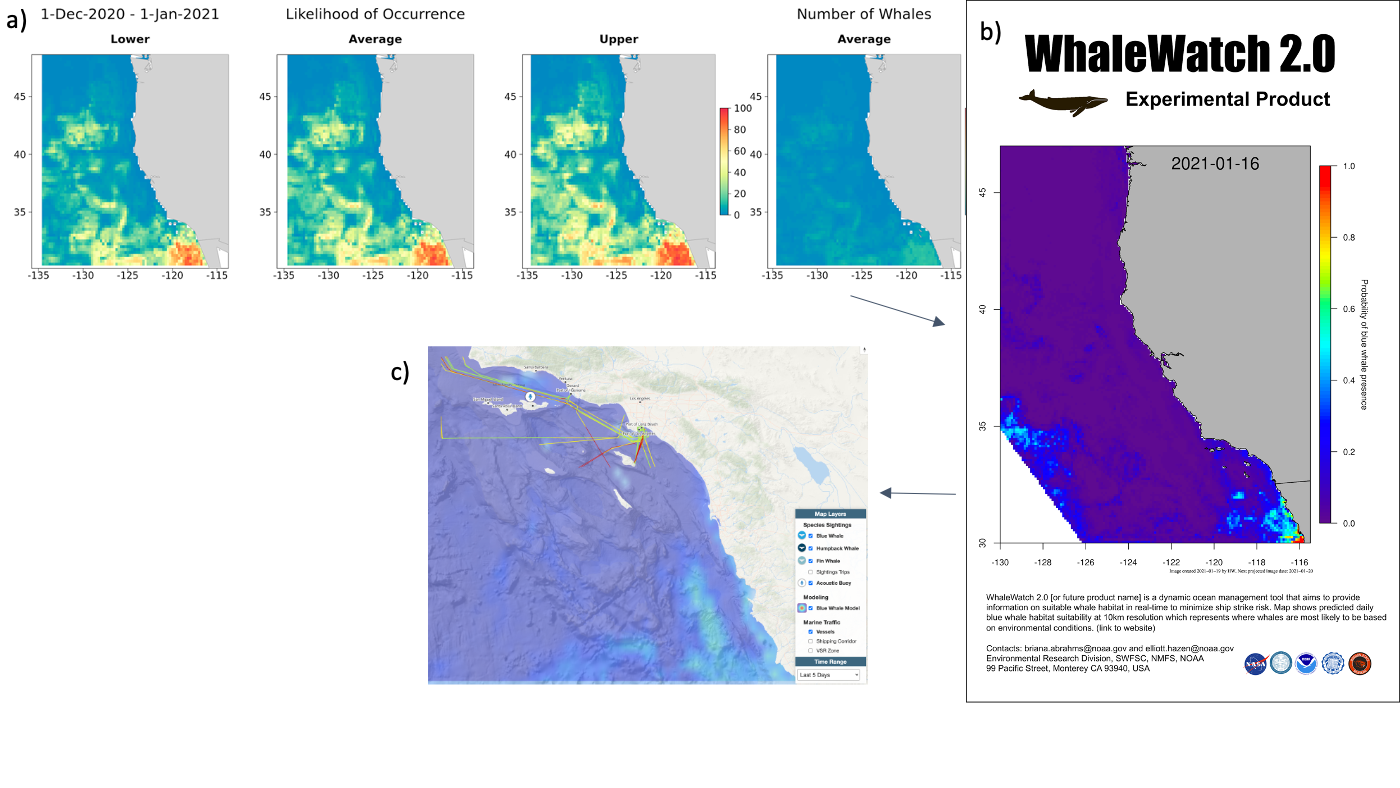
Fig. 13.4 Evolution of dynamic ocean management approaches to reduce ship strike risk for blue whales (WhaleWatch) and implementation alongside multiple data types. a) WhaleWatch built on satellite data at monthly resolution, https://www.fisheries.noaa.gov/west-coast/marine-mammal-protection/whalewatch (Hazen et al., 2017), b) WhaleWatch 2.0 built on ocean model output at daily resolution, https://coastwatch.pfeg.noaa.gov/projects/whalewatch2/whalewatch2_map.html, Abrahms et al., 2019, and c) WhaleSafe.com which ingests WhaleWatch 2.0 model output alongside acoustic, and visual sightings-based tool for reducing whale ship strike risk.
Synthetic tools bring together multiple datasets or multiple DOM approaches to allow users to leverage the strengths of multiple informational data streams within the decision-making framework. Two examples of the implementation of synthetic tools for dynamic ocean management occur along the U.S. West Coast and focus on mitigating the take of large whales. WhaleSafe6 integrates a predictive whale distribution model (WhaleWatch 2.0; Abrahms et al., 2019; Figure 13.4), acoustic detections (Baumgartner et al., 2019), and visual observations of whales to alert transiting ships of the risk of whale-ship collisions in the waters surrounding two of the West Coast’s busiest shipping ports. Similarly, the California Department of Fish and Wildlife and partners have developed a seasonal Risk Assessment and Mitigation Program7 that evaluates ocean and forage conditions and multiple data sources on whale concentrations to inform dynamic closures to the Dungeness Crab fishery, which has seen a significant rise in large whale entanglements in recent years (Santora et al., 2020). Both of these synthetic tools combine aggregation and summation with predictive models.
By integrating multiple types of DOM tools, and often multiple data sources, synthetic tools are arguably the most robust for use in management because they inherently reduce reliance on any one given data stream. In the event of a data gap from one source, for instance, the alternative data streams enable the tool to still be used to inform management. Additionally, multiple data sources reduce uncertainty or noise associated with any single type of data source. However, operationalizing synthetic tools can present a technical challenge, particularly if data streams must be integrated in near real-time. Furthermore, researchers or managers developing synthetic tools must devise decision trees for how different data sources will be considered and weighted in the final product. For example, WhaleSafe takes a conservative approach in which the integrated “whale presence rating” (ranging from low to very high) is determined based on the highest individual rating any of its three constituent data streams reaches. However, because the rating associated with the predictive whale distribution model has greater uncertainty than that derived from visual or acoustic detections, the distribution model can only lead to a “low” or “medium” rating. How different data types are weighted in a combination tool will depend on a range of factors, such as the uncertainty or the likelihood of false positives or negatives associated with a data type, the consistency of data access (for example in the case of intermittent survey data), or how different data sources are valued.
While predictions of species distributions are valuable outputs of operational DOM, predictions of other ecological parameters would prove useful in identifying management strategies and interventions. Other useful population parameter forecasts could include infectious disease outbreaks in a population, body condition, and quality of seafood product (Pirotta et al., 2018; Bolin et al. 2021)—this is already done on land to dynamically manage the transmission of brucellosis from bison to cattle near Yellowstone National Park (Hobbs et al., 2015). Similarly, population parameter forecasts could inform adaptive survival strategies (Pirotta et al., 2018), such as how jumbo squid shorten their lifespans and reproduce earlier in response to warming conditions within the Gulf of California (Frawley et al., 2019). There are also ample opportunities to apply DOM outside of fisheries applications (Anderson et al., 2016; Hazen et al., 2017). Beyond the ship strike examples mentioned earlier (e.g., whalesafe.com), other sectors and maritime activities to consider include offshore wind production, waste discharge from cruise ships, seismic exploration, tourism, naval SONAR testing, and addressing marine ecosystem protection targets (Butchart et al., 2016).
Nuts and bolts of Dynamic Ocean Management
Operationalizing dynamic ocean management tools follows a four-stage framework consisting of Acquisition, Prediction, Dissemination, and Automation (Welch et al., 2019a). In the Acquisition stage, near real-time or forecasted biological, environmental, ecological, and/or societal data are collected (Lewison et al., 2015). These data are used to identify the locations of target features or species, and/or to predict them under novel conditions. For example, in this stage, tools that rely on aggregation and summation will acquire new data on recent bycatch events (Gilman et al., 2006; O’Keefe and DeCelles, 2013) or recent species sightings (Meyer-Gutbrod et al., 2018). Tools that rely on heuristic algorithms and predictive models will acquire new environmental data from satellites (Howell et al., 2008; Hazen et al., 2017; Hazen et al., 2018; Breece et al., 2021) or regional ocean models (Hobday et al., 2011; Brodie et al., 2018; Abrahms et al., 2019; Welch et al., 2020).
In the Prediction stage, newly acquired data are post-processed into the final product that communicates management recommendations. For tools that rely on aggregation and summation, this stage involves summarizing newly acquired species data into actionable products. For tools that rely on heuristic algorithms or predictive models, the predetermined algorithm or model is applied to newly acquired environmental data to identify or predict where target species or features are likely to be.
In the Dissemination stage, these final products are distributed to end users, who may be resource managers, resource users, or the general public. Final products may be disseminated as mapped images (Hazen et al., 2017; Hazen et al., 2018; Abrahms et al., 2019; Figure 13.3), indicators (Welch et al., 2019b), written georeferenced descriptions (O’Keefe and DeCelles, 2013; Breece et al., 2018), or spatially-explicit georeferenced files such as comma-separated values (CSVs) with latitude/longitude coordinates, Google Earth KMZ files, network Common Data Forms (netCDFs), or shapefiles (Liu et al., 2006; Hazen et al., 2018). These final products are disseminated across a variety of pathways, including persistent URLs (Hazen et al., 2018; Abrahms et al. 2019), websites (Howell et al., 2008; Howell et al., 2015; Welch et al., 2018), text messages (Breece et al., 2021), or smartphone apps (Wiley et al., 2013). Dissemination formats and pathways are not mutually exclusive, and often several methods are used within the same tool to meet the various needs and technical capacities of multiple end users.
In the Automation stage, the Acquisition, Prediction, and Dissemination stages are integrated together to produce streamlined workflows that operate over the prescribed temporal scale of the tools, for example, daily (Hazen et al., 2018), weekly (Kavanaugh et al., 2013), or monthly (Hazen et al., 2017). This stage knits together the disparate code libraries of the previous stages into one unified workflow and may involve integration across multiple coding platforms. See a detailed discussion of temporal scale in the section below titled “Multi-species, multi-stressor, multi-scale.” Below we discuss the next generation of DOM tools, and specifically, ways that human uses of the ocean and new data types can be merged to provide management advice such as 1) automated management approaches, 2) bringing in traditional knowledge to the quantitative DOM approach, and 3) incorporating more species, more stressors, and more management needs into single tools to better evaluate tradeoffs in a changing world.
Future of Dynamic Ocean Management
Models as a part of the management toolbox
While most dynamic management modeling approaches rely on correlative species distribution models (Lewison et al., 2015), there is a growing effort to include mechanistic models including individual-based movement models (Dodson et al., 2020), mechanistic movement, bioenergetic and population models (Fiechter et al., 2016), or more broad ecosystem models (Fulton et al., 2014). Analogous to general climate models (GCMs), which simulate the physical and chemical interactions within the earth’s land, ocean and atmosphere that drive climate, general ecosystem models, which simulate ecological mechanisms and ecosystem behavior, could dramatically improve our understanding of the global ecosystem and change the way management and policy decisions are made (Purves et al., 2013). For example, the ability to understand how ecosystems work as a whole, as well as the broad-scale structure and function of the biosphere, would enhance our abilities to predict population distributions and abundance. While regional ocean models simulate how a particular region of the ocean responds to various physical forcings, the additional simulation of key ecological processes such as foraging, reproduction and mortality could inform how these processes change on a global scale in response to multiple stressors such as diseases, invasive species, and climate change (Purves et al., 2013). These models would provide valuable information on the vulnerability of species to multiple stressors and guide decisions of conservationists from local to international levels (Crespo et al., 2020; Visalli et al., 2020). Forecasts of future ocean conditions become even more important in the context of a quickly changing climate, reinforcing the need for holistic and dynamic approaches to both predictive models and management (Hobday et al., 2017; Purves et al., 2013).
Validation from non-traditional sources
Using additional data sources to validate predictions and forecasts is an important step towards building and maintaining dynamic management tools. Models can be validated internally by separating the data into a training and testing data set, or they can be validated on out-of-bag data to ensure the broad applicability of models (Abrahms et al., 2019; Woodman et al., 2019; Figure 13.5). Recently environmental DNA (eDNA) has proven to be an efficient, low-cost method in the assessment of species abundance (Shaw et al., 2016, Tillotson et al., 2018). One recent study found that eDNA closely tracked the rise and fall of salmon numbers in a creek after accounting for local environmental and biological conditions, providing an essential advancement in understanding the relationship between animal abundance and detectable genetic material (Tillotson et al., 2018). Further research in this arena could scale up the capacity for using genetic technologies for model validation. Other techniques for validation include unmanned vehicles and aircraft systems, which, in tandem with accompanying detection algorithms, provide options for cost-effective high-resolution data (Johnston, 2019). Alternatively, traditional ecological knowledge and local ecological knowledge have proven valuable in filling data gaps or validating biophysical models, particularly in data-poor regions of the world (Mason et al., 2019; Skroblin et al., 2021). In the case of the Peruvian shark fishery (Mason et al., 2019), the authors found strong agreement among expert-based variable mapping of temperature and chlorophyll isopleths, participatory mapping approaches, and quantitative species distribution models. This is a great example of how a variety of these approaches could be used to implement dynamic ocean management measures while also showing how integrating across data types could increase robustness.
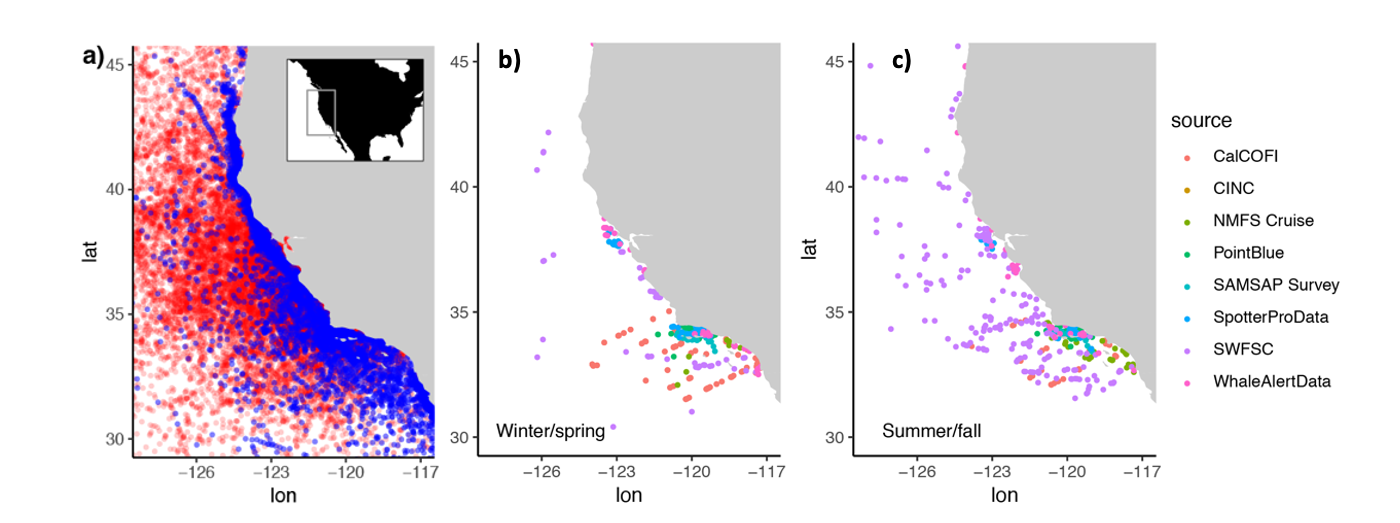
Fig. 13.5 Examples of the pieces of dynamic ocean management for WhaleWatch 2.0. A) Presence data from ARGOS tags and generated absences from the CCS used in WhaleWatch modeling. B) Winter/spring (left) and C) summer/fall (right) distributions of N=3,413 independent blue whale sightings data in the California Current. Modified from Abrahms et al., 2019–supplement.8
Multi-species, multi-stressor, and multi-scale
The recent push to adopt dynamic approaches for more traditional area-based management techniques (ABMTs) like Marine Protected Areas (Hyrenbach et al., 2000; Maxwell et al., 2020) represents an opportunity to scale up DOM to accommodate multiple species, multiple stressors, and multiple scales. To date, DOM approaches have generally been designed to mitigate one stressor to one species at one spatial or temporal scale. There are only a few examples of DOM approaches that address either multiple species—for example the EcoCast tool accommodates four species—or multiple scales, with WhaleWatch 2.0 offering coarse and high-resolution predictions across the California Current and Southern California Bight, respectively; these examples are the exception to the rule. For DOM to be amenable to use in traditional area-based management scenarios, the field must expand beyond these single-target scenarios. Multi-use approaches allow decision makers to attenuate impacts of cross-sectoral stressors on marine resources by regulating the distribution, timing, and intensity of industry activities (Ban et al., 2014; Wright et al., 2019). While dynamic management has mainly focused on direct threats to organisms (e.g., ship strikes, bycatch), indirect and diffuse threats such as seismic surveys and ocean noise are also significant (Pirotta et al., 2019; Maxwell et al., 2020) and should be incorporated in multi-use analyses. However, there is a point of diminishing returns, where the performance of DOM tools becomes compromised as additional species, stressors and scales are added (Welch et al., 2020; Smith et al., 2021). Further work is needed to identify tipping points in the trade-off between inclusion and efficiency, which will often be system specific.
As described by Crespo et al. (2020), the application of dynamic approaches depends on timescale, including both the lead time needed to apply projects to a management decision and the application of the management decision itself (Tommasi et al., 2017):
- Real-time or near-real-time predictions can be used to mitigate adverse impacts of sectoral uses, while also increasing their efficiency (e.g., catch of a target species; Crespo et al., 2020). Frequent and accurate measurements resulting in high-quality input data are key in producing models in which the predictions are trustworthy enough for decision makers (Purves et al., 2013; Petchey et al., 2015).
- Intra-annual/seasonal applications depend on the forecasts of physical and biological variables (Jacox et al., 2020) which drive distributions of higher trophic levels and can help to predict species’ migrations. Dynamic management at this temporal scale can allow for the isolation of areas of highest risk before negative interactions are likely to occur (Crespo et al., 2020).
- At the decadal scale, predictions can be made with a goal of developing multi-year forecasts (Hobday et al., 2018) to predict anomalous conditions that may cause regime shifts. Managing for this scale will ensure irreversible damage does not occur to populations who shift outside of typical ranges, as management has been historically slow to adapt in response to shifting species distributions (Crespo et al., 2020). These forecasts can also inform rebuilding plans and long-term industry capitalization (Tommasi et al., 2017).
- DOM tools can be used to explore the multi-decadal scale to predict major shifts in the distribution of populations as well as changes in the size of core habitats (Hazen et al., 2013). Within this management framework, we can forecast the effectiveness of area-based closures, and changes in negative interactions between populations and multi-sector uses of the marine environment, to ensure the resilience and sustainability of our oceans (Tommasi et al., 2017; Crespo et al., 2020).
Particularly relevant to multi-year and multi-decadal temporal scales, dynamic approaches to ABMTs would allow managers to “futureproof” the protection of species before they move and their distributions change (Maxwell et al., 2020). By mitigating interactions between multi-sectoral uses and at-risk populations before they occur, managers can respond to threats that occur dynamically in the present and build climate responsiveness for the future.
For management to be most effective and adaptive to a changing climate, dynamic approaches will also need to be considered in areas beyond national jurisdiction (Maxwell et al., 2020). Building from examples of domestic DOM, measures in the high seas could provide less restrictive measures for anthropogenic uses and may be more practical to protect many wide-ranging and migratory species (Crespo et al., 2020; Maxwell et al., 2020).
Box 13.2
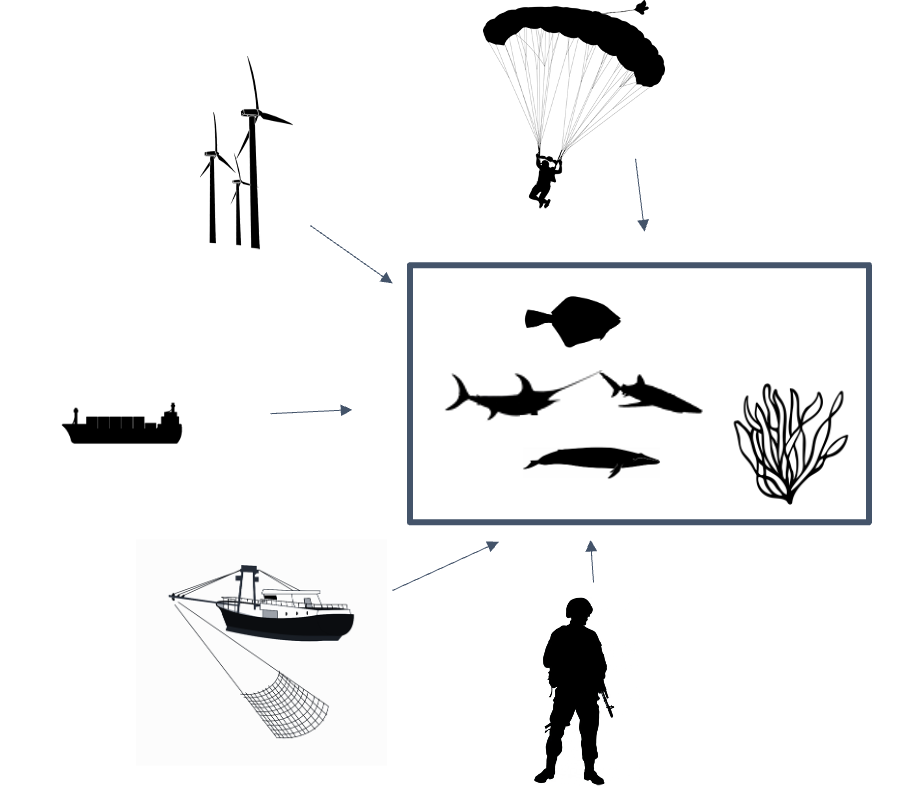
Multiple uses of the ocean include energy, shipping, tourism, fishing, military that can impact a single parcel of water. The future of DOM requires a multi-sectoral, ecosystem based approach to adjust management at relevant time scales.9
The future of dynamic ocean management also points towards building ensembles of multiple frameworks, ingestion of open-source (e.g., citizen science) data, and code to allow for rapid development and testing of such models (Box 13.2). Both anthropogenic uses of the ocean and the multitude of species within an area the goals of increasing the catch of a sustainably managed and under-exploited fish species. DOM requires a suite of tools that allow for redundancy, trade-offs among the various management approaches (e.g., Welch et al., 2020) and includes multiple sectors that would allow for more sustainable uses of the ocean, in addition to a greater capacity to respond to changing conditions in a rapid time frame. Currently, technological capacity and data richness are highly variable across nations, enabling more developed countries to have stronger dynamic management approaches in place. Thus, it is necessary to ensure that marine conservation technology and ecological information are more widely available than they currently are in order to balance power among political entities and multiple cultural needs (Jenkins, Chapter 14).
References
Abrahms, B., Welch, H., Brodie, S., Jacox, M.G., Becker, E.A., Bograd, S.J., Irvine, L.M., Palacios, D.M., Mate, B.R. & Hazen, E.L. (2019). Dynamic ensemble models to predict distributions and anthropogenic risk exposure for highly mobile species. Diversity and Distributions, 25(8), 1182-1193.
Allouche, O., Tsoar, A., & Kadmon, R. (2006). Assessing the accuracy of species distribution models: prevalence, kappa and the true skill statistic (TSS). Journal of applied ecology, 43(6), 1223-1232.
Anderson, C. R., Moore, S. K., Tomlinson, M. C., Silke, J., & Cusack, C. K. (2015). Living with harmful algal blooms in a changing world: strategies for modeling and mitigating their effects in coastal marine ecosystems. In Coastal and marine hazards, risks, and disasters (pp. 495-561). Elsevier.
Araújo, M. B., & New, M. (2007). Ensemble forecasting of species distributions. Trends in ecology & evolution, 22(1), 42-47.
Ban, N.C., Maxwell, S.M., Dunn, D.C., Hobday, A.J., Bax, N.J., Ardron, J., Gjerde, K.M., Game, E.T., Devillers, R., Kaplan, D.M. & Dunstan, P.K. (2014). Better integration of sectoral planning and management approaches for the interlinked ecology of the open oceans. Marine Policy, 49, 127-136.
Barbet‐Massin, M., Jiguet, F., Albert, C. H., & Thuiller, W. (2012). Selecting pseudo‐absences for species distribution models: how, where and how many?. Methods in ecology and evolution, 3(2), 327-338.
Baumgartner, M.F., Bonnell, J., Van Parijs, S.M., Corkeron, P.J., Hotchkin, C., Ball, K., Pelletier, L.P., Partan, J., Peters, D., Kemp, J. & Pietro, J., (2019). Persistent near real‐time passive acoustic monitoring for baleen whales from a moored buoy: System description and evaluation. Methods in Ecology and Evolution, 10(9), 1476-1489.
Becker, E. A., Carretta, J. V., Forney, K. A., Barlow, J., Brodie, S., Hoopes, R., ... & Hazen, E. L. (2020). Performance evaluation of cetacean species distribution models developed using generalized additive models and boosted regression trees. Ecology and evolution, 10(12), 5759-5784.
Becker, E. A., Forney, K. A., Redfern, J. V., Barlow, J., Jacox, M. G., Roberts, J. J., & Palacios, D. M. (2019). Predicting cetacean abundance and distribution in a changing climate. Diversity and Distributions, 25(4), 626-643.
Bolin, J. A., Schoeman, D. S., Evans, K. J., Cummins, S. F., & Scales, K. L. (2021). Achieving sustainable and climate‐resilient fisheries requires marine ecosystem forecasts to include fish condition. Fish and Fisheries, 22(5), 1067-1084..
Breece, M. W., Fox, D. A., Haulsee, D. E., Wirgin, I. I., & Oliver, M. J. (2018). Satellite driven distribution models of endangered Atlantic sturgeon occurrence in the mid-Atlantic Bight. ICES Journal of Marine Science, 75(2), 562-571.
Breece, M.W., Oliver, M.J., Fox, D.A., Hale, E.A., Haulsee, D.E., Shatley, M., Bograd, S.J., Hazen, E.L. & Welch, H. (2021). A satellite‐based mobile warning system to reduce interactions with an endangered species. Ecological Applications, 31(6), e02358.
Brodie, S., Jacox, M.G., Bograd, S.J., Welch, H., Dewar, H., Scales, K.L., Maxwell, S.M., Briscoe, D.M., Edwards, C.A., Crowder, L.B. & Hazen, E. L. (2018). Integrating dynamic subsurface habitat metrics into species distribution models. Frontiers in Marine Science, 5, 219.
Butchart, S. H., Di Marco, M., & Watson, J. E. (2016). Formulating smart commitments on biodiversity: lessons from the Aichi Targets. Conservation Letters, 9(6), 457-468.
Clark, C. W., Calupca, T., Gillespie, D., Von der Heydt, K., & Kemp, J. (2005). A near‐real‐time acoustic detection and reporting system for endangered species in critical habitats. The Journal of the Acoustical Society of America, 117(4), 2525-2525.
Crespo, G.O., Mossop, J., Dunn, D., Gjerde, K., Hazen, E., Reygondeau, G., Warner, R., Tittensor, D. & Halpin, P. (2020). Beyond static spatial management: Scientific and legal considerations for dynamic management in the high seas. Marine Policy, 122, 104102.
Davies, K. T., & Brillant, S. W. (2019). Mass human-caused mortality spurs federal action to protect endangered North Atlantic right whales in Canada. Marine Policy, 104, 157-162.
Derville, S., Torres, L. G., Iovan, C., & Garrigue, C. (2018). Finding the right fit: Comparative cetacean distribution models using multiple data sources and statistical approaches. Diversity and Distributions, 24(11), 1657-1673..
Dierssen, H. M., Chlus, A., & Russell, B. (2015). Hyperspectral discrimination of floating mats of seagrass wrack and the macroalgae Sargassum in coastal waters of Greater Florida Bay using airborne remote sensing. Remote sensing of environment, 167, 247-258.
Dodson, S., Abrahms, B., Bograd, S. J., Fiechter, J., & Hazen, E. L. (2020). Disentangling the biotic and abiotic drivers of emergent migratory behavior using individual-based models. Ecological Modelling, 432, 109225.
Dunn, D.C., Jablonicky, C., Crespo, G.O., McCauley, D.J., Kroodsma, D.A., Boerder, K., Gjerde, K.M. & Halpin, P. N. (2018). Empowering high seas governance with satellite vessel tracking data. Fish and Fisheries, 19(4), 729-739.
Dunn, D. C., Maxwell, S. M., Boustany, A. M., & Halpin, P. N. (2016). Dynamic ocean management increases the efficiency and efficacy of fisheries management. Proceedings of the National Academy of Sciences, 113(3), 668-673.
Elith, J., & Leathwick, J. R. (2009). Species distribution models: ecological explanation and prediction across space and time. Annual Review of Ecology, Evolution and Systematics, 40(1), 677-697.
Eveson, J. P., Hobday, A. J., Hartog, J. R., Spillman, C. M., & Rough, K. M. (2015). Seasonal forecasting of tuna habitat in the Great Australian Bight. Fisheries Research, 170, 39-49.
Fiechter, J., Huckstadt, L. A., Rose, K. A., & Costa, D. P. (2016). A fully coupled ecosystem model to predict the foraging ecology of apex predators in the California Current. Marine Ecology Progress Series, 556, 273-285.
Fourcade, Y., Besnard, A. G., & Secondi, J. (2018). Paintings predict the distribution of species, or the challenge of selecting environmental predictors and evaluation statistics. Global Ecology and Biogeography, 27(2), 245-256.
Frawley, T. H., Crowder, L. B., & Broad, K. (2019). Heterogeneous perceptions of social-ecological change among small-scale fishermen in the central Gulf of California: implications for adaptive response. Frontiers in Marine Science, 6, 78.
Fulton, E. A., Smith, A. D., Smith, D. C., & Johnson, P. (2014). An integrated approach is needed for ecosystem based fisheries management: insights from ecosystem-level management strategy evaluation. PloS one, 9(1), e84242.
Gallego, R., Jacobs-Palmer, E., Cribari, K., & Kelly, R. P. (2020). Environmental DNA metabarcoding reveals winners and losers of global change in coastal waters. Proceedings of the Royal Society B, 287(1940), 20202424.
Gilman, E. L., Dalzell, P., & Martin, S. (2006). Fleet communication to abate fisheries bycatch. Marine Policy, 30(4), 360-366.
Halpern, B.S., Frazier, M., Afflerbach, J., Lowndes, J.S., Micheli, F., O’Hara, C., Scarborough, C. & Selkoe, K. A. (2019). Recent pace of change in human impact on the world’s ocean. Scientific reports, 9(1), 1-8.
Hartog, J. R., Hobday, A. J., Matear, R., & Feng, M. (2011). Habitat overlap between southern bluefin tuna and yellowfin tuna in the east coast longline fishery–implications for present and future spatial management. Deep Sea Research Part II: Topical Studies in Oceanography, 58(5), 746-752.
Hazen, E.L., Jorgensen, S., Rykaczewski, R.R., Bograd, S.J., Foley, D.G., Jonsen, I.D., Shaffer, S.A., Dunne, J.P., Costa, D.P., Crowder, L.B. & Block, B. A. (2013). Predicted habitat shifts of Pacific top predators in a changing climate. Nature Climate Change, 3(3), 234-238.
Hazen, E.L., Palacios, D.M., Forney, K.A., Howell, E.A., Becker, E., Hoover, A.L., Irvine, L., DeAngelis, M., Bograd, S.J., Mate, B.R. & Bailey, H. (2017). WhaleWatch: a dynamic management tool for predicting blue whale density in the California Current. Journal of Applied Ecology, 54(5), 1415-1428.
Hazen, E.L., Scales, K.L., Maxwell, S.M., Briscoe, D.K., Welch, H., Bograd, S.J., Bailey, H., Benson, S.R., Eguchi, T., Dewar, H. & Lewison, R. L. (2018). A dynamic ocean management tool to reduce bycatch and support sustainable fisheries. Science advances, 4(5), eaar3001.
Hobbs, N. T., Geremia, C., Treanor, J., Wallen, R., White, P. J., Hooten, M. B., & Rhyan, J. C. (2015). State‐space modeling to support management of brucellosis in the Yellowstone bison population. Ecological Monographs, 85(4), 525-556.
Hobday, A. J., & Hartog, J. R. (2014). Derived ocean features for dynamic ocean management. Oceanography, 27(4), 134-145.
Hobday, A. J., Hartog, J. R., Spillman, C. M., & Alves, O. (2011). Seasonal forecasting of tuna habitat for dynamic spatial management. Canadian Journal of Fisheries and Aquatic Sciences, 68(5), 898-911.
Hobday, A. J., Hartog, J. R., Timmiss, T., & Fielding, J. (2010). Dynamic spatial zoning to manage southern bluefin tuna (Thunnus maccoyii) capture in a multi‐species longline fishery. Fisheries Oceanography, 19(3), 243-253.
Hobday, A. J., Spillman, C. M., Eveson, J. P., Hartog, J. R., Zhang, X., & Brodie, S. (2018). A framework for combining seasonal forecasts and climate projections to aid risk management for fisheries and aquaculture. Frontiers in Marine Science, 137.
Holsman, K.K., Hazen, E.L., Haynie, A., Gourguet, S., Hollowed, A., Bograd, S.J., Samhouri, J.F. & Aydin, K. (2019). Towards climate resiliency in fisheries management. ICES Journal of Marine Science, 76(5), 1368-1378.
Howell, E. A., Kobayashi, D. R., Parker, D. M., Balazs, G. H., & Polovina, J. J. (2008). TurtleWatch: a tool to aid in the bycatch reduction of loggerhead turtles Caretta caretta in the Hawaii-based pelagic longline fishery. Endangered Species Research, 5(2-3), 267-278.
Howell, E. A., Hoover, A., Benson, S. R., Bailey, H., Polovina, J. J., Seminoff, J. A., & Dutton, P. H. (2015). Enhancing the TurtleWatch product for leatherback sea turtles, a dynamic habitat model for ecosystem‐based management. Fisheries Oceanography, 24(1), 57-68.
Hyrenbach, K. D., Forney, K. A., & Dayton, P. K. (2000). Marine protected areas and ocean basin management. Aquatic conservation: marine and freshwater ecosystems, 10(6), 437-458.
Jacox M.G., Alexander M.A., Siedlecki S., Chen K., Kwon Y.O., Brodie S., Ortiz I., Tommasi D., Widlansky M.J., Barrie D., Capotondi A., Cheng W., Di Lorenzo E., Edwards C., Fiechter J., Fratantoni P., Hazen E.L., Hermann A.J., Kumar A., Miller A.J., Pirhalla D., Pozo Buil M., Ray S., Sheridan S.C., Subramanian A., Thompson P., Thorne L., Annamalai H., Aydin K., Bograd S.J., Griffis R.B., Kearney K., Kim H., Mariotti A., Merrifield M., & Rykaczewski, R. (2020). Seasonal-to-interannual prediction of North American coastal marine ecosystems: Forecast methods, mechanisms of predictability, and priority developments. Progress in Oceanography, 183, 102307.
Johnston, D. W. (2019). Unoccupied aircraft systems in marine science and conservation. Annual review of marine science, 11, 439-463.
Kavanaugh, K. E., Derner, K., Fisher, K. M., David, E. E. P., Urizar, C., & Merlini, R. (2013). Assessment of the eastern Gulf of Mexico Harmful Algal Bloom Operational Forecast System (GOMX HAB-OFS): A comparative analysis of forecast skill and utilization from October 1, 2004 to April 30, 2008.
Keith, D. M., Sameoto, J. A., Keyser, F. M., & Ward-Paige, C. A. (2020). Evaluating socio-economic and conservation impacts of management: A case study of time-area closures on Georges Bank. PloS one, 15(10), e0240322.
Lewison, R., Hobday, A. J., Maxwell, S., Hazen, E., Hartog, J. R., Dunn, D. C., Briscoe, D., Fossette, S., O’Keefe, C.E., Barnes, M., Abecassis, M., Bograd, S. David Bethoney, N., Bailey, H., Wiley, D., Andrews, S., Hazen, L. & Crowder, L. B. (2015). Dynamic ocean management: identifying the critical ingredients of dynamic approaches to ocean resource management. BioScience, 65(5), 486-498.
Liu, G., Strong, A. E., Skirving, W., & Arzayus, L. F. (2006, June). Overview of NOAA Cuba program’s near-real time satellite global coral bleaching monitoring activities. In Proceedings of the 10th international coral reef symposium (Vol. 1793, pp. 1783-1793). Okinawa, Japan: Gurugram.
Lomonico, S., Gleason, M. G., Wilson, J. R., Bradley, D., Kauer, K., Bell, R. J., & Dempsey, T. (2021). Opportunities for fishery partnerships to advance climate-ready fisheries science and management. Marine Policy, 123, 104252.
Mason, J. G., Alfaro‐Shigueto, J., Mangel, J. C., Brodie, S., Bograd, S. J., Crowder, L. B., & Hazen, E. L. (2019). Convergence of fishers’ knowledge with a species distribution model in a Peruvian shark fishery. Conservation Science and Practice, 1(4), e13.
Maxwell, S. M., Gjerde, K. M., Conners, M. G., & Crowder, L. B. (2020). Mobile protected areas for biodiversity on the high seas. Science, 367(6475), 252-254.
Maxwell, S. M., Hazen, E. L., Lewison, R. L., Dunn, D. C., Bailey, H., Bograd, S. J., ... & Crowder, L. B. (2015). Dynamic ocean management: Defining and conceptualizing real-time management of the ocean. Marine Policy, 58, 42-50.
Merrifield, M., Gleason, M., Bellquist, L., Kauer, K., Oberhoff, D., Burt, C., Reinecke, S. & Bell, M. (2019). eCatch: Enabling collaborative fisheries management with technology. Ecological Informatics, 52, 82-93.
Meyer-Gutbrod, E. L., Greene, C. H., & Davies, K. T. (2018). Marine species range shifts necessitate advanced policy planning: the case of the North Atlantic right whale. Oceanography, 31(2), 19-23.
Muhling, B. A., Brodie, S., Smith, J. A., Tommasi, D., Gaitan, C. F., Hazen, E. L., Jacox, M. G., Auth, T. D. & Brodeur, R. D. (2020). Predictability of species distributions deteriorates under novel environmental conditions in the California Current System. Frontiers in Marine Science, 7, 589.
O’Keefe, C. E., Cadrin, S. X., & Stokesbury, K. D. (2014). Evaluating effectiveness of time/area closures, quotas/caps, and fleet communications to reduce fisheries bycatch. ICES Journal of Marine Science, 71(5), 1286-1297.
O’Keefe, C. E., & DeCelles, G. R. (2013). Forming a partnership to avoid bycatch. Fisheries, 38(10), 434-444.
Oestreich, W. K., Chapman, M. S., & Crowder, L. B. (2020). A comparative analysis of dynamic management in marine and terrestrial systems. Frontiers in Ecology and the Environment, 18(9), 496-504.
Oliver, E. C., Donat, M. G., Burrows, M. T., Moore, P. J., Smale, D. A., Alexander, L. V., ... & Wernberg, T. (2018). Longer and more frequent marine heatwaves over the past century. Nature communications, 9(1), 1-12.
Petchey, O. L., Pontarp, M., Massie, T. M., Kéfi, S., Ozgul, A., Weilenmann, M., ... & Pearse, I. S. (2015). The ecological forecast horizon, and examples of its uses and determinants. Ecology letters, 18(7), 597-611.
Pirotta, E., Mangel, M., Costa, D. P., Mate, B., Goldbogen, J. A., Palacios, D. M., ... & New, L. (2018). A dynamic state model of migratory behavior and physiology to assess the consequences of environmental variation and anthropogenic disturbance on marine vertebrates. The American Naturalist, 191(2), E40-E56.
Pirotta, V., Grech, A., Jonsen, I. D., Laurance, W. F., & Harcourt, R. G. (2019). Consequences of global shipping traffic for marine giants. Frontiers in Ecology and the Environment, 17(1), 39-47.
Purves, D., Scharlemann, J. P., Harfoot, M., Newbold, T., Tittensor, D. P., Hutton, J., & Emmott, S. (2013). Time to model all life on Earth. Nature, 493(7432), 295-297.
Robinson, N. M., Nelson, W. A., Costello, M. J., Sutherland, J. E., & Lundquist, C. J. (2017). A systematic review of marine-based species distribution models (SDMs) with recommendations for best practice. Frontiers in Marine Science, 4, 421.
Rutz, C., Loretto, M. C., Bates, A. E., Davidson, S. C., Duarte, C. M., Jetz, W., ... & Cagnacci, F. (2020). COVID-19 lockdown allows researchers to quantify the effects of human activity on wildlife. Nature Ecology & Evolution, 4(9), 1156-1159.
Santora, J. A., Mantua, N. J., Schroeder, I. D., Field, J. C., Hazen, E. L., Bograd, S. J., ... & Forney, K. A. (2020). Habitat compression and ecosystem shifts as potential links between marine heatwave and record whale entanglements. Nature communications, 11(1), 1-12.
Scales, K. L., Hazen, E. L., Maxwell, S. M., Dewar, H., Kohin, S., Jacox, M. G., ... & Bograd, S. J. (2017). Fit to predict? Eco‐informatics for predicting the catchability of a pelagic fish in near real time. Ecological Applications, 27(8), 2313-2329.
Shaw, J. L., Clarke, L. J., Wedderburn, S. D., Barnes, T. C., Weyrich, L. S., & Cooper, A. (2016). Comparison of environmental DNA metabarcoding and conventional fish survey methods in a river system. Biological Conservation, 197, 131-138.
Skroblin, A., Carboon, T., Bidu, G., Chapman, N., Miller, M., Taylor, K., ... & Wintle, B. A. (2021). Including indigenous knowledge in species distribution modeling for increased ecological insights. Conservation Biology, 35(2), 587-597.
Smith, J. A., Tommasi, D., Welch, H., Hazen, E. L., Sweeney, J., Brodie, S., ... & Jacox, M. G. (2021). Comparing dynamic and static time-area closures for bycatch mitigation: A management strategy evaluation of a swordfish fishery. Frontiers in Marine Science, 8, 630607.
Spillman, C. M., & Hobday, A. J. (2014). Dynamical seasonal ocean forecasts to aid salmon farm management in a climate hotspot. Climate Risk Management, 1, 25-38.
Tillotson, M. D., Kelly, R. P., Duda, J. J., Hoy, M., Kralj, J., & Quinn, T. P. (2018). Concentrations of environmental DNA (eDNA) reflect spawning salmon abundance at fine spatial and temporal scales. Biological Conservation, 220, 1-11.
Tommasi, D., Stock, C. A., Hobday, A. J., Methot, R., Kaplan, I. C., Eveson, J. P., ... & Werner, F. E. (2017). Managing living marine resources in a dynamic environment: the role of seasonal to decadal climate forecasts. Progress in Oceanography, 152, 15-49.
Visalli, M. E., Best, B. D., Cabral, R. B., Cheung, W. W., Clark, N. A., Garilao, C., ... & McCauley, D. J. (2020). Data-driven approach for highlighting priority areas for protection in marine areas beyond national jurisdiction. Marine Policy, 122, 103927.
Welch, H., Brodie, S., Jacox, M. G., Bograd, S. J., & Hazen, E. L. (2020). Decision‐support tools for dynamic management. Conservation Biology, 34(3), 589-599.
Welch, H., Hazen, E. L., Bograd, S. J., Jacox, M. G., Brodie, S., Robinson, D., ... & Lewison, R. (2019a). Practical considerations for operationalizing dynamic management tools. Journal of Applied Ecology, 56(2), 459-469.
Welch, H., Hazen, E. L., Briscoe, D. K., Bograd, S. J., Jacox, M. G., Eguchi, T., ... & Bailey, H. (2019). Environmental indicators to reduce loggerhead turtle bycatch offshore of Southern California. Ecological Indicators, 98, 657-664.
Welch, H., Pressey, R. L., & Reside, A. E. (2018). Using temporally explicit habitat suitability models to assess threats to mobile species and evaluate the effectiveness of marine protected areas. Journal for Nature Conservation, 41, 106-115.
Wiley, D., Hatch, L., Schwehr, K., Thompson, M., & MacDonald, C. (2013). Marine sanctuaries and marine planning. The Coast Guard Proceedings of the Marine Safety and Security Council, 70, 10-15.
Wilson, J. R., Lomonico, S., Bradley, D., Sievanen, L., Dempsey, T., Bell, M., ... & Gleason, M. (2018). Adaptive comanagement to achieve climate‐ready fisheries. Conservation Letters, 11(6), e12452.
Woodman, S. M., Forney, K. A., Becker, E. A., DeAngelis, M. L., Hazen, E. L., Palacios, D. M., & Redfern, J. V. (2019). eSDM: a tool for creating and exploring ensembles of predictions from species distribution and abundance models. Methods in Ecology and Evolution, 10(11), 1923-1933.
Wright, G., Gjerde, K. M., Johnson, D. E., Finkelstein, A., Ferreira, M. A., Dunn, D. C., ... & Grehan, A. (2021). Marine spatial planning in areas beyond national jurisdiction. Marine Policy, 132, 103384.
1 NOAA Fisheries, Southwest Fisheries Science Center, https://orcid.org/0000-0002-0412-7178
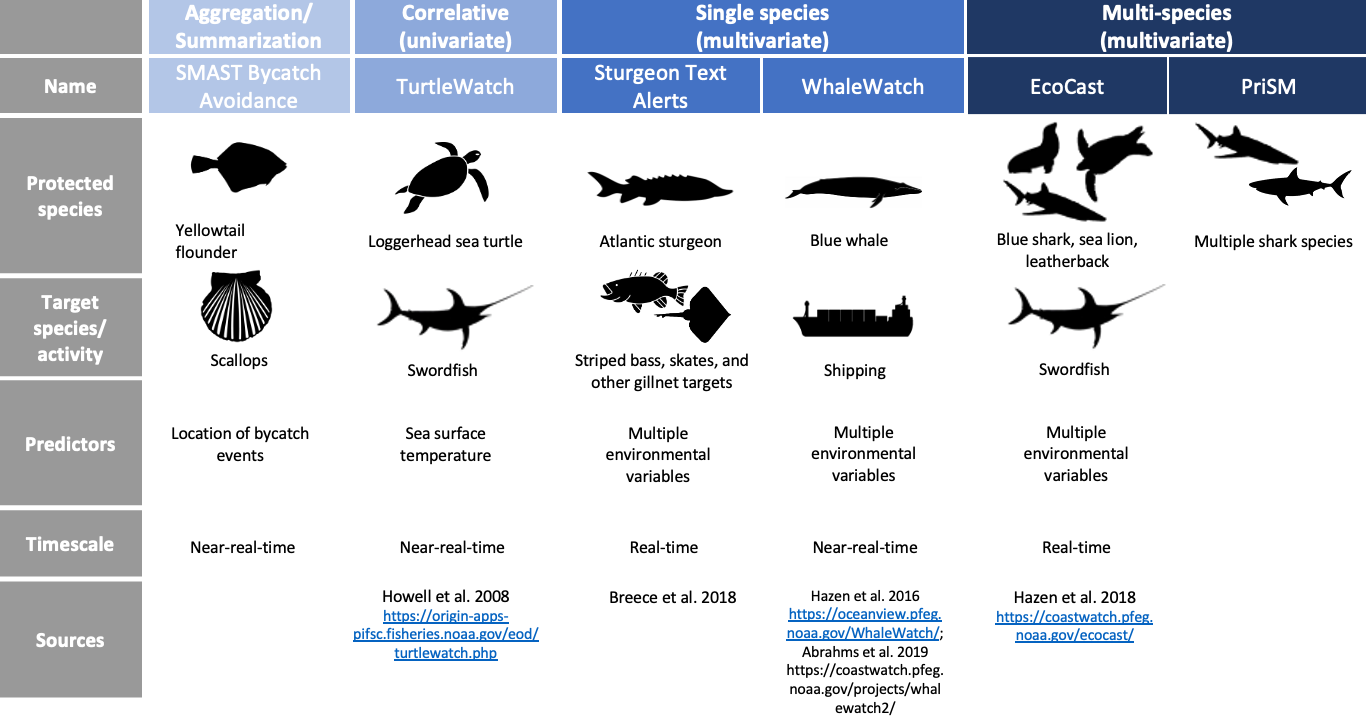
2 Increasing complexity of dynamic ocean management can be a function of modeling approach, multi-species or multi-sector integrations, or predictor variables. Tools can be a) aggregation and summarization where reporting occurs on data from a previous timestep, b) correlative univariate where a single predictor variable such as SST is used, c) single species multivariate where there are multiple predictor variables (SST, Chl-a, etc.) and a single species being managed, d) multispecies multivariate with multiple species and multiple predictor variables, or e) forecasting models that use future ocean state to provide leading information to fishers or managers. Simpler models require less data and can be implemented in fisheries with lesser technical capacity while complex models can be more valuable to assess tradeoffs and can be implemented for data rich systems. Other important components of a fishery, e.g., quality of meat (Bolin et al., 2021) can also be predicted in a dynamic framework.
7 https://www.opc.ca.gov/risk-assessment-and-mitigation-program-ramp/
8 Independent sightings data were collated from NOAA/Southwest Fisheries Science Center Surveys (SWFSC), California Cooperative Oceanic Fisheries Investigations Surveys (CalCOFI), NOAA/National Marine Fisheries Service (NMFS) Cruise, Spotter Pro, Whale Alert, Channel Islands National Marine Sanctuary (CINMS) SAMSAP Survey, Channel Islands Naturalist Corps (CINC) Sightings, and Point Blue Marine Mammal Survey.
9 Increasing complexity of dynamic ocean management can be a function of modeling approach, multi-species or multi-sector integrations, or predictor variables. Tools can be a) aggregation and summarization where reporting occurs on data from a previous timestep, b) correlative univariate where a single predictor variable such as SST is used, c) single species multivariate where there are multiple predictor variables (SST, Chl-a, etc.) and a single species being managed, d) multispecies multivariate with multiple species and multiple predictor variables, or e) forecasting models that use future ocean state to provide leading information to fishers or managers. Simpler models require less data and can be implemented in fisheries with lesser technical capacity while complex models can be more valuable to assess tradeoffs and can be implemented for data rich systems. Other important components of a fishery, e.g., quality of meat (Bolin et al., 2021) can also be predicted in a dynamic framework.