18. Gene Flow and Ancient DNA: Trees with Connecting Branches
© 2024 Marianne Sommer, CC BY-NC-ND 4.0 https://doi.org/10.11647/OBP.0396.22
Due to technical advancements such as next-generation sequencing and increased accessibility of aDNA in terms of quality, quantity, and time-depth, the potential for aDNA research has significantly expanded from the study of limited individual ancient genomes to the broader scale of population genomics (e.g., Lan and Lindqvist 2019, 21). Most importantly for my context, the once predominant conceptualization of human evolution as a tree on a map, indicating a common origin with subsequent population splits without intermixture, has become increasingly problematic due to advanced technologies and the growing abundance of data, including aDNA data. Indeed, aDNA studies have catalyzed the undermining of the pure tree model for human evolution, and at ever lower segments. Some of the most groundbreaking and surprising findings in aDNA research in fact relate to the genetic contribution of extinct lineages to lines leading to modern human populations as well as evidence of ancient genetic exchange between different archaic lineages (Resendez et al. 2019, 379).
It became clear that Neanderthals had contributed to present ‘non-African genomes’. And Denisovans – an archaic hominin established on the basis of DNA from a little finger bone discovered in a cave in the Altai Mountains of southern Siberia – seemed to have contributed to the genomes of modern Papuans, Melanesians, Aboriginal Australians, and other Southeast Asian Islanders, as well as, to a lower degree, to mainland East and South Asians (Green et al. 2010; Reich et al. 2010; for an overview, see Leonardi et al. 2017). Further research suggested possible deep-rooting gene flow from an ancient ‘ghost population’ and a modern ‘ghost population’ (genetic traces of unknown ancestors) into West African populations as well as large-scale Neanderthal inbreeding in African populations (reviewed in Vicente and Schlebusch 2020, 13).
Despite these developments, however, the diagrams to express hominin and human history and kinship still tended to closely resemble trees. Unlike in the admixture studies discussed in the last chapter, where two or more ancestral groups were conceptualized as having mixed to form a new one, these diagrams suggested that gene flow between groups had been unidirectional and constituted one event of short duration. These events, which were represented by links or arrows connecting tree branches, were often referred to as ‘introgression event’, ‘admixture pulse’, or ‘episodic migration’. The diagram from a breakthrough-paper of 2014 reproduced as Figure IV.14 serves as an example; it visualizes these short events, pulses, or episodes as darts between the branches of an overall tree structure (Prüfer et al. 2014, Fig. 8, 48).
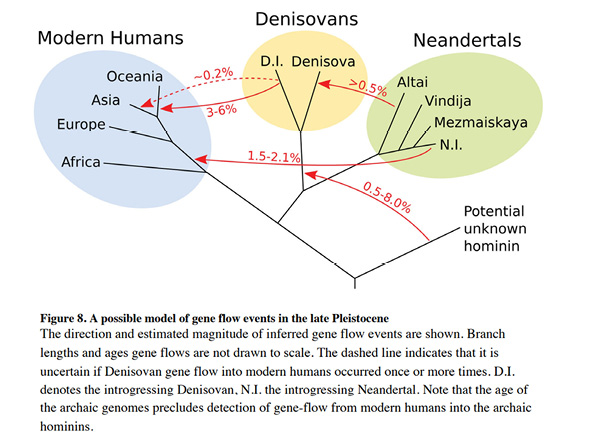
Fig. IV.14 “A possible model of gene flow events in the late Pleistocene”. Kay Prüfer, Fernando Racimo, Nick Patterson, et al., “The Complete Genome Sequence of a Neanderthal from the Altai Mountains” (Nature 505.7481 [2014]: 43–49), Fig. 8, p. 48, https://doi.org/10.1038/nature12886. © Springer Nature Limited, all rights reserved (reproduced with permission from Springer Nature Customer Service Centre GmbH).
At the same time, and as we have found in the preceding chapters of this part, text and diagram were not always completely congruent in this regard, as indicated by the influential 2014 paper from which Fig. IV.14 is taken:
We present evidence for three to five cases of interbreeding among four distinct hominin populations (Fig. 8). Clearly the real population history is likely to have been even more complex. For example, most cases of gene flow are likely to have occurred intermittently, often in both directions and across a geographic range. Thus, combinations of gene flow among different groups and substructured populations may have yielded the patterns detected rather than the discrete events considered here. (Prüfer et al. 2014, 48)
Furthermore, while in Figure IV.14 the recent human groups are at least embedded in a blue bubble, which we might interpret as genetic exchange among them, in the tree in Figure IV.15 (Kuhlwilm et al. 2016, Fig. 3, 432) that suggests additional gene flow from a population related to modern humans into one of the Neandertal lineages, ‘the modern human populations’ – constituted by “San”, “Yoruba”, “French”, “Han”, and “Papuan” samples – again appear as unmixed among themselves.
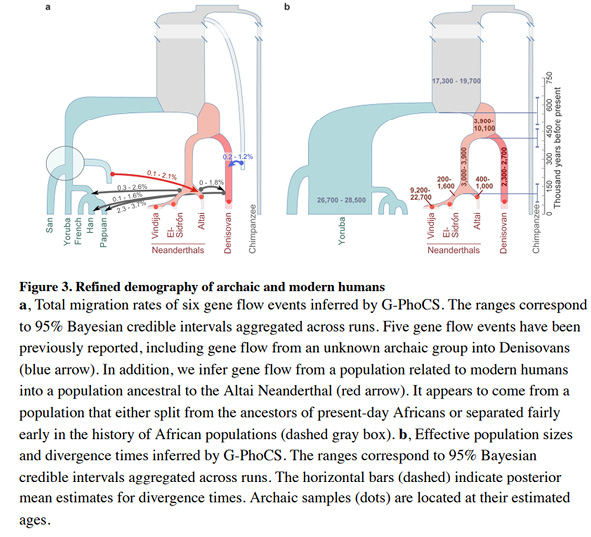
Fig. IV.15 “Refined demography of archaic and modern humans”. Martin Kuhlwilm, Ilan Gronau, Melissa J. Hubisz, et al., “Ancient Gene Flow from Early Modern Humans into Eastern Neanderthals” (Nature 530.7591 [2016]: 429–33), Fig. 3, p. 432, https://doi.org/10.1038/nature16544. © Springer Nature, all rights reserved (reproduced with permission from Springer Nature Customer Service Centre GmbH).
Finally, some archeologists, geneticists, and paleoanthropologists, including Stringer, who as we have seen had been a key figure in the synthesis of approaches around the out-of-Africa model, rejected many of the proposed mixture events (Stringer 2014; see also Mellars 2006), while granting that it was impossible to pinpoint one geographical or temporal origin of modern human ancestry in Africa (see Bergström et al. 2021, 233). Indeed, it has been observed that
the revised ‘Out-of-Africa’ model, or partial replacement model, insists that Africa-related modern humans are the main stream in modern human evolution which has borne the major contribution to the present-day populations, and the dispersed modern humans from Africa assimilated other archaic populations instead of integrating into the indigenous groups of other regions. (Gao et al. 2017, 2162)
This would agree with many of the diagrams representing the new, aDNA-related view of human evolution, with their tree shape that includes connecting arrows. The direction of the darts in these diagrams suggests that the focus is on the modern human populations that came ‘out of Africa’; the local archaic humans are merely seen as contributing a bit to that “main stream”, as Xing Gao of the Chinese Academy of Sciences and colleagues put it, even if this was corrected for the Y chromosome and mtDNA that were found to have been introduced from the modern human into the Neanderthal lineage (Bergström et al. 2021). And yet, the researchers who added this new arrow in the tree shown as Figure IV.16 conceded that “trees are poor representations of genetic history” (233).
The observations so far are obviously connected to the development of mathematics and technologies to study human and hominin history and diversity on the basis of modern and ancient DNA. Programs like STRUCTURE and ADMIXTURE as well as the older method of principal component analysis that I have treated in the last chapter assess the genetic similarity between individuals and the extent to which populations form distinct clusters. However, the integration of aDNA presents problems, not least due to sample sizes, quality, and chronological and geographic representativity. Significantly, these procedures do not have underlying demographic models or hypothesis testing components, and the recovered genetic substructures could have been brought about by several different population histories: “This results in inference that can be easily steered by subjective interpretation of individual researchers […]” (Loog 2020, 3). Therefore, even though researchers may assume that living people and populations are a product of admixture between a certain set of distinct ancestral groups that once existed in the past, the observed genetic patterns could be the result of other demographic histories. For example, one cannot differentiate between admixture and other kinds of gene flow, or between one or several events (which may render ADMIXTURE a misnomer).
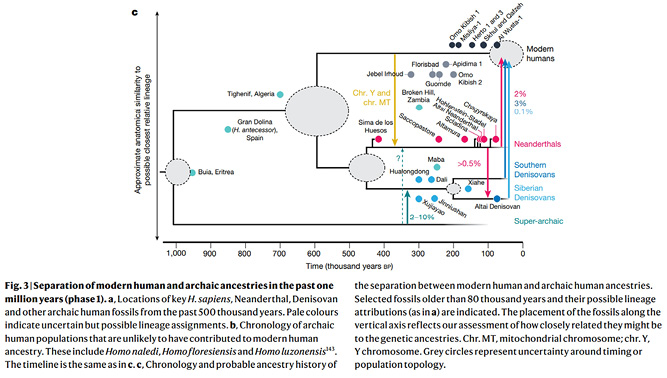
Fig. IV.16 “Separation of modern human and archaic ancestries”. Anders Bergström, Chris Stringer, Mateja Hajdinjak, et al., “Origins of Modern Human Ancestry” (Nature 590.7845 [2021]: 229–37), Fig. 3c, p. 234, https://doi.org/10.1038/s41586-021-03244-5. © Springer Nature, all rights reserved (reproduced with permission from Springer Nature Customer Service Centre GmbH).
These might be some of the reasons why, despite their popularity, programs like STRUCTURE, ADMIXTURE, and fineSTRUCTURE were not sufficient for many researchers especially when working with aDNA. Researchers often referred to the early history of human population genetics, and specifically to Cavalli-Sforza’s work as discussed in the preceding chapters, when accounting for the fact that they wanted methods that could do both – model population histories and relations and formally test for gene flow (Pickrell and Pritchard 2012). In other words, partly due to that early history of the field, methods were developed to describe population-tree topologies that could include gene flow events. These methods analyze the allele frequency patterns among populations and compare the amount of genetic drift in populations to establish population histories (f- and D-statistics) (on such methods in general, see, e.g., Pathak 2020; also Schaefer, Shapiro, and Green 2016).
In my context, the graph-building techniques are of particular interest. These are supplementary to the results from f- and D-statistics and “analyse the genetic diversities of many populations and suggest an elaborate tree-like topology, illustrating their mutual relationships” (Pathak 2020, 13). Such tools build trees of populations (based on drift patterns) that explain their evolutionary histories including episodic migrations (gene flow) or admixtures (TreeMix, MixMapper, qpGraph). It is especially in these contexts that the terms ‘gene flow’ and ‘admixture’ might be used interchangeably or ‘admixture’ is used to refer to single introgression events. Kay Prüfer et al. (2014) relied on f- and D-statistics and Figure IV.14, taken from their paper, is a “maximum likelihood drift tree of populations using TreeMix” (supplementary information, 55). The diverse techniques are suitable for different purposes and different data sets, and all have their inherent assumptions, their possibilities, and limitations, as well as pitfalls that may be exacerbated in the case of aDNA (Pathak 2020). But what is most important to my purpose is that graph-based models like TreeMix infer a tree structure (only in subsequent steps ‘correcting’ for admixture or gene flow events), which becomes evident in Figure IV.17.
The researchers from whom Figure IV.17 is taken assumed that human population history is tree-like to simplify the search for a maximum likelihood graph. While this technique may have been computationally efficient – a standard desktop computer could provide the tree structure in five minutes and test for gene flow in only a few hours – it “modeled migration [gene flow] between populations as occurring at single, instantaneous time points”, even though this was seen as “a dramatic simplification of the migration process” and the question of the relevance of continuous versus discrete mixture was said to be an open one. The researchers expressed the expectation that with an improved search algorithm, the assumption of ‘treeness’ could eventually be relaxed (Pickrell and Pritchard 2012, 9, and, including quotes, 13).
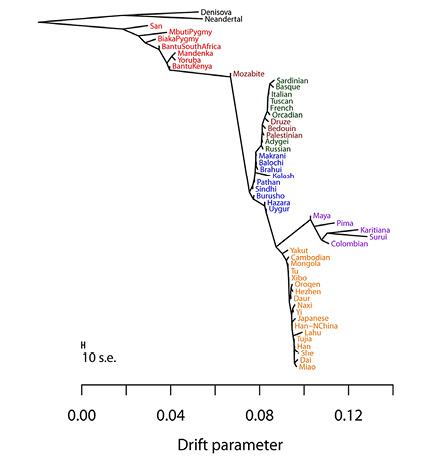
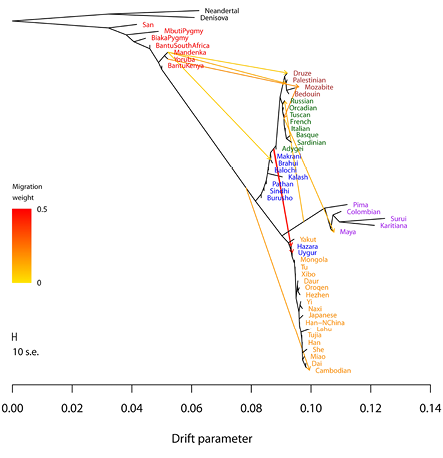
Fig. IV.17 (Above) is the inferred maximum likelihood tree of human phylogeny relating modern and archaic humans without considering gene flow between them, and (Below) is the same tree allowing for ten gene flow events between continental groups of modern humans (TreeMix). Joseph K. Pickrell and Jonathan K. Pritchard, “Inference of Population Splits and Mixtures from Genome-Wide Allele Frequency Data” (PLOS Genetics 8.11 [2012]: 1–17), Figs. 3a and 4, p. 8 and p. 10, https://doi.org/10.1371/journal.pgen.1002967. CC BY 4.0.
The appearance of a tree-like structure of human history and relatedness, or rather diversity, may also be enhanced because admixture graphs like qpGraph enable researchers to focus on admixture between populations of interest, hiding the admixed status of populations beyond the scope of a study (Lipson 2020, 1664). qpGraph and qpAdm are part of the ADMIXTOOLS software package that is mainly used for admixture studies and was developed by Nick Patterson of the David Reich Lab (Patterson et al. 2012).1 In the case of qpGraph, the researchers need to define the number of admixture events as well as which populations are admixed, while in the case of TreeMix, the determination of the phylogeny is automated, but the users decide the list of populations and the number of admixture events. This, for TreeMix together with the fact that the program starts from an unadmixed tree (which is a problem especially if many populations are admixed), is seen as the main drawback of such approaches (e.g., Lipson 2020, 1666.). It has also been observed that tools that require a model for the histories of the populations not in question in an analysis (nontarget populations) might lead to erroneous admixture results if these histories are modelled wrongly – again, especially in aDNA studies.2
This knowledge about population histories is not necessary for the statistical tool qpAdm (which applies the common ideas associated with f4-statistics and) that can identify plausible admixture histories and estimate admixture proportions. It has become a widely used method especially in aDNA studies to test whether the genetics of a certain population can be explained by admixture between two or more source populations. This statistical tool is seen to yield accurate results even when data coverage is low, data is missing to a high degree, or aDNA is damaged. However, it is yet again cautioned that ancient and present-day DNA should not be analyzed together and that qpAdm should not be used for population histories that might include extended periods of gene flow. The tool assumes a single pulse in a short time, even though “real population histories often involve continuous gene flow that occurs over a prolonged period of time” (Harney et al. 2021, 13). In fact, also in a case of continuous gene flow, qpAdm might suggest plausible admixture proportion estimates as the result of a single pulse.3
Some tools are not only able to approximate rates of gene flow between different branches from sequence data, but also past population sizes and the dates of population splits, one of them being the software package G-PhoCS (Generalized Phylogenetic Coalescence Sampler) that was applied in the construction of Figure IV.15. In most cases, however, tools for dating admixture events (ROLLOFF, ALDER, MALDER) once again assume only one admixture pulse and can therefore not capture continuous mixing of populations. As we have seen, and as also suggested by the trees in Figure IV.17, in which the second tree ‘allows for ten admixture events’ but not for continuous exchange, this constitutes a more general issue:
One question is whether changes in populations over time are typically gradual – owing to consistent, low-level gene flow between neighboring populations – or punctate, with migration events rapidly altering the genetic composition of a region. One line of work on modeling human history explicitly assumes the latter […]. (Pickrell and Reich 2014, 382–83)4
This latter approach has been found statistically inconsistent if gene flow does not correspond to single admixture events.5
While the supposition of such ‘punctate’ events and its implementation in analytical tools were among the factors that seem to have favored the persistence of tree-like images of human population histories, it has been more generally observed that most population-genetic models “rely on the assumption that the relationship between populations can be represented as, essentially, a phylogenetic tree, i.e. as abrupt splits between different branches of the tree, followed by independent evolution with potential for subsequent episodes of gene flow between them” (Loog 2020, 8). It has been pointed out that measures such as past population sizes, population splits, divergence times, and specific admixture events only make sense under such tree assumptions and might be artefacts thereof (Templeton 2018b, 223).
At the other end of the spectrum, rather than contemplating that the models might oversimplify population history among other things because they cannot account for continuous gene flow between ‘lineages’, researchers have instead observed that statistical methods may artificially produce genetic signatures of archaic introgression events when the data could be interpreted on the basis of alternative scenarios such as ancestral population structure. If the ‘ancestral African population’ was structured due to non-random mating, this could mean that some living human groups share more genetic variants with archaic ones than others, without introgression having taken place. Another possibility is aDNA contamination with modern DNA, which would render the archaic samples ‘more modern’, mimicking archaic admixture (Gopalan et al. 2021). And yet, even while possibly questioning archaic introgression in favor of the assumption of deep population structure, the approaches via tree building seem to have arrived at more and more reticulate relating diagrams as shown in Figure IV.18, including the possibility of population mergers and continuous gene flow – a topic I will continue in the final chapter (Chapter 20).
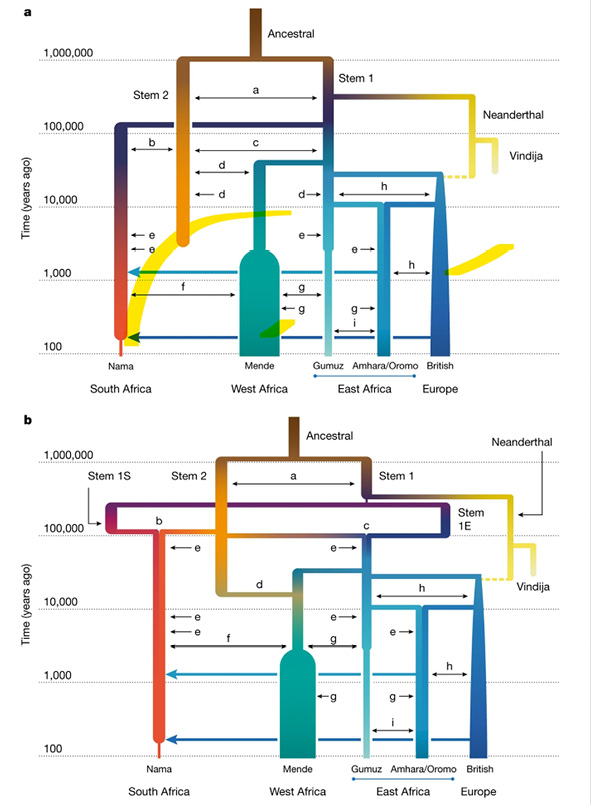
Fig. IV.18 Human phylogeny for ‘Africa’ including continuous gene flow (small letters) and population mergers. Aaron P. Ragsdale, Timothy D. Weaver, Elizabeth G. Atkinson, et al., “A Weakly Structured Stem for Human Origins in Africa” (Nature 617.7962 [2023]: 755–63), Fig. 3, p. 756, https://doi.org/10.1038/s41586-023-06055-y. © The Authors, under exclusive license to Springer Nature Limited, all rights reserved (reproduced with permission from Springer Nature Customer Service Centre GmbH).
Let me first recapitulate. I have begun this part with a look at the visualization of human history, diversity, and kinship in early human population genetic research when the tree (on a map) was fundamental. Against this background, I have identified something like a visual paradigm shift with the advent of programs like STRUCTURE and ADMIXTURE and the concomitant interest in processes of mixing and in individuals and populations as being intermixed. At the same time, whole-genome analyses in such programs first suggested the age-old Blumenbachian clustering into five groups. Furthermore, while a certain drive beyond the categories of ‘the individual’ and ‘the population’ seems to be inherent in such analyses and visualizations, there is also a pull in the opposite direction in the notion of ‘originally pure ancestral populations or races’. This pull finds its strongest expression in the shape of trees.
With the advent of population-genomic aDNA research, the focus on admixture and introgression increased and was given a deeper history. However, in modelling and visualizing, the amount of contact and genetic exchange between groups that researchers esteemed likely tended to be minimized, leaving us with trees that include a few arrows between branches. This was probably due to several factors, one of them being ways of thinking and doing that are handed down from one generation of researchers to the next and that may be disproportionately shaped by particularly influential scientists and laboratories (see e.g., Gokcumen 2020, 69). There is also the history of methodological and technological developments in a stricter sense as in the necessity to build on what is already there and the fact that statistical analyses aim at reducing the complexity of data or fit it to parametric models. Although more complex models were appearing on the horizon, human population genomics, also with the inclusion of aDNA data, instantiated tree thinking and tree building that at times rendered human populations distinct, homogenous entities. To find out more about the reasons for these issues, it is helpful to consider the ways in which practitioners themselves account for the history of their field (Sommer and Amstutz 2024, “Enter Ancient DNA: Mosaic and Trees”, “Conclusion”).
1 See, further, the Reich Laboratory website: https://github.com/DReichLab/AdmixTools
2 In the paper in which Joseph K. Pickrell and Jonathan K. Pritchard (2012) introduced the tool TreeMix, they interchangeably talked of admixture and gene flow. Mark Lipson (2020) and others only refer to these tools as admixture tools.
3 Nick Patterson explained that the motivation for the development of these software tools was that point-wise gene transfer was easier to model. Thus, the reasons were entirely mathematical, i.e., these models were mathematically tractable, while the graph tools followed “naturally” (personal interview with Nick Patterson, 15 August 2023). The statistics and software are continuously being developed, so that, at the point of writing this, there already exists an ADMIXTOOLS 7.0.2. In fact, on the basis of re-analyses of published population histories with findGraphs (part of ADMIXTOOLS 2), Robert Maier et al. (2023) criticized that there are alternative, and even better fitting, models for population histories than the published ones. With regard to the admixture events, they stated that “even this approach [exploration with findGraphs] can lead to potentially unstable results as relaxing the assumption of parsimony (that fewer admixture events is more likely) can lead to qualitatively quite different equally well-fitting topologies […]” (22).
4 On the analytical tool DATES for the inference of admixture timing, see Narasimhan et al. 2019; on the methodological developments with aDNA in general, see, for example, Orlando et al. 2021, 11–13 on principal component analysis, ADMIXTURE, and f-statistics.
5 As we have seen, programs like TreeMix “cannot distinguish between a single, virtually instantaneous admixture event, versus multiple, recurring admixture events, versus continuous gene flow, or versus gene flow with isolation by distance” (Templeton 2023, 13). Inconsistency is thereby a formal property from statistics. While, with increasing amounts of data, a good statistic should converge to the true value, an inconsistent statistic with probability 1 approaches a false inference with increasing data (Alan Templeton, personal communication, 8 January 2024).