6. The First Tree of the Human ‘Races’: Mappa Mundi, Chain of Being, and Tree of Life
© 2024 Marianne Sommer, CC BY-NC-ND 4.0 https://doi.org/10.11647/OBP.0396.08
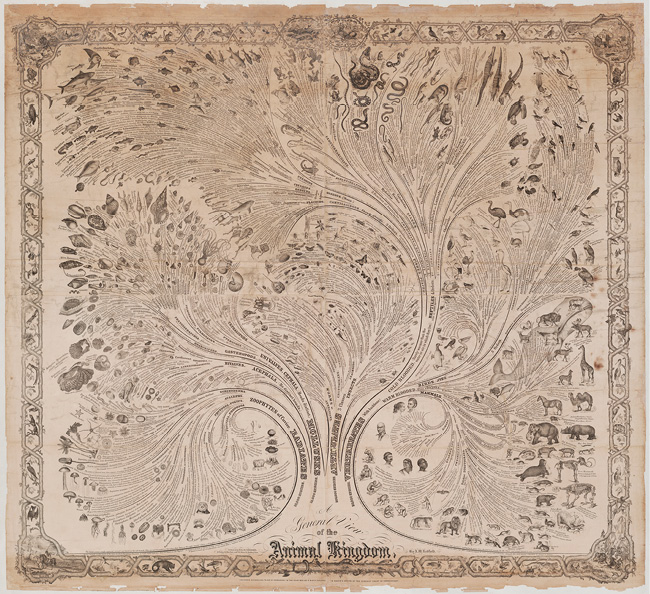
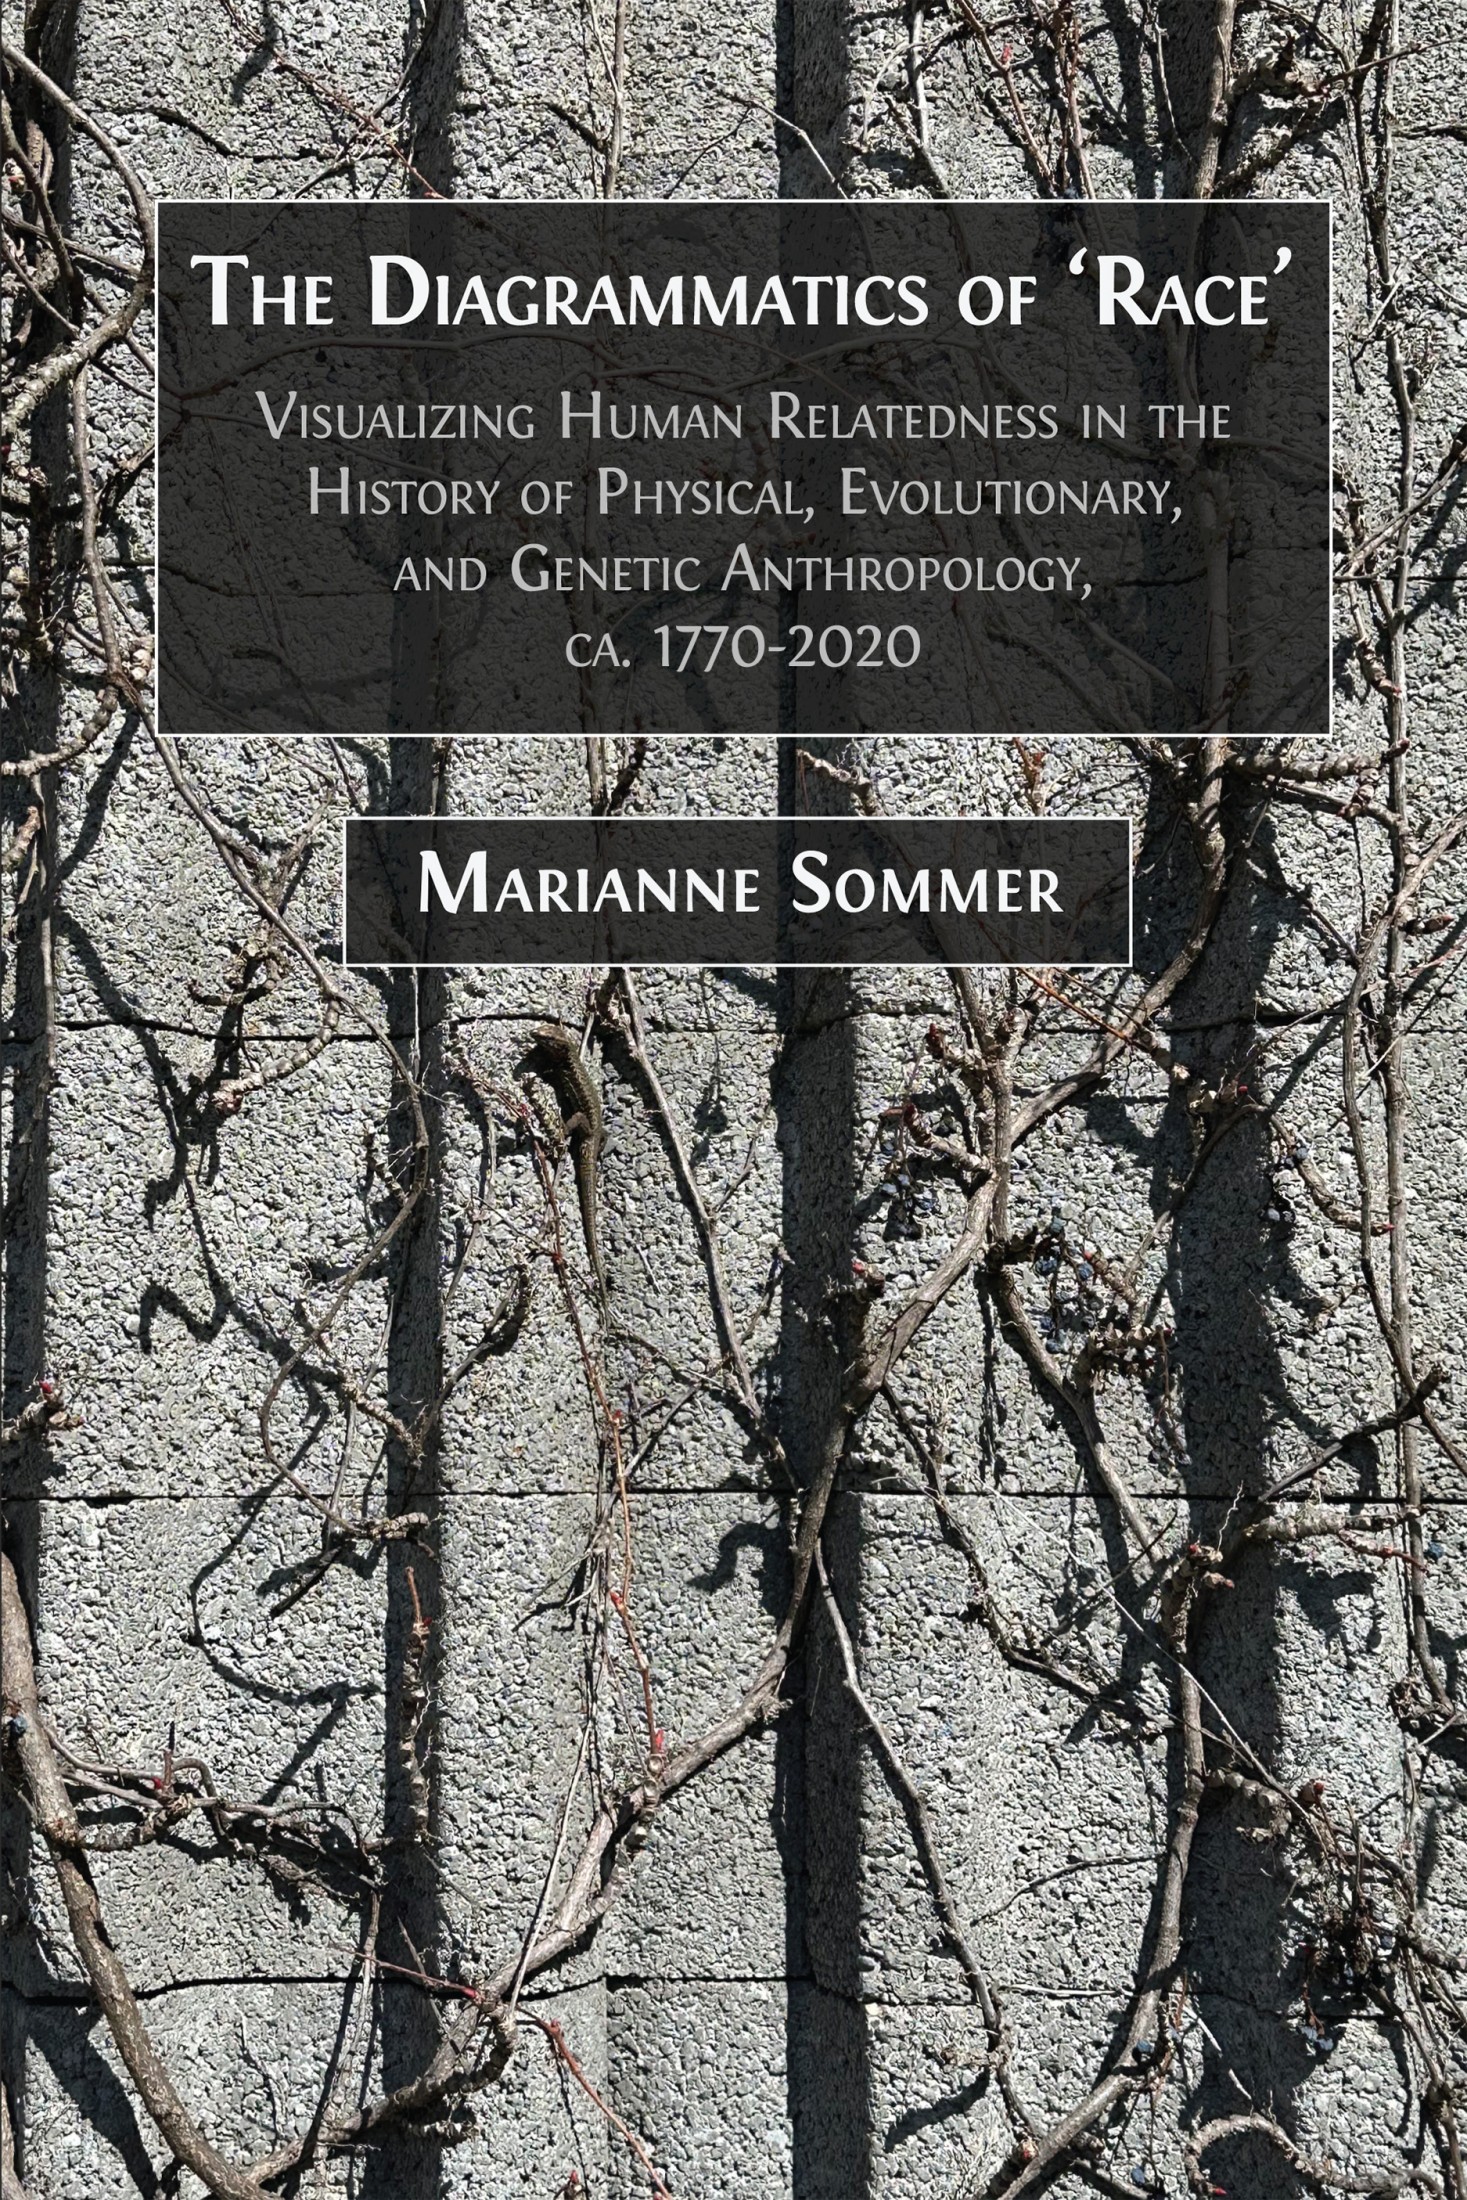
Fig. II.1 The wall chart “A General View of the Animal Kingdom” by Anna Maria Redfield (1857). With great thanks to the Yale University Peabody Museum and Senior Collection Manager Susan H. Butts for the photograph. Public domain. A larger version of this image may be viewed at https://hdl.handle.net/20.500.12434/a91688e4
In 1857, a most astonishing image appeared that was to educate students and laypeople in the art of zoological classification: “A General View of the Animal Kingdom” by the Canadian-born Anna Maria Redfield, shown in Figure II.1. The wall chart, carried out with the assistance of a friend, a Reverend E. D. Maltbie of Syracuse (New York), measures 1560 to 1560 mm in size, a lithograph consisting of thirty-two sections that were laid down on linen. Redfield was from a wealthy family; she collected shells, minerals, and plants as well as studying scientific literature. She attained the equivalent of a Master’s Degree from Ingham University, the first such institution for women in the United States. The American writer and historian Elizabeth Ellet wrote of her in 1867 as a lady in Syracuse “whose social influence has been salutary and widely acknowledged” (Ellet 1867, 309–310, quote on 309). A large part of this was due to Redfield’s popular book Zoölogical Science (1858); this was the elaboration of the wall chart in text form, although, as I will discuss later, it contained its own tree of the animal kingdom. The Swiss-born Louis Agassiz, an internationally renowned Professor of Zoology and Geology at Harvard University, praised the book highly (Sommer 2022b, 273).
Redfield’s wall chart is primarily spectacular and of great importance in my context because it is the first use of the tree for zoological classification that I have so far found that includes not only humans as a species, but the human varieties (Sommer 2022b, 273).1 Beyond this unique characteristic, Redfield’s wall chart presents the perfect opportunity to move from the topics of Part I to those of Part II, because she drew on the anthropologists of the first hour whom I discussed in Part I, and, at the same time, she leads us to the issues of the phylogenetic tree and the evolutionary view of life. The latter is the case even though Redfield worked within a religious framework, thus demonstrating that the uptake of the tree image in biology and anthropology could be independent of evolutionary theory. Before paying attention to these issues, however, it is well worth taking a closer look at Figure II.1 itself, for it in fact incorporates not one but three long-standing traditions of thinking and visualizing diversity: it evokes the mappa mundi, the chain of being, and the tree of life. I therefore set out with a consideration of the cultural history of these three iconographies in this chapter.
To begin with, as part of a chain of being that surrounds the tree in Figure II.1, in the four corners of the wall chart, we find hunting scenes (see close-ups in Figure II.2a–d). These scenes are set in Europe (II.2a), Asia (II.2b), America (II.2c), and Africa (II.2d). In each of these, placed in a typical landscape, men (and, in one case, a woman) are using weapons and domesticated animals. In all four images, the figures’ prowess and dignity as hunters is expressed. We are presented with the hunt of a stag with horses and dogs; of a tiger with elephants, rifle, and spears; of a buffalo with horses, spears, and bow and arrow; and of a zebra with horse and spear. The people wear European hats, suits, and a dress; turbans; feather headdresses; and a kind of cape. Adorning the corners of what is therefore also a map, the scenes stand for four continents, the ‘corners of the world’. If we read in a clockwise manner, humankind thus unfolds from the White variety – a motif to which I will return.
Figs. II.2a–d Close-up of Europe (top left), Asia (top right), America (bottom right), and Africa (bottom left) in the four corners of the wall chart by Anna Maria Redfield (1857). With great thanks to the Yale University Peabody Museum and Senior Collection Manager Susan H. Butts for the photograph. Public domain.
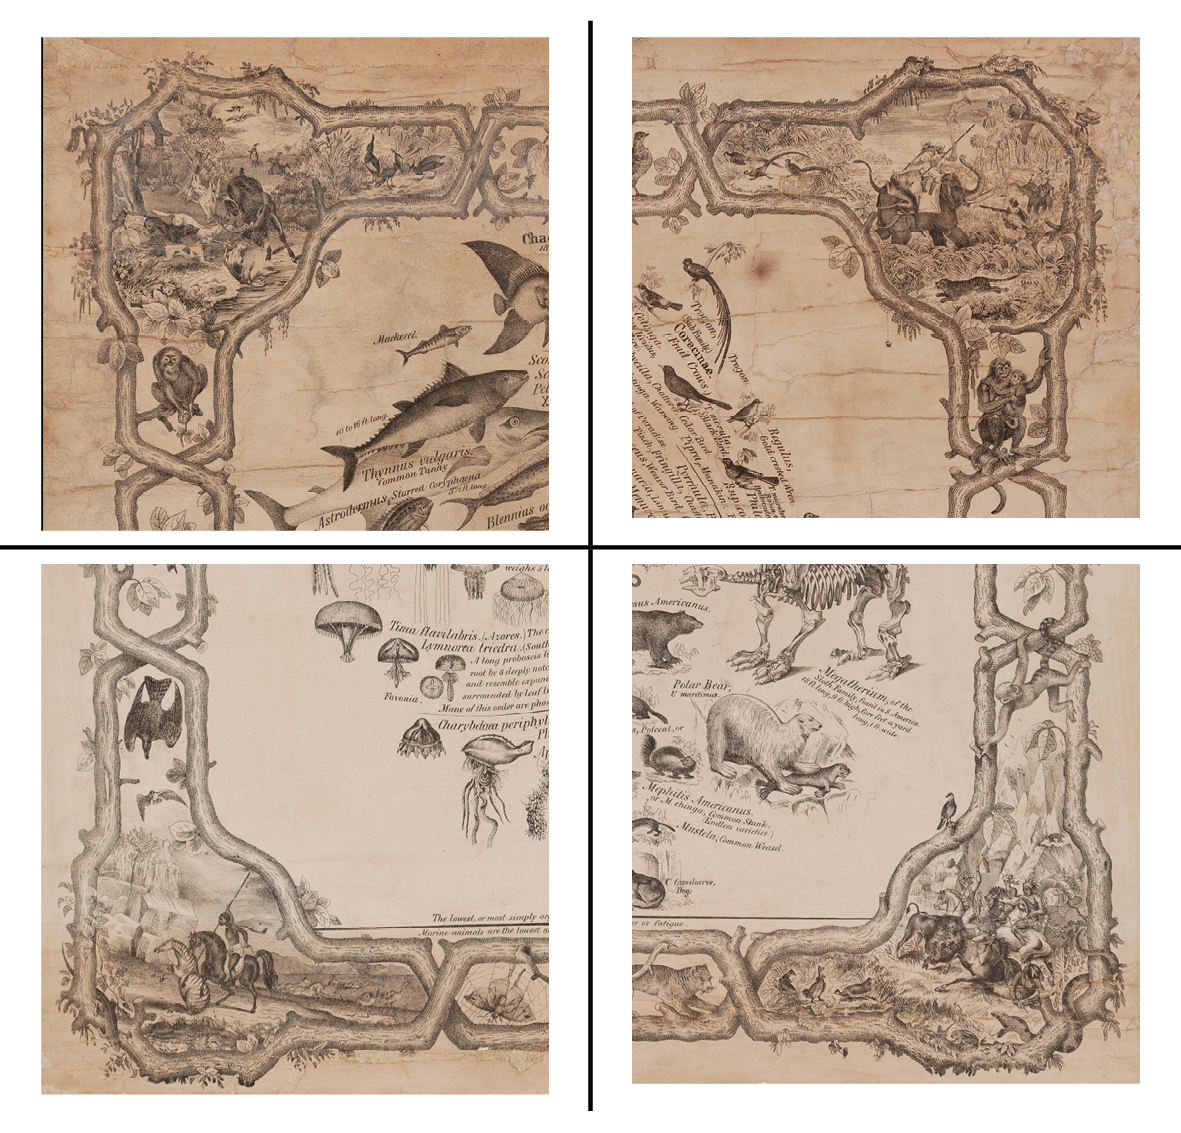
The most prominent early depiction of what David N. Livingstone has called “racial cartography” is the mappa mundi tradition, which stems from the encyclopedist and historian Isidore of Seville, from the sixth and early seventh century (Livingstone 2010, quote on 206; see Figure II.3). These diagrams show the three known continents Asia, Africa, and Europe in a T within an O arrangement, so that the T, or the cross, cuts the space within the O, or the orb, into three parts. The three continents in turn became associated, possibly in the ninth century, with Noah’s sons Shem, Ham, and Japheth, who were posited as the fathers of the main human lines: ‘the Asian, the African, and the European’. Already at that time, their face and skin color, their size and temperament, became linked to the different climates they inhabited (Livingstone 2010, 206–207; also 2008, 5–6).
Fig. II.3 “T and O style mappa mundi (map of the known world) from the first printed version of Isidorus’ Etymologiae (Kraus 13). The book was written in 623 and first printed in 1472 at Augsburg by one Günther Zainer (Guntherus Ziner), Isidor’s sketch thus becoming the oldest printed map of the occident.” “This T and O map, from the first printed version of Isidore’s Etymologiae, identifies the three known continents as populated by descendants of Sem (Shem), Iafeth (Japheth) and Cham (Ham)”. Wikimedia, public domain, https://commons.wikimedia.org/wiki/File:T_and_O_map_Guntherus_Ziner_1472.jpg
However, the historian Benjamin Braude has cautioned that the division of the world into three or more continents did not exist before the seventeenth century. Although the terms ‘Asia’, ‘Africa’ (or ‘Libya’), and ‘Europe’ were used centuries earlier, they did not carry their current meaning. They referred to regions of one world rather than separate continents. They were little more than continental exposures to the Mediterranean Sea. The only tradition in which the tripartite system was constant was indeed that of the Isidorean or T and O maps, which were not maps in the modern sense. They did not represent geographical space, and should thus rather be called Cross and Orb icons. They were not even the work of Isidore of Seville himself, only appearing in copies of his work after his death. The first such icon is of the eleventh century and it only gives the names of Noah’s sons, not the ‘continents’. Neat and clear-cut continental divisions among the three sons were not only absent from the biblical text, they would also have been incomprehensible to the ancient and medieval world. Braude argues that it was only with print capitalism, coincident with the ‘invention of Africa and America’, that the story of the sons of Noah that was more polyphonic in ancient and medieval times began to consolidate. The slaving expeditions to Africa during the fifteenth century aided the association of Ham with black skin and with a curse interpreted as one of serfdom (Braude 1997).
What is important in my context is that Noah’s sons did eventually become associated with the different continents and with their inhabitants – establishing a genealogical geography of the main human types and the human family at large, which has been at stake in Part I of this book, but that, as we will see, reverberates throughout anthropological histories up until today. And this genealogical geography was increasingly hierarchical. With it was established a Christian visual cosmology that already contained the tension between unity and diversity – a diversity with which differential value judgments could be associated. Indeed, since the Middle Ages biblical history could be represented in tree-like forms in which Noah constituted the root, while his three sons were the founding fathers of the branches. Joachim of Flora, in a twelfth-century diagram, had the branches of Japheth (Christians) and Sem (Jews) intertwine, while the branch of Ham was only of short life. In the course of the early modern period, more clearly arboreal shapes came to represent the descent of nations from Noah. And once again, such a tree could be linked also visually (not only conceptually) to the map, as in the case of a Swedish scholar who planted Noah’s tree in the old world, which was drawn on a kind of globe (Hellström 2019, 165–72).
Redfield gave classical renderings of the four continents and their peoples at a time when there were well-established ‘racial hierarchies’. Interestingly, in the wall charts’ chain of being, the European and Asian scenes contain also an ape that is partly separated from the hunting scene, while the American scene features a monkey; the African scene is devoid of this ‘missing link’. Furthermore, her continental scenes in the four corners of the wall chart also resonate with the tradition of allegorical renderings of the four continents, their peoples, animals, and plants on textiles, as ceramics, or on metal, glass, stone, and earth ware (Cooper Union Museum for the Arts of Decoration 1961; Le Corbeiller 1961).
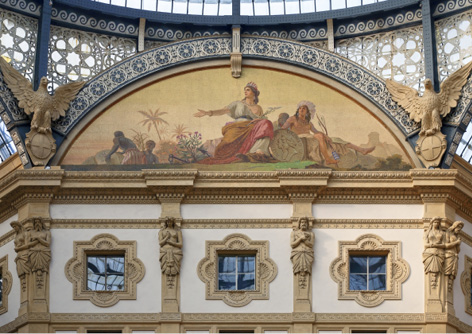
Fig. II.4 ‘America’ in the octagon of the Galleria Vittorio Emanuele II, around 1880. Photograph by © Benjamin Hemer, all rights reserved, reproduced by kind permission of the artist, https://imaginoso.de/italien/mailand/viktor-emanuel-ii-galerie-luenette-amerika-oktagons
A ‘racial geography’ that like in Redfield’s scheme depicts the continents with their peoples in one image and arranges them in space is most common in drawing or painting, such as in Andrea Pozzo’s spectacular ceiling fresco Triumph of St. Ignatius of Loyola, completed in 1685 for the Church of Sant-Ignazio in Rome (Müller-Wille 2021) or in Giovanni Battista Tiepolo’s ceiling fresco in the Residenz in Würzburg (1753). A later classical rendering can be found in the Galleria Vittorio Emanuele II in Milan. The shopping arcade opened in 1867 and is decorated with four mosaics (originally frescos) of the continents on opposite walls of an octagonal hall leading into different corridors. It seems that, befitting colonial times and a mall celebrating the wealth of things one could acquire in Italy, in each painting, local people are offering goods to a female. Indeed, in ‘America’, the female figure is sided by a Native American man but to her right are enslaved people from Africa (see Figure II.4). The White female in each of the four pictures could either represent the four continents (‘Africa’ in fact was given Egyptian attributes), or they could all be personifications of Europe, who (maybe with the exception of ‘Africa’) is only slightly adjusted to the different continents through her headdress.2
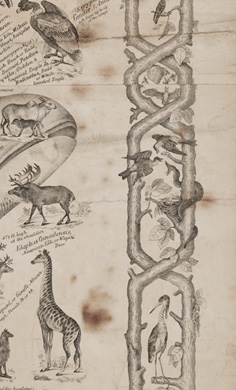
Fig. II.5 Close-up of aspects of the chain of being in the wall chart by Anna Maria Redfield (1857). With great thanks to the Yale University Peabody Museum and Senior Collection Manager Susan H. Butts for the photograph. Public domain.
The four corners of the earth are embedded in a chain of being in Redfield’s wall chart. This chain of being communicates with the tree that it frames through its botanical rendering. It is itself made-up of two wooden stems, intertwined to form a chain, that sprout little branches with leaves. Within the chains, animals of different kinds are nested, without any apparent order. Some chains contain diverse animals such as an insect and a squirrel, or a tiger with its prey (see Figure II.5).
The chain of being as the underlying order of all things expressing the will, power, and goodness of God was also part of medieval Christian cosmology. The historian Arthur O. Lovejoy (1964) has paid particular attention to the concepts of plenitude, continuity, and gradation the chain embodies, which are themselves historically versatile elements (Wilson 1987). From these concepts developed by Plato and Aristotle, scholars conceived a linear scale of perfection in which all natural entities would have to be arranged (metaphors of chains, cords, ladders, and stairways for the natural order go very far back in Middle Eastern and European intellectual and religious thought). However, in Redfield’s wall chart, the chain of being is morphed into a highly vivid botanical and zoological visual metaphor, framing the tree of life and connecting the different peoples of the earth. It is a closed chain, thus appearing nonhierarchical, rather emphasizing the unity and completeness of creation.
The simultaneity of horizontal and hierarchical imagery rather seems to be due to the tree of life that figures most prominently in Redfield’s wall chart. In fact, the tree of life could also present a hierarchical scale of nature (Gontier 2011, 523). While Redfield did not use the expression ‘tree of life’ in her accompanying Zoölogical Science (simply referring to the wall-chart image as a ‘tree’), historians have attributed an important role to the tree-of-life iconography. This symbolic and mythic tree is one of the oldest and most universal images, related to notions of cosmic origin and unity, growth, fertility, and regeneration or rebirth. Visualizations go back to ancient times, and in the Christian Middle Ages it could recount the history of Christ or of humankind on its way to salvation (Philpot 1897; James 1966; Cook 1988; Demandt 2005; 2014). In Genesis, the tree of life, together with the tree of knowledge of good and evil, appears at the center of the Garden of Eden. It figured regularly in medieval illustrations of the Fall as a symbol of the way to salvation as expressed by Christ. This liminal quality was emphasized in early Christian art by positioning the tree of life on portals, sarcophagi, and tombs. The botanical iconography varied because of diverse biblical references but also due to the fact that, in the Middle Ages, there was as yet no categorical distinction between a tree, a shrub, or a vine. Artists portrayed the tree of life in various forms, sometimes as botanically unidentifiable, and other times as a vine, acanthus, fig, olive, date palm, or a combination of these plants. Thus, as in the mosaic pavement on the floor of the Cathedral of St. Maria Annunziata in Otranto, Italy (1163–65), the tree of life often does not look very tree-like to the modern beholder. In this image of the history of the world, men climb and fall from the tree’s branches in their struggle to get away from the Fall and move towards the altar, or heaven. There is therefore a clear direction to ‘history’ that is associated with progress in the sense of salvation (Salonius 2020).
Further according to Pippa Salonius, not only the tree of life (lignum vitae) but also the tree of Christ (tree of Jesse) could offer an optimistic image of a growth towards heaven and map a path towards God:
Vertical growth was fundamental to the diagrammatic structures of the Tree of Jesse, the Lignum vitae and the ordensstammbäume, which were all meant to be read proceeding heavenward through the founding ancestor […] to culminate in a visual reference to God. The upward progression of the arboreal schemata should be read as a transition from earth towards the heavens, from the human towards the divine, an ascent towards spiritual perfection. (Salonius 2020, 321)
In the Old Testament’s Book of Isaiah, Christ is a flower growing from the root of Jesse, which gave rise to the successful iconography of the tree of Jesse beginning in the eleventh century. Such trees could be a summary of salvation and lead the contemplating on his or her own way to salvation along the axis of the son of God’s earthly ancestry. In this sense, the tree of Jesse could also be a tree of life. Furthermore, although Salonius adds that genealogies of Christ and trees of life differed from dynastic stemma that were read from top to bottom or from the arbores consanguinitates that did not have tree imagery until the thirteenth century, the arbores, too, could help in the conceptualization of time and history. Their main role was to determine degrees of family relatedness that were under the incest prohibitions (see Figure II.20 below). However, in a few cases in the twelfth century, they were regarded as supplementary to biblical genealogy, connecting human history to individual family history. Complementing the stemmata of Christ’s genealogy, they, too, were identified with the lignum vitae. These special cases of arbores consanguinitates looked particularly tree-like. In historical treatises, an arbor consanguinitatis could work as a reflection on the human dimension of time, and it could also appear in the context of genealogies of earthly dynasties (Worm 2014).
These elements of the tree of life in its diverse forms, the Christian image of unity and diversity, of genealogical continuity in humankind, of history and progression, as well as the atypical iconography for our current understanding, are remarkably present in Redfield’s tree. Her wall chart shown in Figure II.1 looks more like a fern than a tree, and is, in fact, reminiscent of some of the tree-of-life imagery, such as Figure II.6 with its bending branches, its fruits, leaves, and multiple parallel roots.
Fig. II.6 Tympanum, Altneushul, Prague, circa 1260. Photograph by Paul Asman and Jill Lenoble (2015), https://www.flickr.com/photos/pauljill/25752643044/, CC BY 2.0
Of course, by Redfield’s time, tree iconography had become most prominent in family genealogy. In the early modern period, royal and princely families, nobility, and urban elites legitimated their authority and guaranteed the transfer of power and wealth through the demonstration of great antiquity and noble bloodlines in the form of family trees (especially in Germany, but also in Great Britain, France, and Italy) (Heck 2000; 2002). While between the sixteenth and seventeenth century, genealogy was ‘scientized’ and based on family and state archives (Kellner 2004; Klapisch-Zuber 2004; Gierl 2012, 102–112), up to about 1800, family trees could still be généalogies fabuleuses [fantastical genealogies] and reach back to national chieftains of the Migration Period and even to Trojans or Adam (Bizzocchi 2010). The family tree was instrumental in the transfer from religious to secular legitimation of noble and mostly male sovereignty. Therefore, while related to technologies of antiquity, tree building is seen as a sign of scholarly modernity, also as a tool in the service of clarity and reduction of complexity at a time when the amount of knowledge appeared increasingly unmanageable (Blair 2010). By the nineteenth century, genealogical tree building had become a popular practice, and was, for example, taught in English schools (Castañeda 2002, 59; Sommer et al. 2018, 6; Sommer et al. 2024). Figure II.7 is a particularly striking example, as it connects the members of the imperial family through bodily material.
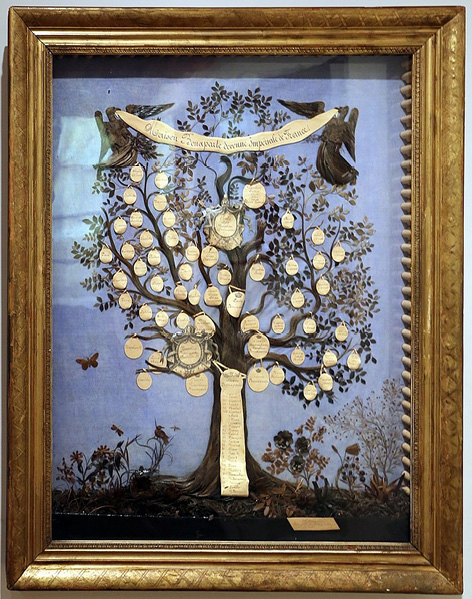
Fig. II.7 “Maison Bonaparte devenue Impériale de France”, a family tree made out of hair by Elisa Montazzi, second half of the nineteenth century, Musée de la Maison Bonaparte. Photograph by Sailko (2019). Wikimedia, CC BY 3.0, https://commons.wikimedia.org/wiki/File:Albero_genealogico_della_famiglia_bonaparte,_1850_ca.jpg
While I can only speculate how far the above religious and secular traditions influenced Redfield’s choice of visual metaphors, several developments took place that show the family resemblance between the three diagrammatic traditions intertwined by Redfield – map, scale, and tree – also in the history of natural history.
1 J. David Archibald includes the image in his concise history of visualizing the natural order, but without noticing this unique feature, the inclusion of the human varieties (Archibald 2014, 74–76).
2 In the few sources on the paintings/mosaics that I have found, the females are taken to represent the different continents, without discussing the issue that they exhibit what was taken to be a European appearance (e.g., Bandmann 1966, 81).