7. Map, Scale, and Tree in
Natural History
© 2024 Marianne Sommer, CC BY-NC-ND 4.0 https://doi.org/10.11647/OBP.0396.09
It was in the eighteenth century that the image of the chain or scale of nature was most influential. It was seen as representing the order in God’s creation, including the conception that every individual and social class had a designated place in the order of society and every group of humans had a position in the hierarchy of civilizations, which were to be accepted and filled to the best of everyone’s ability (Diekmann 1992, 53–81). There are, in fact, artistic images that express orders of social rank (see, e.g., Archibald 2014, 6–7). I have not come across a similar visualization of the human ethnic varieties, although one can of course regard the instrumentalizations of Camper’s series of skulls/heads for the purpose of the hierarchization of the human ‘races’, such as carried out (visually), for example, by the English anatomist and polygenist Charles White in An Account of the Regular Gradation of Nature in Man (1799), as such scales of the human varieties (Bowler 2021, 71–72). Certainly, in natural history more generally, the linear scale was seen as the underlying order arranging all natural entities according to rungs of perfection.


Fig. II.8 “Entwurf einer Leiter der natürlichen Dinge” [Draft of a ladder of the natural things]. J. A. E. Goeze, in Charles Bonnet, Herrn Karl Bonnets Abhandlungen aus der Insektologie (Halle: Bey J. J. Gebauers Wittwe und Joh. Jac. Gebauer, 1773), Vol. I, pp. 57–58. Public domain.
Figure II.8 shows a scale of perfection of the natural world. It appeared in the German translation of a treatise on insects by the famous Swiss naturalist Charles Bonnet. Bonnet, too, had a diagram of the scale of nature (scala naturae) in his original (1745, after preface), but the translator complexified it by adding a second column to emphasize the role of intermediaries. Thus, humans were linked to the four-footed animals via half-humans, orangutans, and monkeys. The categories in the right column connected each class of animals, plants, stones, salts, metals, and earths of the left column to the class above and below. While the scale of nature, especially in the way rendered by this translator, therefore nicely captured gradation and perfection, the idea of fullness was even more strongly expressed in the chain of being. For a chain to work, it needs all its links – hence the associated search for ‘missing links’, also expressed in Figure II.8: the right column is headed “Verbindungswege”, approximately ‘connecting links’, that is, links that are not missing. These connecting links not only joined classes of animals as well as animals and plants, but also the organic and inorganic world, and even integrated the different natural elements.
While in antiquity and the Middle Ages, there was held a primarily static view of nature frequently expressed in the image of the scala naturae, the idea of nature as well as the scale of nature could acquire a dynamic aspect in the early modern period (Thienemann 1910). Lovejoy saw the chain of being as taking on a dynamic form with the German polymath Gottfried Wilhelm Leibniz, who could conceive of the possibility that perfection had not once and for all been given, but gradually approached in a process of development. It is unclear how much branching the linear progress in this scheme of the chain did allow for, but it seems that Leibniz, and later the German philosopher Immanuel Kant, worked with notions of diversification as well as continuous development. With thinkers like Georges-Louis Leclerc, Comte de Buffon, too, the eighteenth century witnessed speculations about the transformation of species, even if in a limited sense and mainly still within the rather rigid pattern of the scale of nature (Lovejoy 1964, 242–87, with 256–59 on Leibniz, 265–68 on Kant; Rheinberger 1990; Sloan 2006).
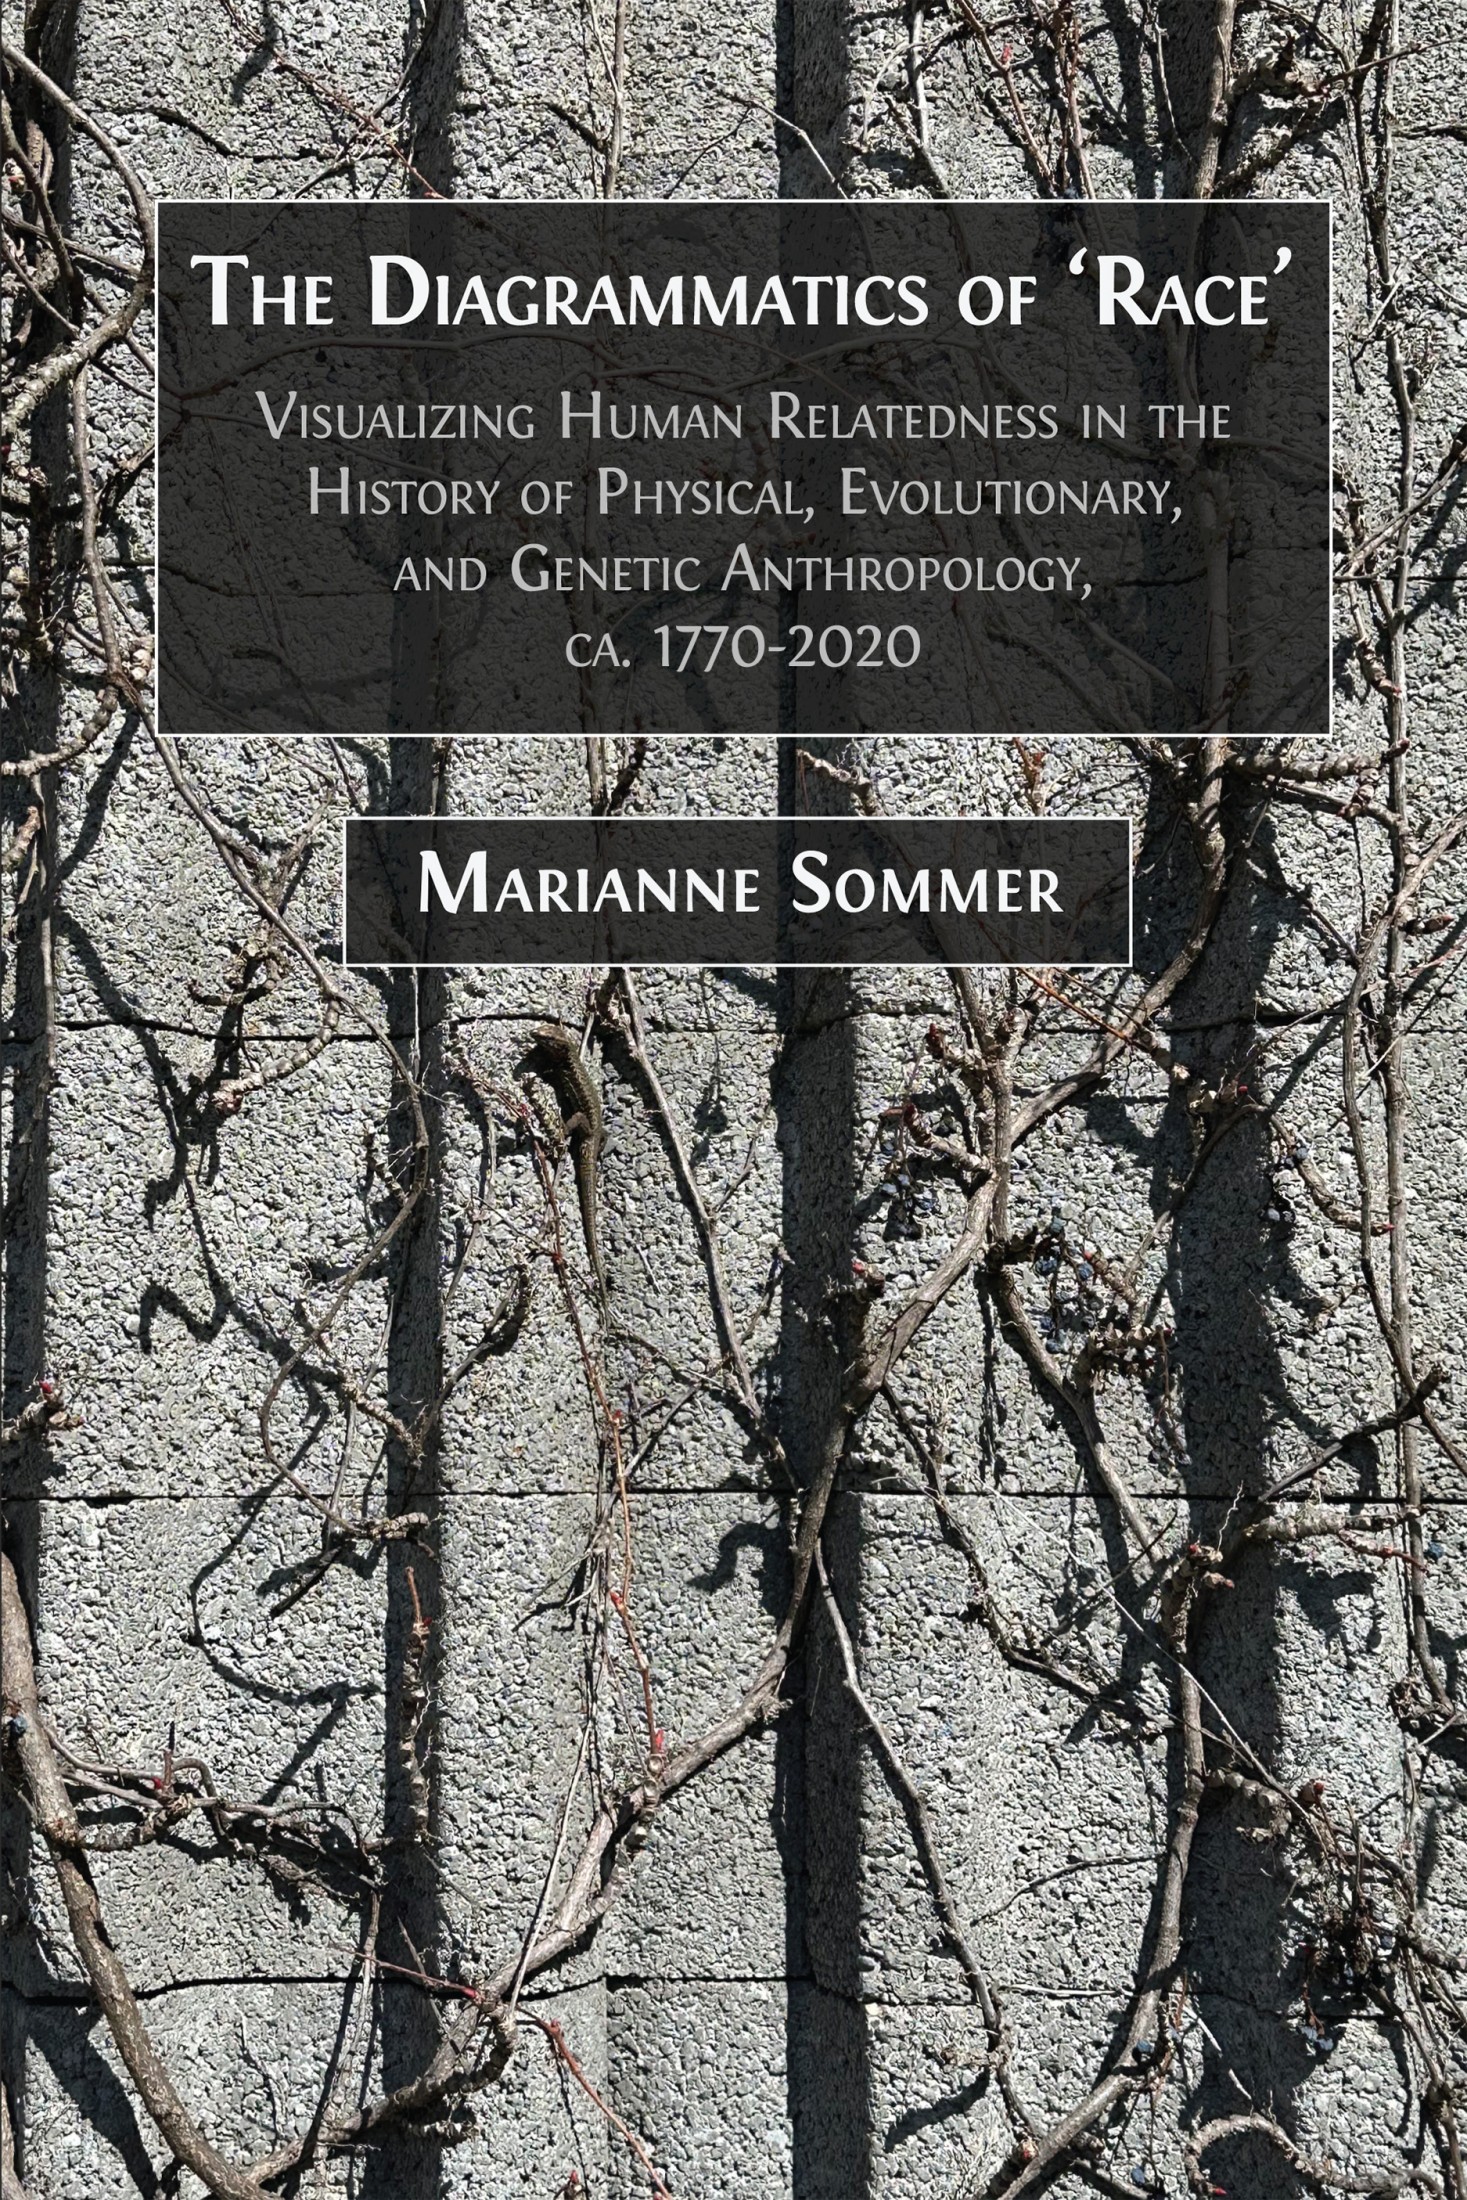
The linear scale was certainly put to the test by the vast expansion in knowledge of animals and plants from many parts of the world during the seventeenth and eighteenth century; it caused an “Erfahrungsdruck” [pressure of experience] (Lepenies 1976, 63) that forced natural historians to experiment with diagrams to capture the bountiful diversity of life. In one sense, the ladder literally exploded, so that Bonnet talked of a nearly infinite number of scales of perfection (1745, xxx), and he speculated whether the scale of nature, which he had so influentially visualized diagrammatically, actually had branches (Bonnet 1764; see, e.g., Thienemann 1910, 250). The Berlin zoologist Peter Simon Pallas described a tree in 1766 that illustrated an original separation in animals and plants, and in which, within the animal kingdom, the branches of insects and birds diverged from the ideal scale of increasing complexity from fish to amphibians to quadrupeds (see, e.g., Thienemann 1910, 251). The concept of the scale of nature remained clearly dominant in the image of the Baltic German geologist Karl Eduard von Eichwald in the early nineteenth century. Even though he called it a tree, or more precisely a tree of life (“Arbor vitae animalis”, Eichwald 1829, 41), one rather recognizes several parallel scales of being (see Figure II.9) (Ragan 2009, n.p.; Archibald 2014, 57–59).
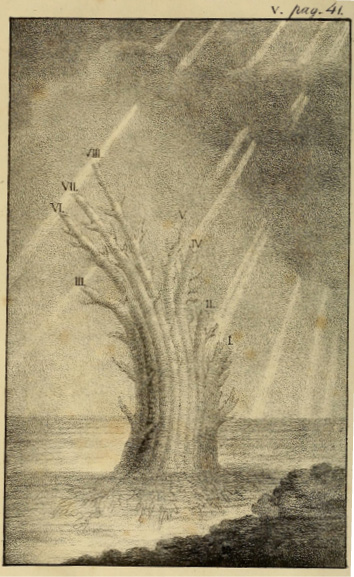
Fig. II.9 “Arbor vitae animalis” [Tree of life of the animals]. Karl Eduard
von Eichwald, Zoologia […] (Vilnae: J. Zawadzki, 1829), Vol. I, between p. 40 and p. 41. Public domain.
As the historian of science Petter Hellström (2019, 57–135) has shown, the French naturalist Augustin Augier, too, failed to arrange all plants in one continuous series, which made him consider the genealogical tree as the natural botanical order, albeit a family tree that was made up of several ladders. It was presumably the first published classificatory tree, and its iconography interrelated elements of natural trees with elements of heraldry (Augier 1801, foldout after preface). Drawing on the genealogical social fabric of Old Regime France, Augier employed terms such as ‘kingdom’, ‘tribe’, ‘class’, ‘order’, and ‘family’ instead of the prominent ‘genus’, ‘species’, and ‘variety’, again demonstrating the interrelatedness of the social and natural order. However, the tree had by no means become the main model. When at the end of the seventeenth century debates emerged in natural history about whether diagrams were able to reflect the natural affinities among organisms, other forms were suggested (Sloan 1972; Lefèvre 2001; Scharf 2009; Müller-Wille 2014). Carl von Linné introduced the metaphor of the map of life, and up until Darwin’s influence, in botany and zoology, relatedness was predominantly represented by keys, map-like and reticulate diagrams. This diagrammatic imagery had crisscrossing lines to interconnect organisms in all directions; or it used blobs, circles, or polygons to represent nested groups of affiliated organisms (Rheinberger 1986; Barsanti 1988; 1992; O’Hara 1991; Larson 1994; Ragan 2009; Rieppel 2010; Archibald 2014; Sommer et al. 2018, 6–8).
Maps of variously adjoining territories could better capture the still widely held notion of a nature that does not take jumps, but that, once entirely known, would fill each and every niche with kinds of organisms. As August Thienemann (1910, 247–57) has already discussed, for some eighteenth-century naturalists, this could also be achieved by the chain of being. Naturalists multiplied it, and provided the chains with links to interrelate to the degree of forming nets, or threads interwoven to tissue. The ways in which affinities were conceptualized therefore seem to have suggested three-dimensional constructs, with groups of organisms touching on others in their diverse characteristics all around – as in the case of the Italian natural historian Vitaliano Donati, who in the mid-eighteenth century connected the chains through links into a net, and of Lorenz Oken, in whose mind the ladder became a ‘stereotic’ net, i.e., a ladder, the basis of which was a net.1 Chains could thus not only form ‘trees’, as in Eichwald’s case, but also anastomose to form other three-dimensional bodies like networks or maps (also Giessmann 2007).
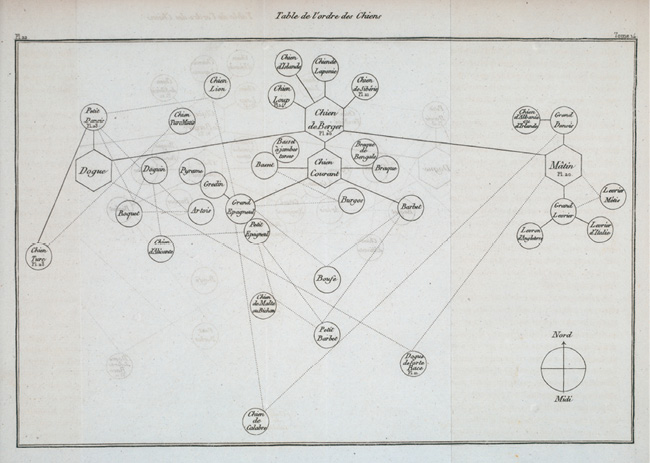
Fig. II.10 “Table de l’ordre des chiens” [Table of the order of the dogs]. Georges-Louis Leclerc, Comte de Buffon, Histoire naturelle […] (Paris: l’Imprimerie royale, 1755), Vol. V, between p. 228 and p. 229. Public domain.
These complex diagrams were mainly not created with the ambition to introduce a temporal dimension or speculate about common descent, and this was true even for the few diagrams that did resemble trees like Augier’s Arbre botanique [botanical tree] discussed above (Hellström, André, and Philippe 2017). The only exception seems to have been diagrams that illustrated relations of hybridization and geographic variation among races within one species. The French botanist Antoine Nicolas Duchèsne drew the descent of cultivated kinds of strawberries as a genealogical ‘tree’ (“Généalogie des fraisiers” by Duchèsne 1766, opposite 228; e.g., in Toepfer 2011, 40), thereby suggesting connections between the tree diagrams in human family genealogy and in plant and animal breeding – connections that Augier made explicit for his botanical tree of 1801 (Ratcliff 2007). Similarly, Buffon’s “Table de l’ordre des chiens” [table of the order of dogs] connected breeds or races of dogs in a net-like diagram (1755, between 228 and 229; see Figure II.10 above). Also Buffon conceived of his diagram as a genealogical tree, but one that was oriented like a geographical map. He thought about the genealogy of dogs in analogy to human family genealogy on the microlevel, and to the genealogy of humankind’s descent from Adam on the macrolevel (Hellström 2019, 84–91). Thus, Buffon introduced what we will encounter throughout this history of relating diagrams: a tree-map structure that integrates temporal and spatial elements.2 The diagram relates to a story of common origin and subsequent differentiation through distribution in space (into different climates).
According to the historian of science Olivier Doron (2012), it was Buffon who introduced a decidedly genealogical understanding of races and species into natural history, an understanding that influenced successors like Blumenbach and Prichard. Prior to the mid-eighteenth century, natural history followed the model of botany in a classificatory approach according to differences and affinities. For example, the family did not express kinship but logical relationships. Before the eighteenth century, ‘race’ was used in nobiliary discourse for different royal dynasties and nobility; ‘race’ could also refer to the transmission of sin and spiritual status, as in the human race whose members all inherited the original sin through descent from Adam. The third area where ‘race’ was prominent prior to the eighteenth century was breeding, and natural historians from Buffon to Prichard used it as an analogy for the new way of conceptualizing humankind: “Through Buffon’s analysis, it is the whole vocabulary of kinship, the entirety of genealogical knowledge from nobiliary, juridical or breeding practices which enters natural history” (Doron 2012, 101). ‘Race’ thus pertains to the genealogical style of reasoning. Reproduction was made the basis for classification and the understanding of species and races as natural categories. However, when Buffon went so far as to carry this line of reasoning ‘within family genealogy’ to its ‘logical’ end in the conception of the living world as descended from a single species, he rejected such a notion as contrary to the authority of the Bible (Doron 2012; 2016).
This is not to say that the Enlightenment did not also bring forward notions of ‘true’ evolution, such as most forcibly expressed by Lamarck’s Philosophie zoologique (1809) in the new century. Nonetheless, although Lamarck was clearly working with the transformation of species and did use the branching structure to visually communicate that idea (with more ‘trees’ in his Histoire naturelle of 1815),3 even within his framework, the ideal order underlying the diversity of life was still the linear series, and Lamarck relied on ongoing spontaneous creation. Again, the ‘branches of his trees’ stood rather for deviation from the ideal chain (in his case due to adaptation) than for the crucial element of his theory of transformation. Thus, the phylogenetic tree to represent the branching transformationist view of biodiversity appeared later in the nineteenth century (Tassy 2011; also 1991; Pietsch 2012, 7–9). Even in the early decades of the nineteenth century, naturalists still used diverse geometric figures, often including circles, to suggest affinities and/or analogies between organisms (Illies 1983; Ragan 2009; Toepfer 2011, 34–36; Sommer et al. 2018, 6–8; Bowler 2021, 27–41, 177–78).
That for some naturalists the tree diagram to convey natural orders presented serious problems might be elucidated with an example from Agassiz. Agassiz was strongly opposed to transformationist ideas, but nonetheless combined the structure of the zoological map with that of the genealogical tree in his influential Recherches sur les poissons fossils (1833–43) (see Figure II.11). Once again, this was done due to the inadequacy of the model of a single series, but by this time, also to bestow a historical dimension on affinities between groups: fish would show such affinities among themselves at each moment in time, and also with those forms that existed before and those that came to exist after. In his description of Figure II.11, Agassiz already made it clear that he was well aware of the support the shape of a true tree would lend to an evolutionary interpretation. In contrast, his tree-map had a historical dimension without implying the transformation of species; it stood for repeated divine creative intervention. This was visualized by groups of fish appearing and disappearing through geological time. Indeed, one would hardly think of the image as a tree, because it shows the orders of fish in parallel to each other. Agassiz expressly noted that he did not connect even the families within each order to ‘the main stem’, because he did not believe in genealogical relations between them, all the same referring to the diagram as a genealogy of the fish class. Finally, Agassiz also indicated the prevalence of a species by the breadth of the ‘branches’, as he called them (Agassiz 1833, Vol. I, 169–71 and accompanying diagram; Archibald 2014, 69–70; Hellström 2019, 123).
Fig. II.11 “Généalogie de la classe des poissons” [Genealogy of the class of fish]. Louis Agassiz, Recherches sur les poissons fossiles (Neuchâtel: Petitpierre, 1833), Vol. I, opposite p. 170. Public domain.
Agassiz’s colleague, the German geologist and paleontologist Heinrich Georg Bronn, included similar images in his highly diagrammatic Untersuchungen über die Entwicklungs-Gesetze der organischen Welt während der Bildungs-Zeit unserer Erd-Oberfläche (1858). These diagrams visualized the appearance, existence, and disappearance as well as prevalence of taxa throughout geological time. According to Bronn, they demonstrated that the groups of organisms appeared when and where the circumstances were suitable to them, the less ‘perfect’ groups generally appearing earlier. Being initially similar, the groups increasingly differentiated over time, as did their surroundings. However, this progress towards the present was not brought about by transformation, but by novel creations (Bronn 1858, 484: “fortdauernde Schöpfung neuer Arten”). Most astonishingly, Bronn used a veritable tree in his book (see Figure II.12). He explained that the tree shape was the only one that could express the above findings: higher types could be placed higher up in the tree, even though they might belong to a branch that appeared earlier than that of less progressive forms that were lower down the tree. Thus, in Figure II.12, f on branch A is more advanced than d, but its branch A appeared before B, and f on branch A is on the same level as f on branch E, although branch E is younger and thus started off in a more progressed form than A. A to G might refer to groups of invertebrates, to fish, reptiles, birds, and mammals, with the top of the tree signifying the human line. Bronn did not differentiate humankind further – neither in his tree nor in his text (Bronn 1858, 481–82; Archibald 2014, 76–78). Thus, Bronn demonstrated the ability of the tree diagram to code for scales of progression.
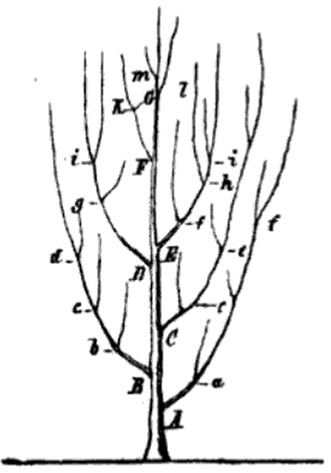
Fig. II.12 “Baum-förmige[s] Bilde des Systemes” [Tree-shaped image of the system]. Heinrich Georg Bronn, Untersuchungen über die Entwicklungs-Gesetze der organischen Welt […] (Stuttgart: E. Schweizerbart, 1858), p. 481. Public domain.
While Bronn’s tree once again illustrates that the tree diagram was not necessarily associated with an evolutionary understanding of the organismic world, Agassiz placed the tree squarely in the transformationist approach. Agassiz’s hybrid figure was a way to work around the tree, and it once again renders clear that naturalists experimented with and integrated elements from diverse visual traditions to arrive at diagrams that seemed to capture best their understanding of the natural order. Agassiz’s diagram makes visible a tendency generally manifest in relating diagrams, including, as we will see, diagrams of the human varieties: newly introduced diagrams may retain older conceptions of the order of nature, while extant diagrammatic traditions can be adjusted to incorporate new ideas. It also seems that there was no clear line of development, from, say, a linear chain or scale to a tree, and eventually to a network or map (a linear development that has sometimes been suggested, e.g., Kull 2003). The network appeared early as a diagram of relatedness, and elements of the three kinds were often combined. Diverse fields might have influenced the ways in which organismic relatedness was visually conceived, from Christian cosmology and iconography, religious and secular genealogy, plant and animal pedigrees, to imagery specifically developed in natural history.
The above observations can also be made for Redfield’s trees, which were produced around the same time as Bronn’s but which also subdivide humankind. I speak of ‘trees’ in the plural, because there was a second tree that prefaced her Zoölogical Science (1858) (see Figure II.13). While the rendering of the tree in the artistic wall chart exhibits inspiration from the iconography of the corners of the world, the chain of being, and probably the tree of life in its various religious expressions (see Figure II.1), her book and its frontispiece more clearly evidence her acquaintance with natural history and its images, certainly with Agassiz’s diagram. Redfield’s trees and book were intended to illustrate the natural relations between animals in order to acquaint school children with zoological classification. Like Agassiz and Bronn, Redfield did not believe in the transformation of species and would not begin to do so after the publications of Darwin and others – her textbook Zoölogical Science of 1858 was re-issued until 1874. This did not prevent her from drawing on Darwin’s natural history, and she also included fossil animals in her wall chart. What Redfield’s trees show are the four branches of the animal kingdom after George Cuvier: Radiata, Mollusca, Articulata, and Vertebrata (Archibald 2014, 74–76). The branching structure of this order is implied in Cuvier’s term embranchements. With his classification of the living forms in four branches standing beside each other, Cuvier (1817, xx–xxi, 57–61), himself not working within a phylogenetic framework, opposed the concept of the scala naturae, the linear series of organisms.
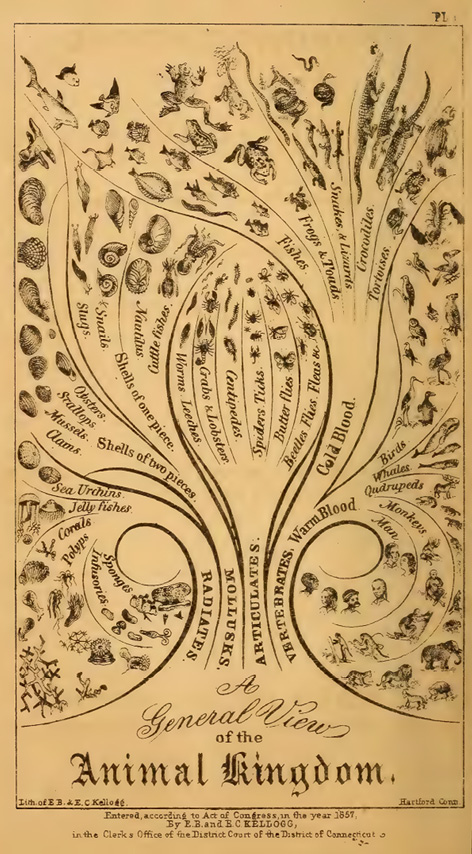
Fig. II.13 “A General View of the Animal Kingdom”. Anna Maria Redfield, Zoölogical Science […] (New York: E. B. and E. C. Kellogg, 1858), Plate 1, frontispiece. Public domain.
Interestingly enough, in Redfield’s trees, humans are not at the top, as in Bronn’s tree, and as the chain of being would suggest. However, a closer look indicates that also in Redfield’s wall chart and frontispiece, the ‘natural order’ is still in place. If we read the trees from left to right instead of from bottom to top, we do climb along the branches of the animal kingdom in the direction of increasing organismal complexity. This is supported by the fact that, in her book, Redfield (1858, 20 and 279) drew on the American geologist Edward Hitchcock who visualized ‘man’ literally as a crown – the crown of creation – in his “Paleontological Chart” of the influential Elementary Geology (1840) that was published in over thirty editions (see Figure II.14). Behind Hitchcock’s “two trees” (99) for the plant and animal kingdom stood a non-evolutionary, or rather antievolutionary, rationale in the shape of a ladder towards increasing perfection. Like Redfield after him, Hitchcock structured the animal kingdom on the basis of Cuvier’s four embranchements, arranging them in a way that made them appear to run in parallel. Like Agassiz, Hitchcock already used the iconography of the geological layers to indicate the progression of life through the ages, to which I will return in the context of evolutionary trees in Part III. Seemingly unaware of Agassiz’s visual ‘genealogy’, Hitchcock (1840, 100) thought that he was the first to have come up with such a kind of image, encountering a similar diagram by Bronn (1837, Plate I) only when his own was already in press. The time was obviously ripe for this geo-paleontological visual language, but not for an evolutionary one. In fact, J. David Archibald has argued that once the tree was clearly attached to an evolutionary meaning some twenty years later, Hitchcock no longer included the chart in the editions of Elementary Geology (Archibald 2009, with figure on 578; also 2014, 70–74).
In Redfield’s wall chart, the human varieties not only appear last in the twirl from left to right through the embranchements and their sub-branches as well as within their own branch of the mammals (and thus quasi ‘at the top of the tree’), they also form a ‘hierarchy of races’ with the “White” at the apex and the “Olive”, “Brown”, “[R]ed”, and “Black” varieties approaching the apes and monkeys (see Figure II.15).
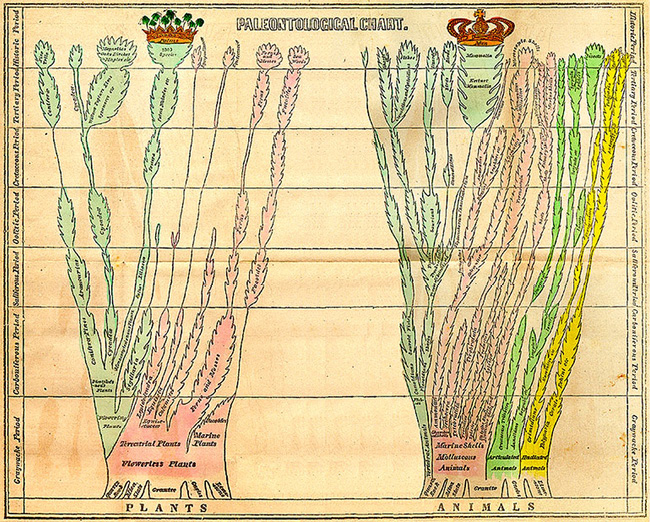
Fig. II.14 “Paleontological Chart”. Edward Hitchcock, Elementary Geology (Amherst: J. S. and C. Adams, 1840), foldout vis-à-vis title page. Wikimedia, public domain, https://commons.wikimedia.org/wiki/File:Edward_Hitchcock_Paleontological_Chart.jpg
At the same time, the frontispiece of Zoölogical Science (1858) rather suggests that the “White race” is the original variety, as the human branch seems to unfold from them (see Figure II.13). Redfield probably had the system of Blumenbach in mind, according to which, as we have seen, the “Mongolian”, “Malays”, “Americans”, and “Ethiopian” diverged from an original “Caucasian” form. Indeed, in the wall chart, we also find his designations, with the addition of Prichard’s alternative for the “Mongolian” (“Turanian of Dr. Pritchard”). Could it be that this is why, in the wall chart as well as the frontispiece, only the ‘Caucasian’ variety is represented by a couple (see Figure II.13 and Figure II.15)?
Despite the fact that Redfield’s diagrams rather relied on Cuvier’s ‘branches’ and Blumenbach’s ‘racial geography’ than on the ‘racial hierarchy’ of the scale of nature, the ‘tree’ in the wall chart is framed by a chain of being, and her ‘trees’ do have a hierarchal structure. Accordingly, within the book Zoölogical Science (1858), Cuvier’s embranchements were reworked into a scale of nature in image and text. The kind of visual technique of having life scenes from different geological epochs follow each other in a column that Redfield employed in Figure II.16 had its own tradition – a tradition that was closely entwined with the use of geological layers as exhibited by Agassiz, Bronn, and Hitchcock in the diagrams discussed above. In congruence with the visual scala naturae of Figure II.16, in the text of Zoölogical Science, Redfield led the reader down through the animal kingdom from the Bimana or humans (of the vertebrates) down to the protozoa (of the radiates). The Bimana were presented as the link between the animals and the spiritual beings. And in the text, she also applied the scale to produce clear hierarchies within the climatically and culturally based human varieties, from the Khoekhoe to the “Caucasians”: “In respect both to mental power, and attainments in art and science, the Caucasians have ever stood in the foremost rank” (Redfield 1858, 29; see Sommer 2022b, 273–76).
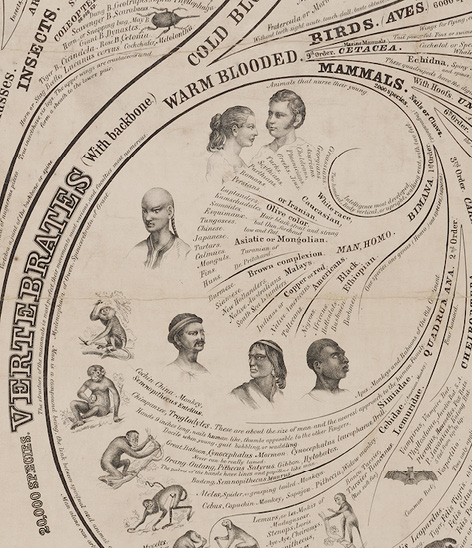
Fig. II.15 Close-up of the human ‘races’ in the wall chart by Anna Maria Redfield (1857). With great thanks to the Yale University Peabody Museum and Senior Collection Manager Susan H. Butts for the photograph. Public domain.
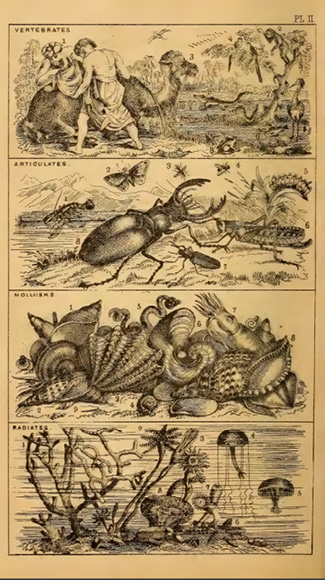
Fig. II.16 Cuvier’s embranchements as a scale of nature. Anna Maria Redfield, Zoölogical Science […] (New York: E. B. and E. C. Kellogg, 1858), Plate 2, p. 16. Public domain.
Already the champion of the scala naturae, Bonnet, had applied the diagram’s linear hierarchy to intra-human differentiation in physical appearance, behavior, morals, intelligence, art, technology, etc. (Thienemann 1910, 239). Redfield, at her point in time, besides characteristics such as skin and hair color, made use of further criteria identified by the physical anthropologists we met in Part I to substantiate the ladder, such as the shape of the skull and face as among other things captured by the facial angle. Redfield (1858, 30) also quoted Morton as the reference regarding the different brain sizes. At the same time as expressing a racism that was seemingly scientifically based, with Blumenbach and Prichard, she emphasized human unity (29).
Thus, through the wall chart together with the frontispiece and explanations in the book, pupils should learn to differentiate the human ‘races’ physically and mentally. They should then be able to answer the questions in this regard provided in the book (Redfield 1858, 30–31), but, in a mix rather reminiscent of the later Prichard, the teacher may also want to combine this with exercises in geographical and historical knowledge about the customs, religions, degrees of civilization, etc. of the different peoples of the world. In sum, Redfield inscribed herself into the tradition of naturalists who regarded natural history as a way to enhance the love of God and his creation, including the ‘brotherhood of men’, exactly because everything had been adjusted to its place by the creator in perfect gradations (693–94). In the end, despite her reliance on the scale of nature, however, it was the tree shape that could express her vision best also with regard to humankind: the unity and at the same time the diversity, the linear gradation and hierarchy but also the differentiation (Sommer 2022b, 273–76).
As I discuss next, the coexistence of different diagrammatic elements also characterized Darwin’s verbal and visual imagery, even though it was with the works of Alfred Russel Wallace and Darwin that tree metaphors and diagrams came to be used to convey a branching as well as evolutionary understanding of organismic relatedness, a phylogeny of diversification from one or a small number of original forms. In this chapter we have seen that the tree that included human diversity appeared early, if not for the first time, in educational and popular science. This hints at the diagram’s ability to transfer content across scientific disciplines and between science and diverse publics. In fact, Hellström (2019) has discussed the first tree-like structures in natural history, philology, and harmony and found that each of their makers was concerned with pedagogy. This ability of the tree diagram to build bridges that we will notice for exchanges between biology and linguistics may be linked to the ubiquity of tree images in different cultural traditions, but what appears to be so straightforward carries a plethora of suppositions that already concerned Darwin. Darwin was inspired by family genealogy in the application of the genealogical view to humanity at large and, from there, to the entire living world. One might therefore think that the use of tree imagery suggested itself. However, he was skeptical of detailed phylogenies and most likely of the tree diagram in particular in its application to intra-human diversity. He left the excessive phylogenetics to Ernst Haeckel.
1 “Der Standpunkt und die Verwandschaften der Thiere zu einander und zu den übrigen Producten der Natur möge im folgenden Schema übersehen werden, damit es sich sogleich zeige, dass die Natur, weder nach einer blossen Leiter, noch nach einem flachen Neze die Thiere geordnet habe, sondern nach einem stereotischen Neze, nach einer Leiter, deren Basis ein Nez ist” [The position and relations of the animals to each other and to the other products of nature may be looked over in the following diagram, so that it may be shown at once that nature has not arranged the animals according to a mere ladder, nor according to a flat net, but according to a stereotic net, according to a ladder whose base is a net] (Oken 1805, 203).
2 With ‘tree-map’ I refer to diagrams that combine a tree structure with a cartographic arrangement. It therefore differs from what designer Manuel Lima (2014, 144–47) calls ‘treemap’.
3 Archibald (2009, 565) is among those who refer to Lamarck’s branching diagram in Philosophie zoologique (1809, 463) as the first evolutionary tree of life.