
1. Public Investment and Industrial Policy: A Case for More European Union Coordination
Andrea Brasili,1 Tuna Dökmeci,2 Atanas Kolev,3 Debora Revoltella,4 Jochen Schanz,5 Annamaria Tueske,6 and Wouter Van Der Wielen7
©2024 Andrea Brasili et al., CC BY-NC 4.0 https://doi.org/10.11647/OBP.0434.02
Europe needs more investment. Speeding up the climate transition and relaunching EU innovation capabilities require special efforts. Coupled with strategic autonomy and the need to secure stable and clean energy sources, these issues highlight the increasing importance of European public goods (EPGs) and policies that extend beyond national boundaries, as they involve externalities and network effects. However, Europe’s current institutional structure and mechanisms may struggle to meet this challenge. This essay examines public investment trends in the EU, arguing that while public investments have increased, greater coordination and coherence are needed. Three critical axes are identified: the provision of EPGs, policy coordination at national levels, and sufficient funding. Improving the coordination of public investment, particularly in research and development (R&D) and the climate transition, is key to unlocking Europe’s full potential. This chapter emphasizes the importance of initiatives like Important Projects of Common European Interest (IPCEIs) in fostering collaboration across countries and sectors, but argues for expanded and more integrated efforts moving forward.
1.1 Introduction
Europe needs more investment. This simple truth has become something of an imperative or, to put it in Draghi’s words, an existential challenge. Two valuable reports on Europe were released between spring and late summer: Enrico Letta’s report on the single market (2024) and Mario Draghi’s report on European Union (EU) competitiveness (2024). Both highlight the need for a quantum leap in European integration. From a global perspective, recent years have highlighted the urgency of accelerating the climate transition, the need to be prepared for health emergencies, the quest for strategic autonomy, and the importance of securing a reliable and clean energy supply. In addition, Europe should strive to maintain or regain its ability to generate innovations and be at the forefront of technological progress. Draghi’s report suggests the need to mobilize public and private resources to generate the required additional investments (the EU investment share should increase from 22% of GDP to around 27%), given that the public sector cannot undertake the entire effort and the private sector does not have strong enough incentives. The message has been clearly perceived by the European Commission (EC), with Ursula Von der Leyen, in her presentation speech after the election for her second mandate (2024), saying : “Europe needs more investment from farming to industry, from digital to strategic technologies but also more investment in people and their skills. This mandate has to be the time of investment”. The recipe for generating this large public-private effort should be carefully designed. However it is worthwhile to remember that each of the five major topics mentioned by Von der Leyen above highlights the growing role of public goods and public policy as they all involve externalities and network effects (i.e., they share features like generating spillovers and economies of scale) (Buti, Coloccia, and Messori 2023).
A few months prior to the outbreak of the COVID-19 pandemic, Jean Pisani-Ferry and Clemens Fuest argued for the growing need to centrally supply European public goods (EPGs) in a report for the German and French ministries of finance (2019).8 This need has been clearly stated in Draghi’s report as well.9 However, there are risks regarding the current institutional setting’s ability to speed up the provision of EPGs and embedding them in a coherent strategy. As Draghi pointed out in a recent lecture (Draghi 2023): “… as it stands, Europe’s institutional construct is not well suited to carry out these transitions—as a comparison with the US reveals. Here, we are seeing a new focus on so-called ‘statecraft,’ where federal spending, regulatory changes, and tax incentives align to pursue US strategic goals”.
The existence of a strategy to tackle these issues and the coherence of the design of policies at the different institutional levels may constitute a crucial challenge in the coming years for the EU. In fact, public policies and public investment choices should be integrated into a broader vision, including industrial policies, in order to stimulate the needed response in private investment. There are at least three different axes along which the EU should explicitly clarify and measure its ambitions in designing strategies and policies. The first is the provision of expenditures related to EPGs, where the EU may lack political willingness or capability to enforce. An example here is the choices in terms of support for basic R&D in the field of energy, such as nuclear fusion. This is a field in which economies of scale may be decisive. The second axis is the degree of coordination of policies that are left to the national level, like the choices regarding energy efficiency in buildings or incentives and support to climate adaptation expenditures: an insufficient coordination may well result in an inefficient use of resources. The third is the level of funding provided that may be insufficient also at the national level.
In what follows, we show the recent evolution of public investments in the EU from this perspective. Following the overview of recent trends in public investment (public investment is growing, based on aggregate numbers), we move on to highlight where actions seem to fall short of what is needed along the three suggested axes.
1.2 The Ongoing Post-pandemic Increase in Government Investment
The uptake in EU government investment that started in 2017 and accelerated in 2020 has continued in 2023. Nominal government investment increased by about 15% in the EU, comfortably outpacing inflation in the same year (Fig. 1.1). The increase spread across the EU but was particularly strong in Central and Eastern Europe (37%) and in Southern Europe (21%).
The increase in government investment also exceeded that of GDP. The government investment rate, the ratio of government investment to GDP, increased by 0.25% to 3.5%. In the case of Central and Eastern Europe, the government investment rate increased by nearly a full percentage point to 5% of GDP.
High inflation in 2022 along with costly fiscal packages to compensate households and businesses for the massive increase in energy prices meant that real government investment stagnated in the EU (EIB 2024). In 2023, inflation decreased significantly, while nominal government investment recorded its highest annual increase over the past 30 years. This allowed real government investment to grow by 10% in the EU. This increase is even more impressive in Southern Europe (19%) and Central and Eastern Europe (27%).
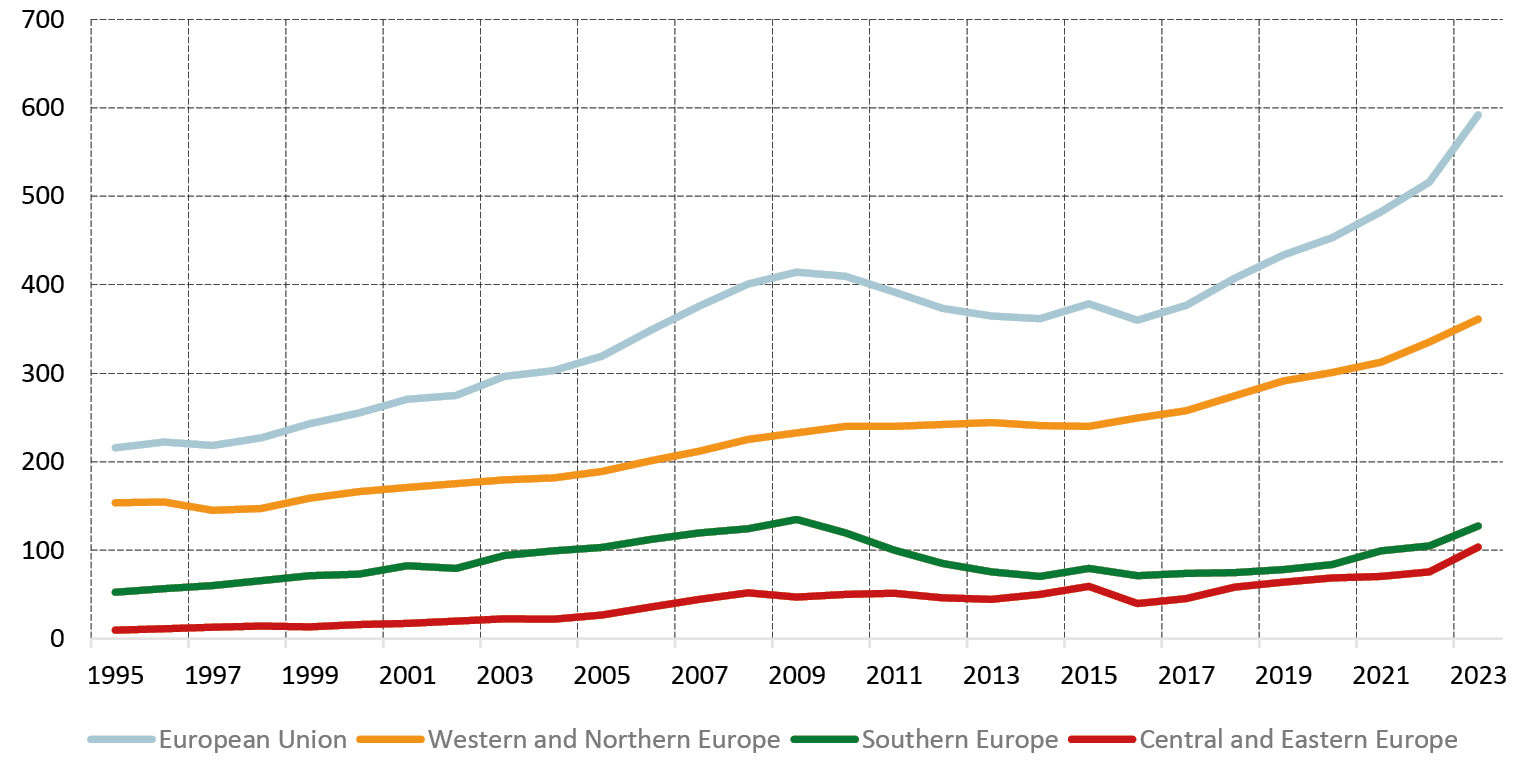
Fig. 1.1 Gross fixed capital formation of the general government (EUR billion). Source: Eurostat and EIB staff calculations. Notes: Western and Northern Europe includes Austria, Belgium, Denmark, Finland, France, Germany, Luxembourg, Netherlands, and Sweden. Southern Europe includes Cyprus, Greece, Italy, Spain, Malta, and Portugal. Central, and Eastern Europe includes Bulgaria, Croatia, Czech Republic, Estonia, Hungary, Latvia, Lithuania, Poland, Romania, Slovakia and Slovenia.
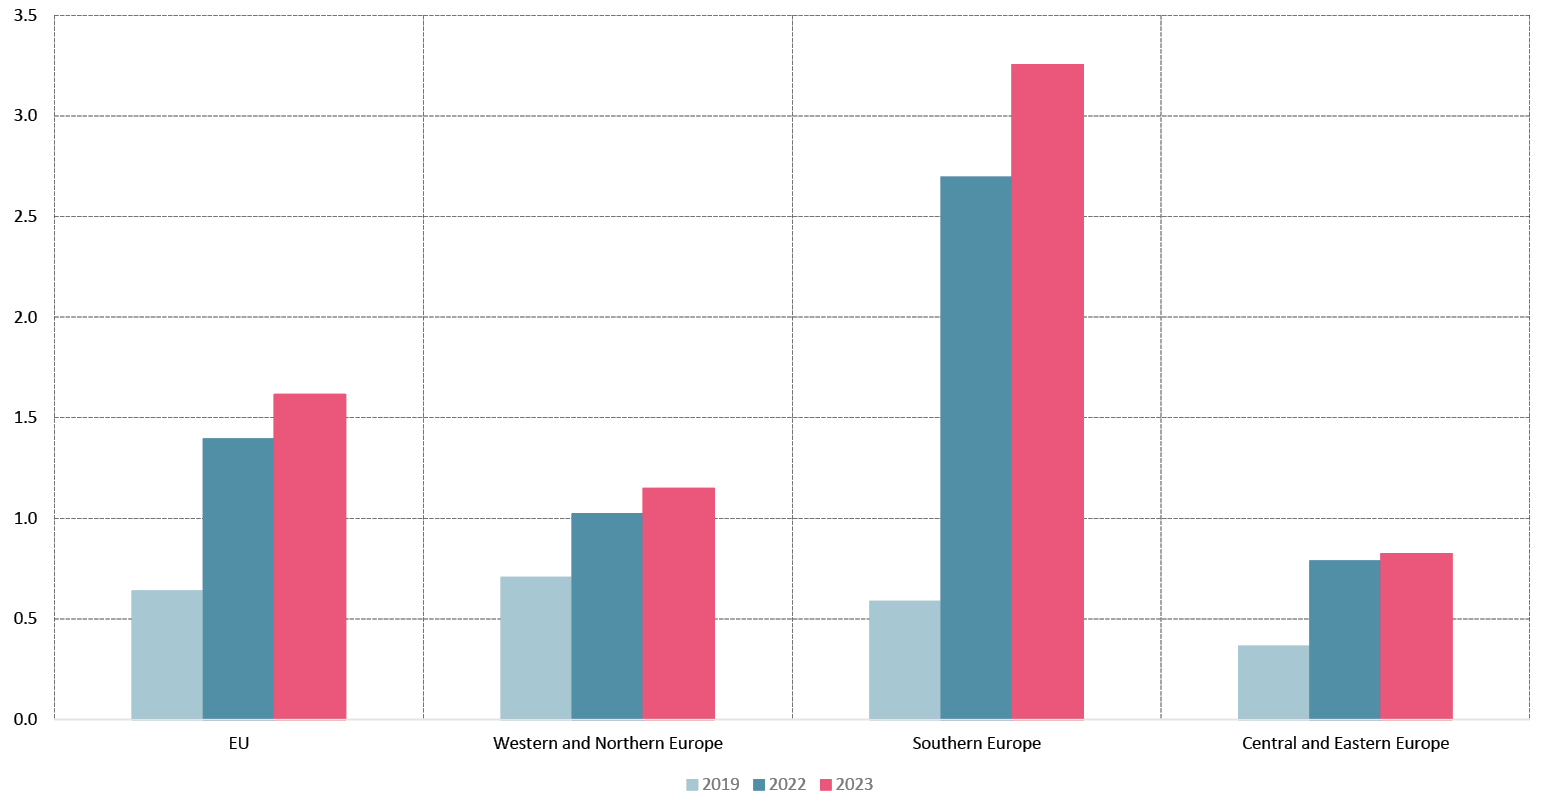
Fig. 1.2 Investment subsidies of the general government (% GDP) Source: Eurostat and EIB staff calculations. Notes: For definition of the country groups on the chart, please see the notes to Fig. 1.1.
The strong push in government investment in 2023 was accompanied by an extraordinary increase in general government investment grants. Following the outbreak of the COVID-19 pandemic and helped by funds from the Recovery and Resilience Facility (RRF) (cf. EIB 2024), European governments have significantly increased the allocation of investment grants to stimulate investment (Fig. 1.2). In 2023 investment grants payable by the general government increased by 1 percentage point of GDP relative to their level before the pandemic, which constitutes a three-fold increase. While the increase happened across the EU, it was most significant in Southern Europe. There, investment grants jumped six-fold, compared to their level before the pandemic to 3.2% of GDP, exceeding the size of government investment (3.1%).
Local governments accounted for about two-thirds of the increase in the investment of the general government in the European Union, driven mostly by developments in Western, Northern and Southern Europe. In Central and Eastern Europe, local governments accounted for some 40% of the increase in general government investment. In these countries, the share of local government investment is also lower, thereby explaining to some extent the lower contribution. Investment subsidies, on the other hand, increased almost entirely due to increasing expenditure on investment subsidies by central governments.
Given the changes in the EU fiscal framework, this year we cannot rely on the information that Member States provide in terms of their plans on public investment and subsidies for the next years. However, the EC spring forecasts include a projection for these variables10 that shows a further increase in 2024–2025. Public investment as a ratio to GDP is projected to increase by another 0.1% per year, reaching 3.7% in 2025, the highest level since 2009–2010 (when the ratio was mechanically inflated by the drop in GDP). As shown in last year’s Outlook (Cerniglia, Saraceno, and Watt 2023), there is a substantial contribution of RRF financed expenditures to this increase. While it is not possible to update this picture with new information, it is useful to show the RRF’s role graphically (see Figure 1.4). By contrast, the aggregate “other capital expenditures” is projected to decline after the peak hit in 2023. Figure 1.3 raises two questions: what will happen after the expiration of the RRF in 2026, and what is the role and nature of investment subsidies?
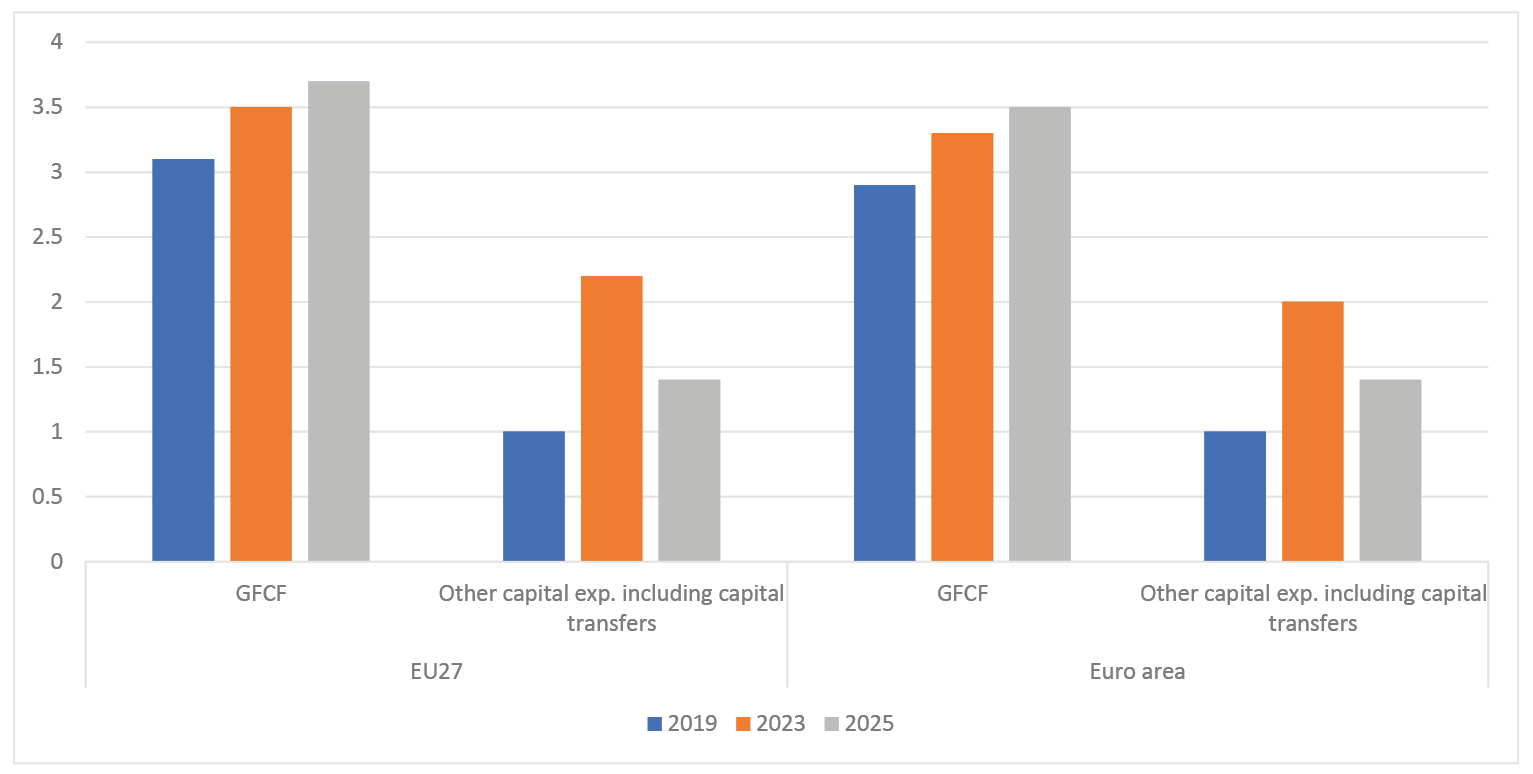
Fig. 1.3 GFCF and other capital expenditures as projected by EC (% GDP). Source: AMECO online database.
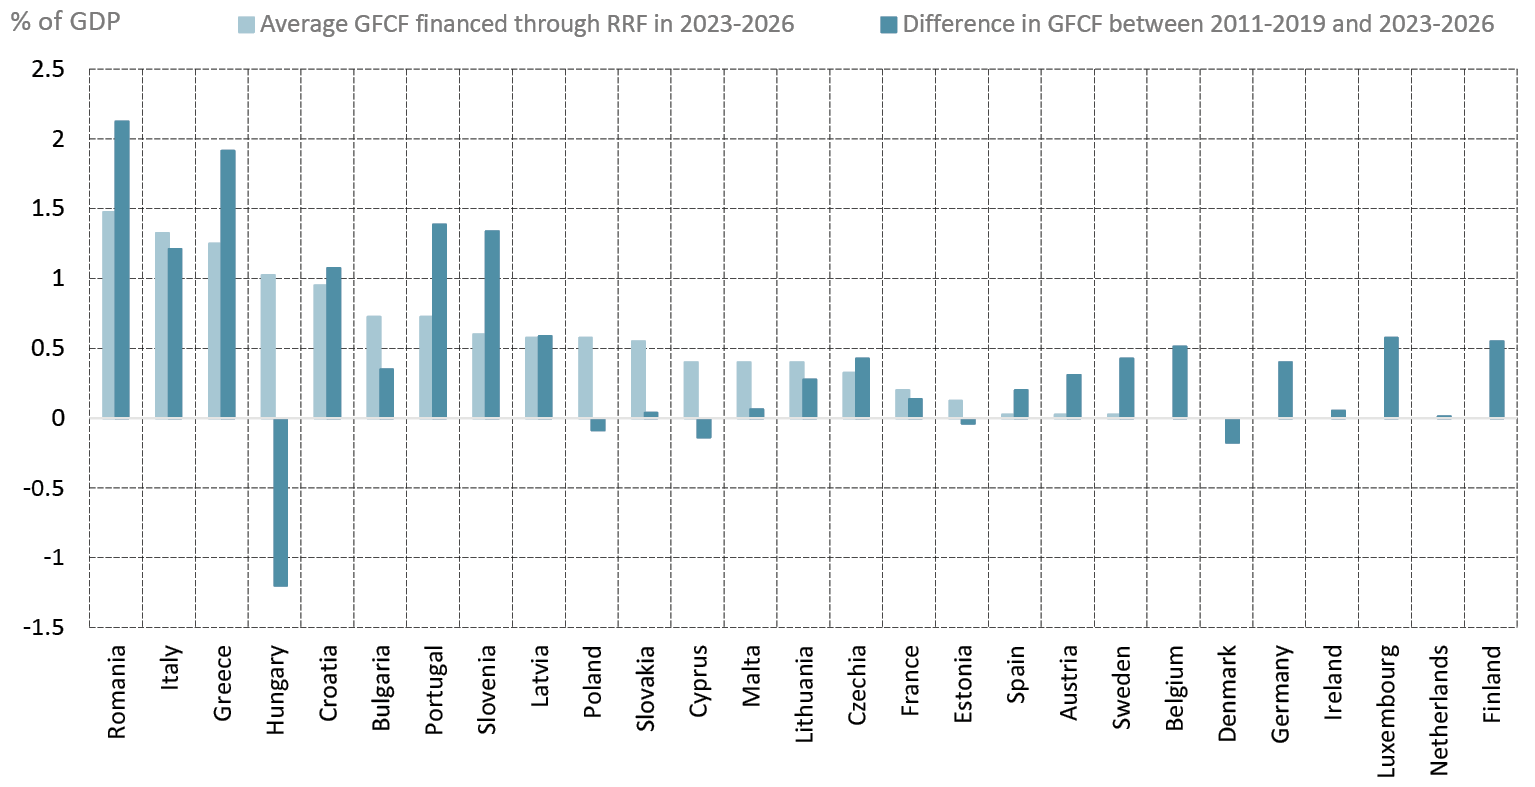
Fig. 1.4 The role of RRF in supporting the acceleration of public investment, 2023–2026. Source: Authors’ calculations based on Member States’ Stability and Convergence Programs.
Looking at the COFOG11 categories of public investment expenditures, there is no evidence of trends or changes in the aggregate EU27 figures. While the “Economic affairs” category accounts for one third of the expenditures (almost stable with respect to 2001) there are some declines in the share of investment devoted to “Environmental protection” and “Housing and community amenities”, and an increase in “General public services”. The portion devoted to R&D (that is distributed across all the other categories in Eurostat data, here is re-aggregated) has grown till 2016 (to represent 10% of the whole public investment) and declined slightly thereafter.
Table 1.1 Public investment by categories (COFOG). Source: Authors’ calculations on Eurostat data.
|
General public services |
Defence |
Public order and safety |
Economic affairs |
Environmental protection |
Housing and community amenities |
Recreation, culture, and religion |
Education |
Social protection |
R&D |
|
|---|---|---|---|---|---|---|---|---|---|---|
|
2001 |
15.0 |
9.2 |
3.6 |
33.9 |
6.2 |
7.0 |
6.0 |
10.5 |
2.0 |
8.3 |
|
2002 |
16.1 |
9.4 |
3.7 |
34.2 |
6.0 |
7.1 |
6.1 |
11.3 |
–0.7 |
8.7 |
|
2003 |
14.9 |
8.8 |
3.5 |
34.6 |
5.7 |
6.7 |
5.9 |
10.6 |
2.3 |
8.5 |
|
2004 |
14.8 |
8.7 |
3.0 |
35.7 |
5.6 |
6.3 |
6.1 |
10.4 |
2.2 |
8.3 |
|
2005 |
14.7 |
7.4 |
3.2 |
36.4 |
5.8 |
6.5 |
6.1 |
10.3 |
2.2 |
8.6 |
|
2006 |
15.3 |
7.4 |
3.3 |
35.6 |
6.2 |
6.7 |
6.2 |
10.2 |
2.2 |
8.1 |
|
2007 |
15.4 |
7.1 |
3.4 |
35.6 |
6.0 |
7.0 |
6.2 |
10.0 |
2.5 |
7.9 |
|
2008 |
15.3 |
7.1 |
3.2 |
36.2 |
5.8 |
6.7 |
6.2 |
10.0 |
2.5 |
7.7 |
|
2009 |
16.0 |
7.2 |
3.2 |
35.1 |
5.7 |
7.1 |
6.0 |
10.2 |
2.8 |
8.1 |
|
2010 |
15.0 |
7.5 |
3.3 |
36.4 |
5.6 |
5.8 |
6.2 |
11.0 |
2.3 |
8.5 |
|
2011 |
15.8 |
7.3 |
3.0 |
36.1 |
5.8 |
5.2 |
5.9 |
10.9 |
2.6 |
9.0 |
|
2012 |
17.4 |
6.9 |
2.9 |
35.6 |
5.8 |
5.0 |
5.7 |
10.5 |
2.5 |
9.0 |
|
2013 |
17.9 |
6.7 |
3.0 |
34.6 |
5.9 |
5.1 |
6.1 |
10.8 |
2.5 |
9.5 |
|
2014 |
18.4 |
5.8 |
2.9 |
34.9 |
5.7 |
5.0 |
6.0 |
11.1 |
2.5 |
9.4 |
|
2015 |
18.0 |
6.8 |
3.1 |
35.2 |
5.6 |
4.9 |
5.6 |
11.0 |
2.5 |
9.4 |
|
2016 |
18.8 |
8.3 |
3.1 |
34.0 |
5.0 |
4.5 |
5.5 |
10.7 |
3.0 |
10.0 |
|
2017 |
18.6 |
8.2 |
3.1 |
35.0 |
4.7 |
4.3 |
5.8 |
10.7 |
2.6 |
9.7 |
|
2018 |
18.2 |
7.6 |
3.2 |
35.2 |
4.8 |
4.6 |
6.3 |
10.9 |
2.4 |
9.4 |
|
2019 |
18.2 |
7.4 |
3.2 |
34.2 |
5.0 |
5.3 |
6.2 |
11.3 |
2.5 |
9.2 |
|
2020 |
18.2 |
8.0 |
3.5 |
34.1 |
4.7 |
4.6 |
5.8 |
11.3 |
2.4 |
9.0 |
|
2021 |
17.8 |
8.4 |
3.5 |
34.1 |
4.6 |
4.7 |
5.9 |
11.3 |
2.3 |
9.1 |
|
2022 |
17.5 |
8.9 |
3.8 |
33.3 |
4.9 |
5.1 |
5.8 |
11.5 |
2.3 |
8.8 |
1.3 EU Public Goods and Public Investments:
A Bird’s-eye View
The provision of public goods at the EU level has higher value than at the national level, when there are increasing returns to scale in their “production” and when they generate positive spillovers. However, these advantages should not be outweighed by the factors that instead point to a “local” advantage—such as the existence of information asymmetries (between the central and the local governments), differences in preferences, democratic control, and jurisdictional competition—which may give advantage to national and local authorities instead. The discussion on EPGs is often centred around the climate transition, the digital transition, health-related issues, strategic autonomy, and R&D. In a paper prepared for the EU Parliament, Charles Wyplosz (2024) argues that among these, the ones that qualify for a centralized financing and provision, according to the fiscal-federalism literature, are climate and R&D. We will focus on these two issues in the remainder of this chapter.
Knowledge and knowledge diffusion (and hence R&D) constitute the best possible example of an EPG, as the motivations to keep its organisation/implementation/expenditures decentralized are minimal, while its contributions in terms of spillover/increasing returns to scale are large. In addition, the climate transition and its needs add a particular context to this: in a number of fields related to emissions control and carbon neutrality, there are still many competing technologies, and the technological breakthroughs which will determine the new technological trajectories are not yet here. Hence, there is an additional premium in R&D investment.
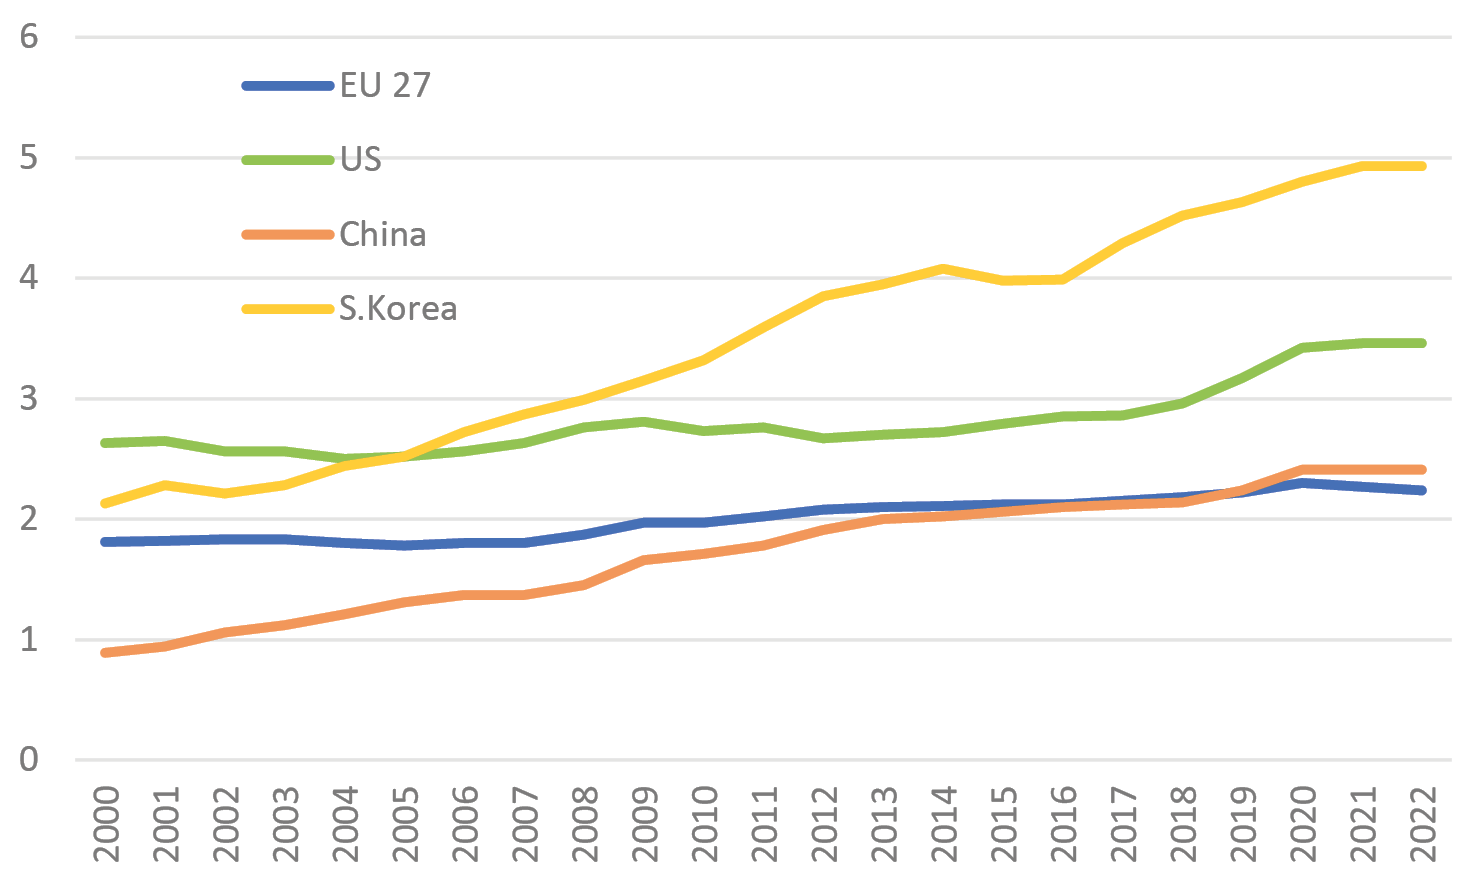
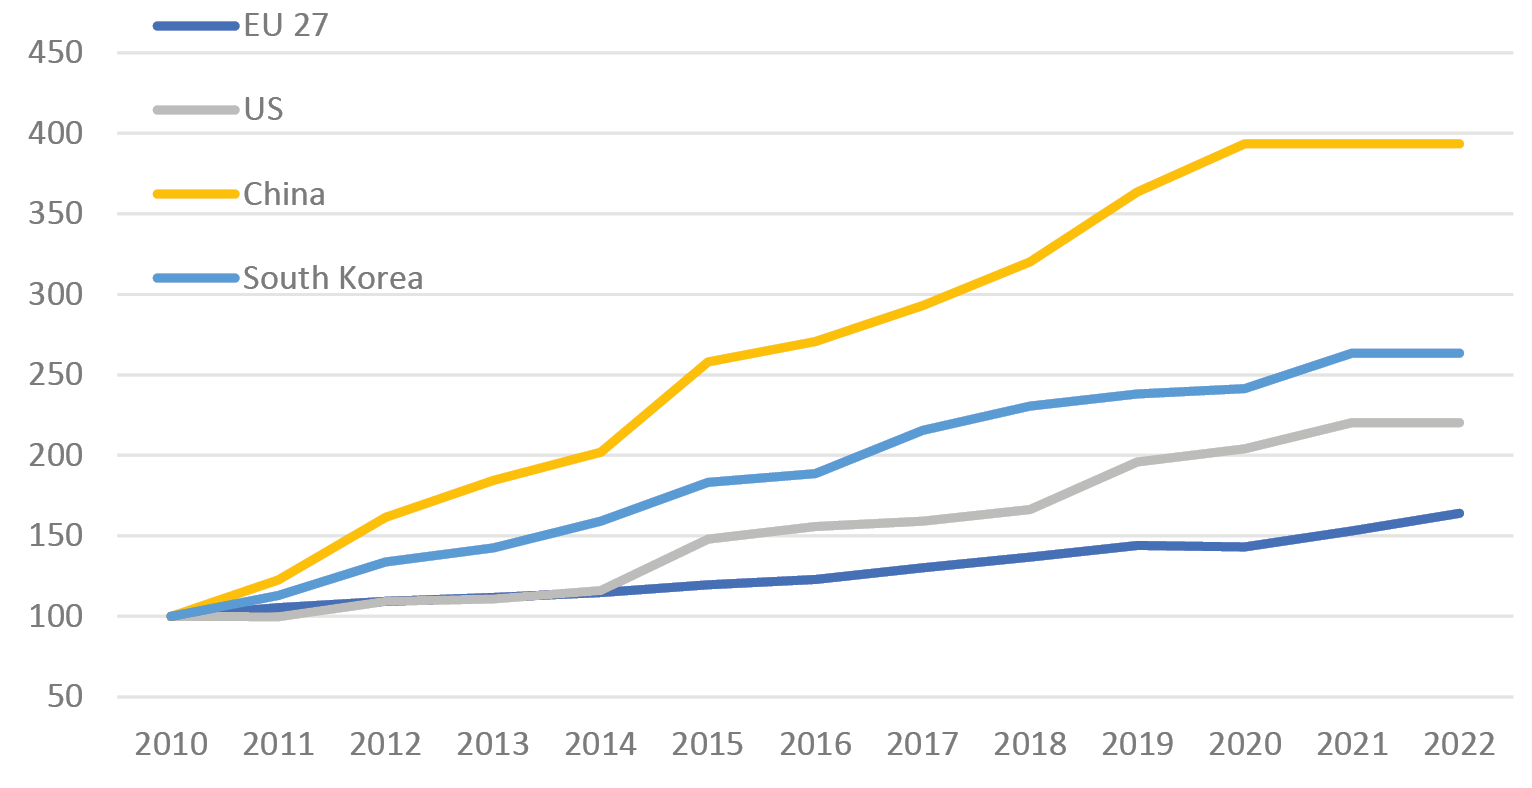
Fig. 1.5 R&D expenditures as (a) a share of GDP (above) and (b) in nominal value fixing 2010=100 (below). Source: Authors’ calculations on Eurostat.
By looking at Eurostat data on R&D investment at all levels, it becomes evident that the EU has fallen behind the other most technologically advanced economies in the first two decades of the twenty-first century. Figure 1.5 shows total spending in R&D (by government, universities, and private sector) as a proportion of GDP. We observe a sharp and steady increase in R&D investment in South Korea (to close to 5% of GDP) and in China (2.41% of GDP), surpassing the EU starting from less than 1% of GDP in 2000. While the increase in the United States was more limited compared to China and South Korea, it was still larger than that of the EU, rising from 2.6% to 3.46%, thereby widening the gap between the US and the EU. In Japan, the increase in the ratio of R&D to GDP was similar to that in the EU (from 2.86% to 3.34%), but starting from a notably higher level. The gap in aggregate R&D spending between the EU and these economies is mainly driven by differences in business sector R&D, rather than government R&D spending. The sum of government spending and higher education institutions spending varies in a narrow range, from 0.57% for China to 0.93% for South Korea. The EU ranks second with public R&D expenditures of 0.73%.
It must be noted that growth rates are significantly more important than shares. Expressing the expenditures as a share of GDP hides part of the dynamics. Because GDP did not grow that much in the EU, particularly when compared with the countries under consideration, with the exception of Japan. Fixing the total amount of R&D spending at 100 in 2010,12 the amount spent in the EU was 164 in 2022. In the US, it was 220, 263 in South Korea, and a notable 393 in China.
For some countries in the European Union, expenditures on R&D represent quite a large amount as a proportion of GDP. Denmark, Germany, Austria, Finland, and Sweden have total expenditures in R&D that are close to or above 3% of GDP, and for all of them the public share (government plus higher education institutions) is close to or above 1%. However, the R&D expenditure in these countries grew more slowly than global peers.
R&D policy for the climate transition should resemble the efforts made in the US with the DARPA agency. The gist of this single agency approach is to finance and monitor a large portfolio of research proposals via a typical bottom-up project selection method.13 In Europe, R&D financing is still largely national and run by a large number of national institutions and universities. Horizon Europe is the program that regroups the majority of the EU funds for R&D and it amounts to €95.5 billion in the Multiannual Financial Framework (MFF) 2021–2027, compared to around €115 billion per annum spent in total in the EU, according to Eurostat. Furthermore, while the European Research Council highlights the merits of a bottom-up approach, Horizon Europe is a top-down exercise. To reap the benefits of R&D investment, the features that justify its classification as an EPG should be emphasized. IPCEI (Important Projects of Common European Interest) and STEP (Strategic Technologies for Europe Platform) are correctly designed to amplify cross-border coordination. It is interesting to put these actions in perspective within the general framework of the EU policy.
A comprehensive analysis by Antonin Bergeaud (2024) on the developments of EU productivity studies the insufficient presence of EU firms among global champions in breakthrough technologies and concludes that misallocation of R&D resources can occur. This was the result of US firms entering earlier “new” sectors that were “contiguous” to those of their operations. This was aided by more developed financial markets, with higher capacity to provide risk capital. In addition, European leading research universities are not well connected to European businesses and created breakthrough knowledge does not transform easily into business opportunities. Furthermore, R&D programmes are not designed to improve the connection between businesses and research universities. Hence, R&D is not generating the same kind of spillovers in comparison to the US. The role of R&D and innovation has been emphasized by Letta in his report on the single market (2024: 7): “the fifth freedom entails embedding research and innovation drivers at the core of the Single Market, thereby fostering an ecosystem where knowledge diffusion propels both economic vitality, societal advancement and cultural enlightenment”. He also proposes the creation of an EU stock exchange for Deep Tech, emphasizing that the scale and scope of public interventions, financial markets, and innovative ecosystems must be pan-European.
1.4 European Public Investment in Action: Implementing RRF for the Green Climate Pillar and R&D
With total disbursement close to €240 billion, RRF constitutes the largest coordinated effort put in place by the European Union to support recovery after COVID-19. It is aimed at steering this recovery towards the EU strategic goals of green and digital transitions by requiring that climate and digital projects should represent at least 37% and 20% of the total envelope. This is further reinforced by a governance of the whole plan that gives a large role to the European Commission.
As of 2024, the shares of climate and digital objectives in the projects presented by Member States surpassed the requested minimum shares and amount to 42% and 26%. The disbursed amounts, however, are smaller. The total amount disbursed for the green pillar is about €36 billion, representing 18% of the disbursed total. The RRF scoreboard also contains the list of the 100 largest disbursements for each country. The list falls slightly short of 2700, because three countries presented shorter lists. The total disbursed amount in this list is €160 billion out of the 240 disbursed, a notable portion.
It is interesting that among the 2400 projects, 410 include the words research, innovation, or R&D in the description, with a total of €48 billion. Among those, the part that can be considered as subsidies or investment incentives for firms (mainly for small firms) is represented by 120 measures with a total amount of less than €1 billion. Note also that the measures included in IPCEI are only seven, for a total amount of €0.7 billion.
1.5 European Policy in Action: State Aid for Climate Action and R&D
The RRF was designed as a response to the negative demand shock the economy experienced during the COVID-19 pandemic. However, it has goals beyond mere recovery, aiming to increase investments in digitalization and the green transition. It can therefore be considered a form of active industrial policy with strong EU impetus. A substantial part of industrial policy in Europe, however, remains state aid, which national authorities allocate to firms following the guidelines set out by the European Commission.
One can define industrial policy as a set of measures or policies influencing industries vertically or horizontally to increase domestic production capacity and maintain competitiveness at the international level. State aid rules, managed by Directorate-General Competition in the European Commission, were conceived as the best way to generate a level playing field in which competitive forces in a wider internal market could stimulate and push EU firms to the technological frontier. It must be said that this approach is defined “by subtraction”.14 In recent years, however, state aid rules were adapted to the changed circumstances.
The State Aid Scoreboard, managed and released by the EC, includes not only support financed by the Member States and allocated to national firms, but also the EU funds that are distributed by local authorities in the Member States.15 Table 1.2 highlights the total amount of funds that are channelled to firms in each Member State, together with the fraction of the total that is financed by the European Union. Our intention here is not to analyze the whole state aid data, but the resources that are dedicated to the two themes that may be considered the clearer example of EPGs, namely R&D and green transition.
Table 1.2 State aid in 2022 (million Euro) and amount co-financed. Source: EC state aid scoreboard.
|
Total State Aid |
Of which EU |
Share |
|
|---|---|---|---|
|
Austria |
6517.8 |
240.2 |
3.7% |
|
Belgium |
5692.0 |
340.1 |
6.0% |
|
Bulgaria |
867.9 |
108.6 |
12.5% |
|
Cyprus |
149.5 |
33.9 |
22.7% |
|
Czechia |
3962.6 |
584.4 |
14.7% |
|
Germany |
73669.6 |
982.8 |
1.3% |
|
Denmark |
5302.4 |
104.9 |
2.0% |
|
Spain |
17124.4 |
1900 |
11.1% |
|
Estonia |
331.3 |
72.3 |
21.8% |
|
Finland |
17124.4 |
354.9 |
2.1% |
|
France |
44793.8 |
4000 |
8.9% |
|
Greece |
2846.6 |
278.7 |
9.8% |
|
Croatia |
570.9 |
196.9 |
34.5% |
|
Hungary |
3526.2 |
373.4 |
10.6% |
|
Ireland |
1583.0 |
201.8 |
12.7% |
|
Italy |
27607.0 |
3500 |
12.7% |
|
Lithuania |
764.3 |
279.1 |
36.5% |
|
Luxembourg |
515.8 |
42.2 |
8.2% |
|
Latvia |
391.7 |
86.3 |
22.0% |
|
Malta |
259.1 |
6.4 |
2.5% |
|
Netherlands |
9922.7 |
195 |
2.0% |
|
Poland |
6069.9 |
598.3 |
9.9% |
|
Portugal |
2303.5 |
681 |
29.6% |
|
Romania |
4189.0 |
681.4 |
16.3% |
|
Slovakia |
970.1 |
460.6 |
47.5% |
|
Slovenia |
483.0 |
91.4 |
18.9% |
|
Sweden |
5028.7 |
201.5 |
4.0% |
The need to involve and stimulate private investment is always a key objective of economic policy. The European Commission defined a “European industrial strategy”16 in 2020, before reviewing and updating it afterwards to adjust it to new economic realities.17 The 2023 State Aid Scoreboard report describes the interventions that were implemented regarding R&D and Climate. In 2022, the “R&D&I” (Research, Development, and Innovation) framework18 and the General Block Exemption Regulation were modified to facilitate the adoption of supporting actions by Member States. In 2022, the sum of all the state aid devoted to this theme was €12.7 billion, that represented a significant drop with respect to 2021 (€19.3 billion) even though it represents the second highest value in history (in 2019 the total was €9.2 billion). The 2023 Scoreboard outlines the larger supporting measures that gained the approval (for example, €1.5 billion in France to a company aiming at developing solid state batteries). Then, the report also describes the portion of these aids that were provided in the context of the IPCEIs. There are seven approved IPCEIs (two in microelectronics, two for EV batteries, two focused on hydrogen for energy-intensive sectors, and one for cloud computing) that in principle should receive support for a total of €27.9 billion from the involved Member States and possibly unlock much more in private investment. However, in 2022, they totalled just above €1 billion (i.e., around 8.2% of the total resources earmarked for R&D).
On climate transition, in 2022, the European Commission released new Guidelines on State Aid for Climate, Environmental Protection, and Energy (CEEAG) to facilitate the implementation of supporting measures by Member States. To illustrate, the report highlights the approved scheme for decarbonizing the production of energy intensive sectors in Slovakia (€1 billion) and in Germany (€4 billion), and the Danish project to roll-out Carbon Capture and Storage (CCS) technologies.
To take a closer look at the state expenditure on these areas, we analyze the state aid awarded to businesses for R&D&I and environmental protection. Our analysis is based on data from the Transparency Award Module (TAM), covering state aid awarded to firms in thirteen European countries.19 Due to reporting thresholds, our data include mostly large aid packages. We focus on aid awarded between 2017 and 2019, using firm-level balance sheet data from Orbis spanning 2012 to 2021.
Overall, environmental protection, energy efficiency, R&D&I, and regional development are the main objectives under which governments award large sums of aid to businesses. Firms that receive R&D&I aid tend to invest more than prior to the aid award and are more likely to be large firms. These factors do not matter as much for the probability of receiving environmental aid. R&D&I aid shows a clearer sectoral component, with scientific research, and manufacturing of transport, chemicals, basic metals, computers, and pharmaceuticals being top recipient sectors. Manufacturing industries are also more likely to receive state aid for environmental protection and energy efficiency, however the degree of discrimination among sectors seems to be much less pronounced for this type of aid.
We examine the impact of national government support for R&D&I and green transition, by using a generalized difference-in-differences approach in which we control for firm fixed effects and year effects. We observe positive effects on firm net investment rates for both types of aid. Figures 1.6 and 1.7 below show the dynamic effects of the aid received on firm investment relative to the control group for each year relative to the year of aid reception.
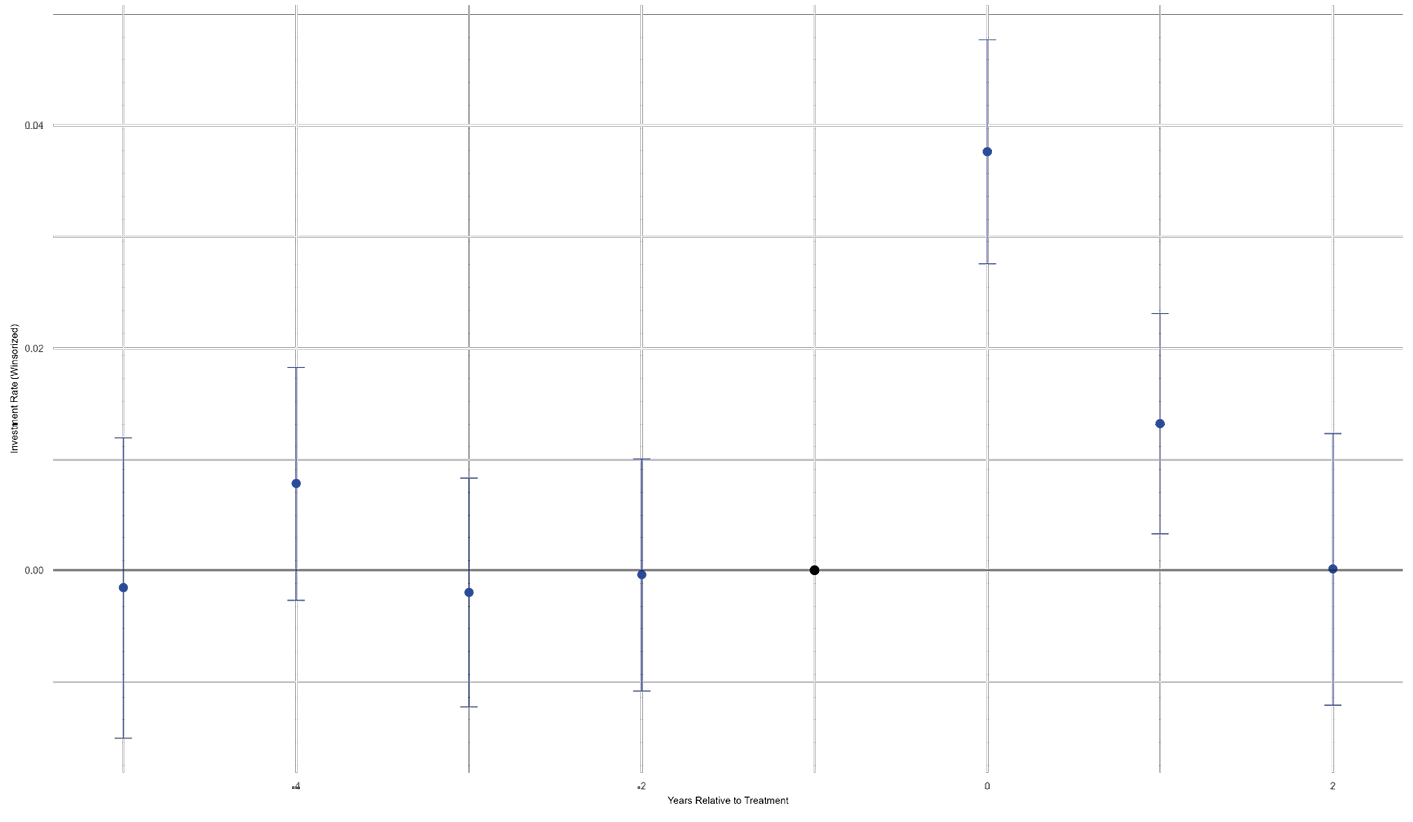
Fig. 1.6 Dynamic effects of state aid award on firm investment, for firms receiving aid related to R&D&I. Source: EIB staff calculations on EC—State Aid TAM data.
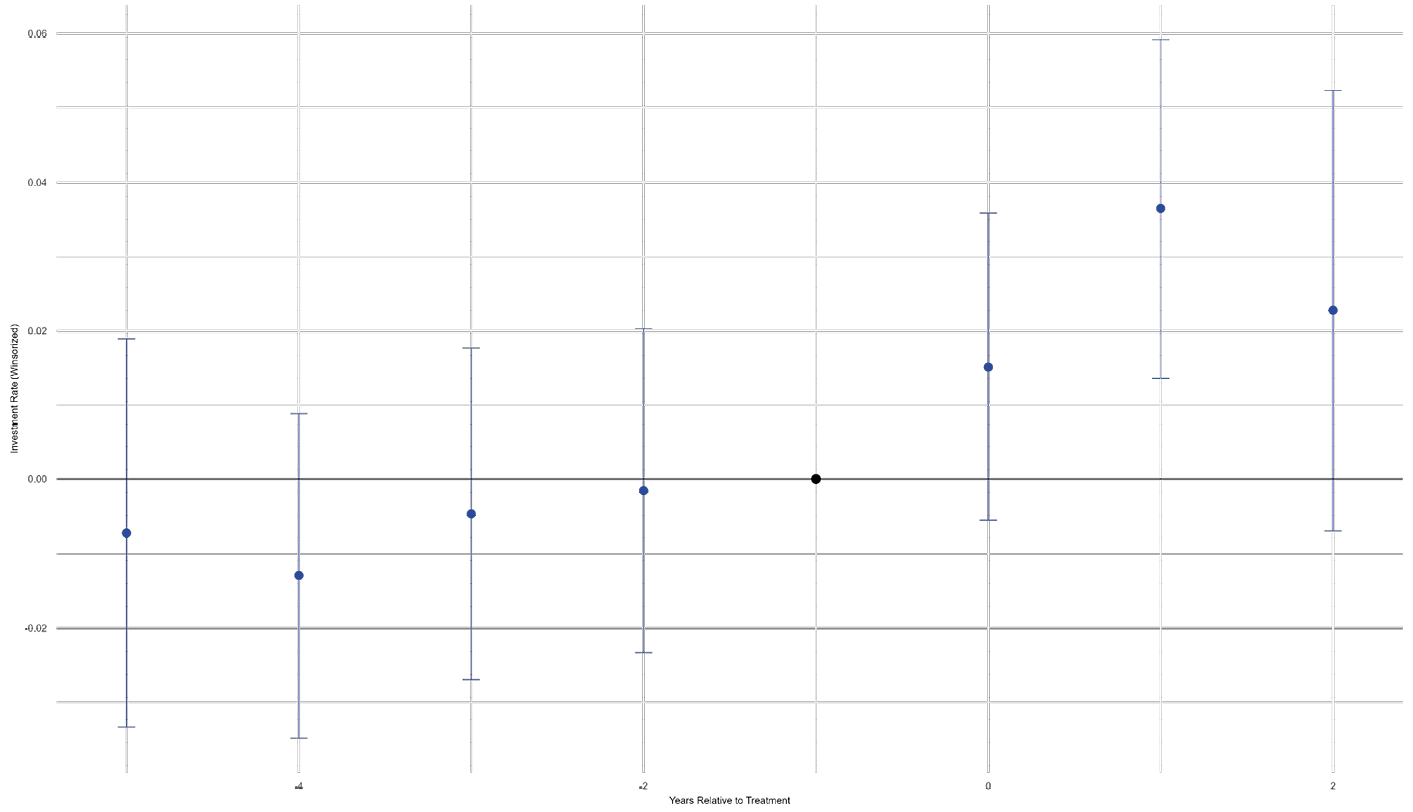
Fig. 1.7 Dynamic effects of state aid award on firm investment, for firms receiving aid related to environmental protection and energy efficiency. Source: EIB staff calculations on EC—State Aid TAM data.
While there are no significant differences in investment trends prior to aid reception, firms receiving aid significantly invest more in the following years. Our results suggest that aid given for environmental protection and green transition leads to an increase in investment rates. For environmental aid, we see a gradually increasing but more sustained effect. There may be two reasons for this. First, an important share of environmental aid is given for investment in greener and more energy-efficient means of production. Second, even if this type of aid does not have firm investment as a primary goal, it may generate other positive effects on firm performance that eventually lead the firm to be in a better position to carry out investments. R&D&I aid shows a stronger immediate impact that is visible for the first two years only, with firms potentially investing for specific projects.
These reduced-form results point to positive effects of state aid on firm investment, with different objectives exhibiting different effects. At the same time, they do not allow us to assess the optimality of the allocation of state aid across projects and firms, nor on the type of financing instruments used. Government aid should ideally target projects and enterprises that are most promising in terms of social value creation, but that are too risky to be financed in the absence of the state participation. It is important to choose the most appropriate tools in order to minimize the tax burden of the aid. A cost-effective, key role of governments is enabling coordination among market participants whose investment and R&D&I effort decisions depend on those of other firms (Aiginger and Rodrik 2020).
1.6 Conclusion and Prospects
Public investment has been growing as a share of GDP in the last years in Europe and it is likely to continue to grow at least until the expiration of the RRF in 2026. The COVID-19 pandemic and the energy crisis gave a boost to public investment and created a renewed appreciation for industrial policies both in political debate and in academic circles. Still, while the momentum is there for reshaping the European industrial policy, it is not clear how the Union will move after the expiration of the RRF. Note that, as clearly stated in Draghi’s report, issuing more common debt to finance joint investment projects would also help the integration of the EU capital market. With Member States facing challenges to lower public debt to respect the fiscal rules of the Union, as well as the political climate, it may not be an easy task to increase public funds to speed up the green and digital transitions, and heavily invest in R&D. However, there are potential gains to be unlocked simply through a better use of available funds. A bird’s-eye tour of the clearer examples of European public goods such as R&D and climate transition suggests that there are significant opportunities that can be realized through enhanced coordination and greater coherence between EU and national public investment decisions. Exploiting the full potential of the European research and production networks, and coordinating efforts, is essential to reap maximum benefits while minimizing costs. IPCEIs are commendable examples of how governments can come together to coordinate actions between firms and institutes that invest at different stages of a technology, as well as between firms headquartered in different countries. However, they constitute only a small share of the industrial policies and public investment carried out in the EU, most of which is channelled via national authorities. There needs to be continuous investment in and reaffirmation of such projects. Given that externalities and spillovers are the core justifications for public investment and industrial policies, it is necessary and logical to take them into account in their entirety on a European scale.
References
Buti M., A. Coloccia, and M. Messori (2023) “European Public Goods”, June 9, CEPR, https://cepr.org/voxeu/columns/european-public-goods
Bergeaud, A. (2024) “The Past Present and Future of EU Productivity”, Prepared for the ECB Central Banking Forum, July 2024, https://www.ecb.europa.eu/pub/pdf/
sintra/ecb.forumcentbankpub2024_Bergeaud_paper.en.pdf
Cerniglia, F., F. Saraceno, and A. Watt (eds) (2023) Financing Investment in Times of High Public Debt: 2023 European Public Investment Outlook. Cambridge: Open Book Publishers, https://doi.org/10.11647/OBP.0386
Demertzis, M., D. Pinkus, and N. Ruer (2024) “Accelerating Strategic Investment in the European Union beyond 2026”, Bruegel Report, January 24, https://www.bruegel.org/system/files/2024-01/Report 01 2024.pdf
Draghi, M. (2023) “The Next Flight of the Bumblebee: The Path to Common Fiscal Policy in the Eurozone”, 15th Annual Feldstein Lecture at the NBER Summer Institute 2023 in Cambridge, October 10, NBER, https://www.nber.org/reporter/2023number3/next-flight-bumblebee-path-common-fiscal-policy-eurozone
Draghi, M. (2024) The Future of European Competitiveness. Brussels: European Commission, https://commission.europa.eu/document/download/97e481fd-2dc3-412d-be4c-f152a8232961_en
European Commission (2020) “A New Industrial Strategy for Europe”, COM(2020) 102, March 10, https://eur-lex.europa.eu/legal-content/EN/TXT/PDF/?uri=CELEX:52020DC0102
European Commission (2021) “Updating the 2020 New Industrial Strategy: Building a stronger Single Market for Europe’s recovery”, SWD(2021) 352, May 5, https://eur-lex.europa.eu/legal-content/EN/TXT/?uri=CELEX%3A52021SC0352
European Commission (2022) “Framework for State Aid for Research and Development and Innovation”, 2022/C 414/01, October 28, https://eur-lex.europa.eu/legal-content/EN/TXT/HTML/?uri=OJ%3AC%3A2022%3A414%3AFULL#:~:text=This Framework provides guidance on,)(c) of the Treaty.
Fuest, C., and J. Pisani-Ferry (2019) “A Primer on Developing European Public Goods (A Report to Ministers Bruno Le Maire and Olaf Scholz)”, November 3, https://www.bruegel.org/sites/default/files/wp-content/uploads/2019/11/European-public-goods-primer.pdf
Letta, E. (2024) Much More Than a Market, https://www.consilium.europa.eu/media/ny3j24sm/much-more-than-a-market-report-by-enrico-letta.pdf
Nicolaides, P. (2018) “State Aid and EU Funding: Are They Compatible?”, In-Depth Analysis Requested by the CONT Committee, Policy Department for Budgetary Affairs, April, https://www.europarl.europa.eu/cmsdata/142819/Briefing_State Aid and EU funding_Final.pdf
Wyplosz, C. (2024) “Which European Public Goods?”, IPOL | Economic Governance and EMU Scrutiny Unit, March, https://www.europarl.europa.eu/RegData/etudes/
IDAN/2024/755722/IPOL_IDA(2024)755722_EN.pdf
Von der Leyen, U. (2024) “Statement at the European Parliament Plenary by President Ursula von der Leyen, Candidate for a Second Mandate 2024–2029”, European Commission, https://ec.europa.eu/commission/presscorner/detail/ov/STATEMENT_24_3871
1 European Investment Bank (EIB).
2 European University Institute (EUI).
3 EIB.
4 EIB.
5 EIB.
6 EIB.
7 EIB.
8 The need for European strategic investments in this area was also emphasized in the recent white paper of the Belgian Presidency of the Council of the European Union (Demertzis, Pinkus, and Ruer 2024).
9 “To maximise productivity, some joint funding for investment in key European public goods, such as breakthrough innovation, will be necessary. At the same time, there are other public goods identified in this report—such as defence spending or cross-border grids—that will be undersupplied without common action” (Draghi 2024: 14).
10 Actually, the projected variables include public investment and other capital expenditures, such as capital transfers, which represent a slightly broader category than the investment subsidies shown in Figure 1.2.
11 Classification of the Functions of Government (COFOG).
12 Some noise due to fluctuations in nominal exchange rates is included here; however, this should not significantly alter the overall picture.
13 Here credit is due to Wyplosz (2024) for these descriptions.
14 On the website of the European Commission it is stated that “the Treaty generally prohibits State aid unless it is justified by reasons of general economic development” (https://competition-policy.ec.europa.eu/state-aid_en).
15 P. Nicolaides, in the document “State Aid and EU Funding” requested by the Policy Department on Budgetary Affairs of the EU Parliament, clarifies that “…EU funds channeled through the managing authorities of Member States become state resources and can constitute state aid if all the other criteria of Article 107(1) are satisfied” (2018: 5).
16 European Commission (2020).
17 European Commission (2021).
18 European Commission (2022).
19 Belgium, Denmark, Estonia, Finland, France, Croatia, Hungary, Ireland, Italy, the Netherlands, Portugal, and Sweden.