
2. Public Investment and Industrial Policy in France
Vincent Charlet,1 Mathieu Plane,2 and Francesco Saraceno3
©2024 V. Charlet, M. Plane & F. Saraceno, CC BY-NC 4.0 https://doi.org/10.11647/OBP.0434.03
This chapter first traces the long-term evolution of public investment in France, noting how this is mostly channelled through local governments and how, while comparatively high with respect to other advanced economies, the public capital stock and the general government net wealth have been steadily decreasing since the Global Financial Crisis of 2008. After the COVID-19 shock, despite the 2021 “Plan de Relance” and the 2022 “Build the France of 2030” program, public investment has remained surprisingly flat. The chapter then discusses the recent evolutions in French industrial policy objectives. The Lisbon Strategy was centred on boosting productivity through innovation and climbing the value-added ladder. The response to the crisis of 2008 marks a first change, with a strong emphasis on price competitiveness and cost reduction (including through corporate tax reduction). Since the early days of the pandemics, then, the notion of “industrial sovereignty” has very quickly eclipsed that of competitiveness, with policies aimed at reindustrialization especially in strategic sectors. The chapter concludes that these frequent changes indicate an excessive short-term focus among French policy makers, incompatible with managing long-term structural transformation.
2.1 The Historical Evolution of Public Investment
From the end of the 1940s until today, public investment in France has gone through different phases. After a long period of sustained growth during the 1960s (5.6% of GDP on average; see Figure 2.1), it remained at a relatively high level during the 1970s and 1980s (5% of GDP on average) until the mid-1990s. The first break took place during the 1990s, a period during which priority was given to reducing the public deficit to meet the Maastricht criteria and join the euro. During this time, public investment fell to an average of 4.4% of GDP from the mid-1990s to the mid-2010s, when a second break occurred. Following the sovereign debt crisis, the fiscal stance turned restrictive, and a substantial part of the fiscal adjustment was achieved by reducing capital expenditure. Indeed, the reduction of public investment during that period has contributed to almost a third of fiscal consolidation, even though investment represented only 6% of public expenditure. The share of public investment to GDP from 2015 to 2018 fell to under 4% on average and, during this period, reached its lowest level since the beginning of the 1950s. A recovery in public investment began in the two years before the COVID-19 crisis, with an increase of nearly 12% between the end of 2017 and the end of 2019. This shift was linked to the cycle of municipal elections and the government’s desire to preserve investment within the framework of the targeted budget contract with local governments. It is also important to note that public investment remains mainly the responsibility of local authorities (around 53% of the total in 2023, see Figure 2.1) even though local public expenditure barely represents 20% of total public expenditure.4
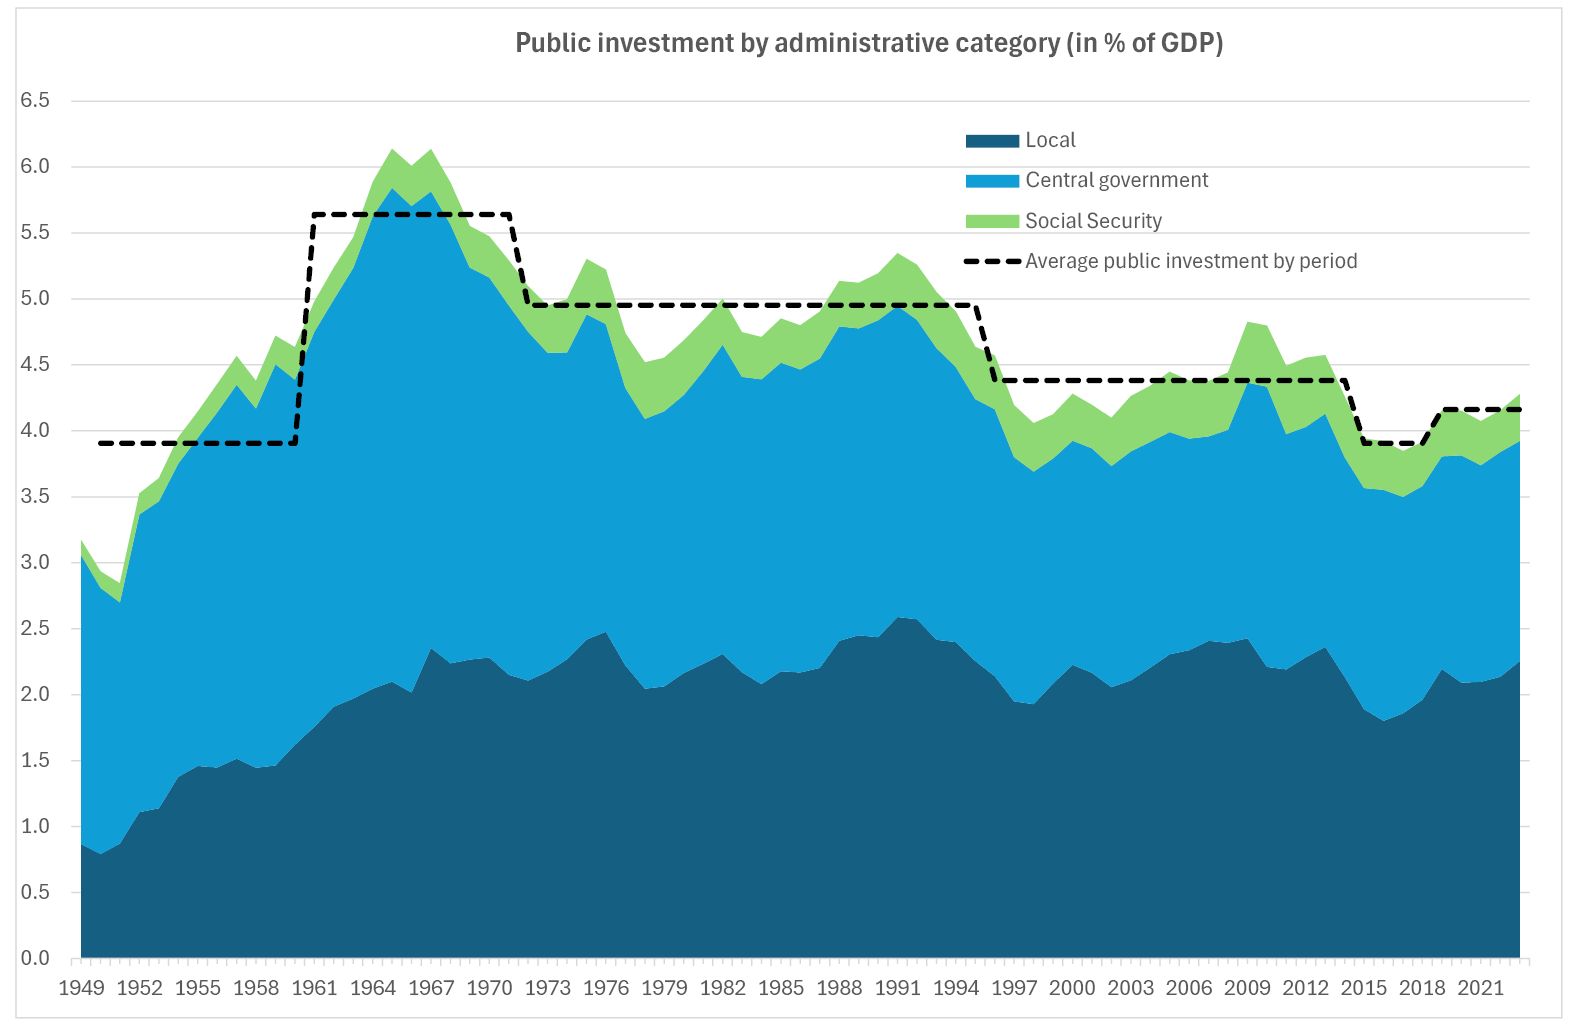
Fig. 2.1 Public investment by administrative category in % of GDP. Source: Insee.
2.2 The Public Investment Dynamics since the COVID-19 Crisis
Due to the nature of the political cycle, a partial reversal in public investment was to be expected after the municipal elections of 2017. Nevertheless, the drop observed in 2020 is out of proportion with that observed in previous cycles and is a result of the pandemic. Indeed, the COVID-19 crisis (most notably, the first lockdown, in the Spring of 2020) led to a drop of 12% in public investment in the first half of 2020. By comparison, the two strongest bi-annual decreases observed in the previous four decades were between 4% and 5%.
From the second semester of 2020, however, public investment nearly returned to the pre-COVID-19 level (-3% at the end of the year 2020 with respect to the end of 2019), despite the second lockdown in November and December 2020 (Fig. 2.2). In addition, the government voted in September 2020 for a hundred-billion-euro recovery plan (“Le Plan de Relance”, see Plane and Saraceno 2021), partially financed (€40 billion) with funding from the Next Generation EU program. The “Plan de Relance” includes a section on public infrastructure, with particular emphasis on the thermal renovation of public buildings, with increased planned investment from the beginning of 2021. The plan allocated resources as follows: €30 billion for Ecological Transition (energy-efficient building renovations, development of renewable energies, green mobility, sustainable agriculture), €34 billion for Competitiveness and Sovereignty (reduction of production taxes, support for research and innovation, industrial relocation), and €36 billion for Social and Territorial Cohesion (employment and training, support for local authorities, and support for struggling sectors).
Moreover, a new investment plan, “Build the France of 2030”, was announced in October 2021.5 With a budget of €54 billion, this plan is intended to meet long-term challenges, particularly those related to the green transition, through massive investment to help the technological champions of tomorrow to emerge and to support the transitions of French sectors of excellence: energy, automotive, aeronautics, and space. “Build the France of 2030” identifies public investment as central to the revival and strengthening of the economy as well as to the structural transformation required by the green transition. The main goals of “Build the France of 2030” are organized around several strategic pillars: €8 billion for energy and ecological transition, €4 billion for future transport, €7 billion for health and biotechnologies, €6 billion for digital and intelligent technologies, €2 billion for sustainable agro-food sector, and €2 billion for training and skills development. Despite these major announcements to revive the economy, particularly through investment policy, public investment has remained surprisingly flat, with even a drop of more than -2% between the end of 2020 and mid-2022. In fact, it has only reached its pre-COVID-19 level more than three years after the start of the crisis. By contrast, it took only five quarters for GDP and only one year for private investment (Fig. 2.2). Private investment was very dynamic over this period, which suggests that the Recovery Plan was more focused on supporting business investment than on public infrastructure. Since the second half of 2022, public investment has been more dynamic than private investment and GDP. In the second quarter of 2024 it is 5% above its pre-COVID-19 level while GDP is only 4% above.
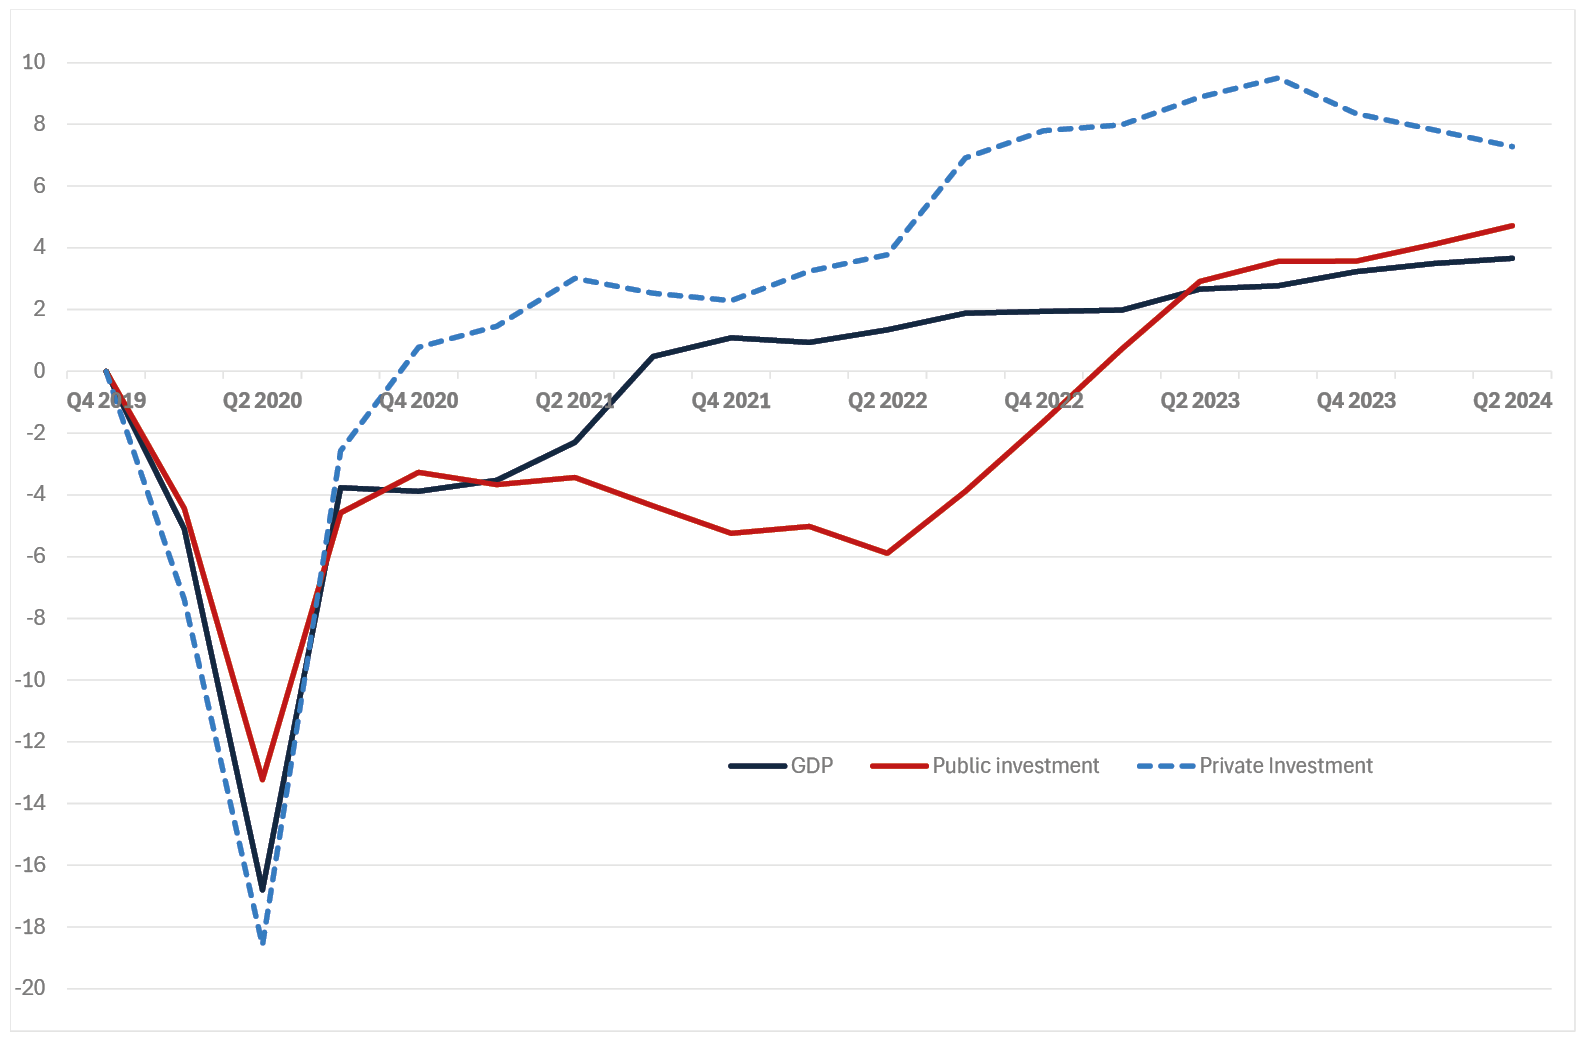
Fig. 2.2 Public/Private investment and GDP (0 = 2019q4, in %, volume). Source: Insee.
2.3 Net Investment Increases but the Pace of Public Capital Accumulation is Still Low
The gross investment dynamics need to be complemented with an analysis of net flows of fixed assets (net investment) to better assess the dynamics of the capital stock (excluding the effects of revaluation of the existing stock). Thus, if gross investment is larger (smaller) than the depreciation of capital (consumption of fixed capital, CFC, in national-accounts nomenclature), then net investment increases (decreases), and the stock of capital increases (decreases).
From the late 1970s to the first half of the 1990s, France’s general government net investment was strong, averaging more than 1% of GDP per year (Fig. 2.3). It even experienced a strong boom over the period 1987–1992, averaging above 1.4% of GDP per year. From 1993 to 1998, general government net investment declined sharply, reaching 0.5% of GDP in 1998, which amounted to a decrease of more than 1 point of GDP over the space of seven years. This decline, as was the case in other European countries, was mostly due to the effort to meet the Maastricht criteria in the run-up to the adoption of the euro: the cyclically adjusted deficit for France decreased from 4.6% of GDP in 1993 to 1.8% in 1998, and investment was the main adjustment variable. Net investment recovered in the next phase, then fluctuated between 0.7% and 1.1% of GDP over the 2000–2010 period, without ever returning to the level observed during the 1980s and the first half of the 1990s. Since 2011 and the Global Financial Crisis, net investment has been at its lowest level since the late 1970s, when wealth accounts were introduced.
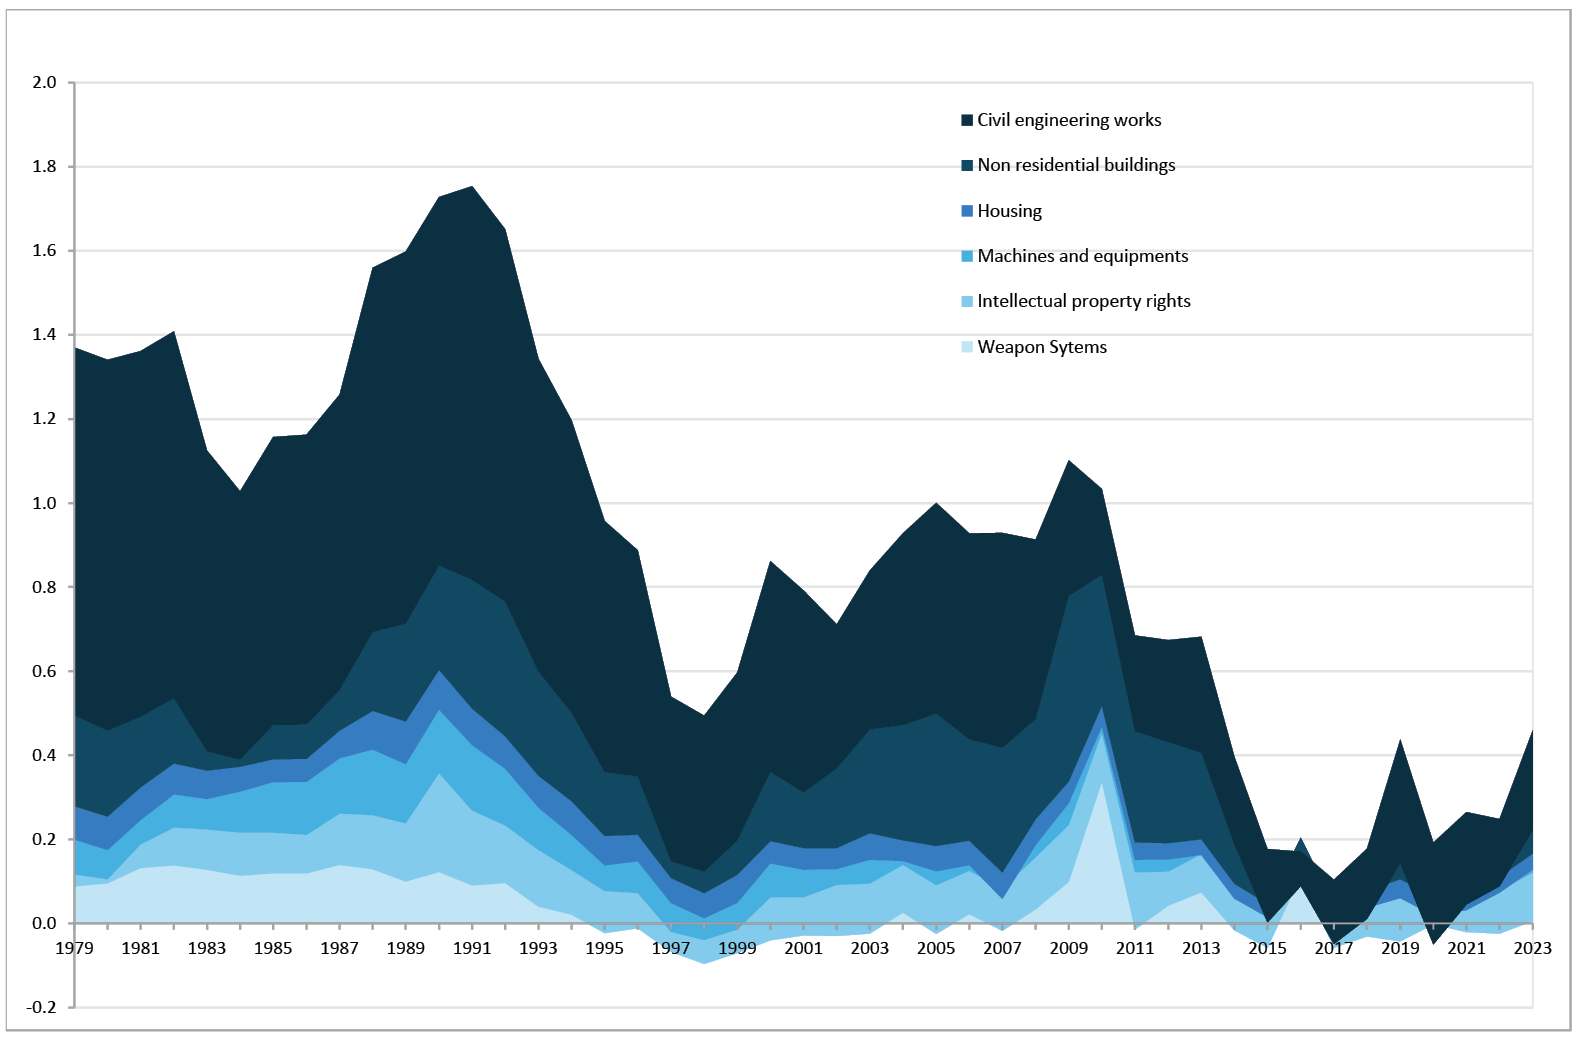
Fig. 2.3 Net General Government Investment by Component as a % of GDP. Source: Insee.
To sum up, during the period 2015–2018, France spent about 0.7 percentage points (pp) of GDP (about €20 billion per year in 2023 euros) less on net investment than it did during the period 2000–2010, and 1.6 pp (approximately €45 billion per year in constant 2023 euros) less than during the period 1990–1992. The necessary amount of additional public investment per year to achieve carbon neutrality in 2050 would have to be the level of the early 1990s.6 Public investment has been gradually recovering since 2019 and has been accentuated by the COVID-19 crisis and the implementation of the recovery plan and “Build the France of 2030”. Over the last five years, net investment by public administrations increased on average by 0.4 point of GDP per year, i.e. a rate twice as high as that of the years 2015–2018. Although improving, this rate of investment remains well below what was achieved before 2013 and the turning point in fiscal austerity. The fiscal adjustment program for €60 billion recently announced by the Prime Minister, which does not spare investment incentives and transfers to local authorities, risks undermining the slight recovery in public investment observed in recent years.
The picture that emerges from the analysis of stocks and flows is rather consistent with the previous analysis and gives two main messages. The first is that, in France, public investment and the stock of capital have been largely affected by the budgetary cycle. In the two significant phases of fiscal consolidation―the run-up to adopting the euro in the 1990s and the aftermath of the sovereign debt crisis―investment was strongly reduced (see also Bubbico et al. 2020). Especially in the latter case, net investment turned close to zero for all levels of government, thus stopping the increase of the stock of capital. The second message that emerges, specifically from the analysis of stocks, is that, despite these trends in investment, the capital stock in France remains significant (and larger than in other countries). As a result, one might ask, then, whether the effort of consolidation and the disproportionate burden that it has placed on public investment has led to more sustainable public finances.
It is interesting to look at the evolution of non-financial assets’ net flows in relation to primary net financial flow (financial assets–financial liabilities–interest expenses), which we consider here as a proxy of the net worth. This reveals the existence of two sub-periods in the past three decades: the first sub-period, which runs from 1996 to 2008, can be seen as one in which the additional public net financial debt (excluding interest expense) was more than offset by the net accumulation of non-financial assets, leading to a positive net worth. This indicates that the general government stock of wealth increased in value over this period, even abstracting from price effects. The second sub-period, which runs from 2009 to 2022, displays a new pattern in which the net financial debt increase is no longer offset by an increase in public non-financial capital, generating a sharp deterioration in government net worth. In summary, during the period of strong public debt accumulation, there was a corresponding disinvestment in public assets, which ultimately led to a sharp reduction of the net asset value of public administration.
The economic and financial crisis led to a sharp increase in public debt. Fiscal consolidation began to be implemented in 2011. On one hand, it partly reduced new financial commitments; on the other, it has been more than offset by a reduction in the net accumulation of non-financial assets. This is yet-further proof that the burden of fiscal consolidation was disproportionately laid on the shoulders of public investment. The sharp reduction in net worth, therefore, casts doubt on the effectiveness of fiscal consolidation in strengthening the public-finances outlook for France.
2.4 General Government Net Wealth: Still Positive but a Strong Decrease Since 2008
What is referred to as “public capital” covers a wide variety of assets, such as land, residential buildings, ports, dams, and roads. It also includes intellectual property rights. It is necessary to break down the “wealth of the State” into these different components to understand its dynamics, considering that price (most notably land prices) and volume effects may play a significant role in explaining the evolution of the different components and of aggregate figures.
We use public data from the French National Statistical office (Insee) national accounts; our analysis covers the period 1978–2022. Insee reports the consolidated level (general government) and its components, distinguishing between the central government, local governments, social-security administrations, and other government agencies.
In 2022, the consolidated public sector had a positive net wealth, despite the negative impact of the COVID-19 crisis (Table 2.1). Total assets held represented 167% of GDP, of which 103% was for non-financial assets. Financial liabilities totalled 134% of GDP.7 The net worth in 2022 was, therefore, 33% of GDP, which corresponds to €12,700 per capita.
Table 2.1 Decomposition of general government net wealth. Source: Insee and authors’ calculations.
|
As a % of GDP |
In euros per head |
|||
|
1978 |
2007 |
2022 |
2022 |
|
|
Non-financial assets |
60.8 |
90.4 |
102.9 |
39 920 |
|
Financial assets |
27.6 |
52.6 |
64.0 |
24 820 |
|
Financial liabilities |
33.7 |
84.9 |
134.2 |
52 040 |
|
Net worth |
54.7 |
58.1 |
32.7 |
12 700 |
After reaching a record level in 2007 (58% of GDP), the net worth has lost 25 points of GDP in the space of fifteen years. The reasons for this sharp drop are to be found on the net financial liabilities (debt) side, which increased substantially while non-financial assets only increased slightly (see Figure 2.4).
This net worth is unevenly distributed among different levels of government. Indeed, it is very positive for local administrations (72% of GDP in 2022), very negative for the central government (-57% of GDP in 2022), and slightly positive for social-security administrations and other government agencies (8% and 10%, respectively). Broadly speaking, the central government―which runs recurrent deficits―has accumulated debt; low-debt local governments hold non-financial assets, be they land, buildings, or civil-engineering works. With the economic and financial crisis from 2008 onwards, the net worth of the central government deteriorated considerably as public deficits and debt increased. On the other hand, the net worth of local governments remained high and relatively stable over the same period due to a stable value of non-financial assets and of their debt.
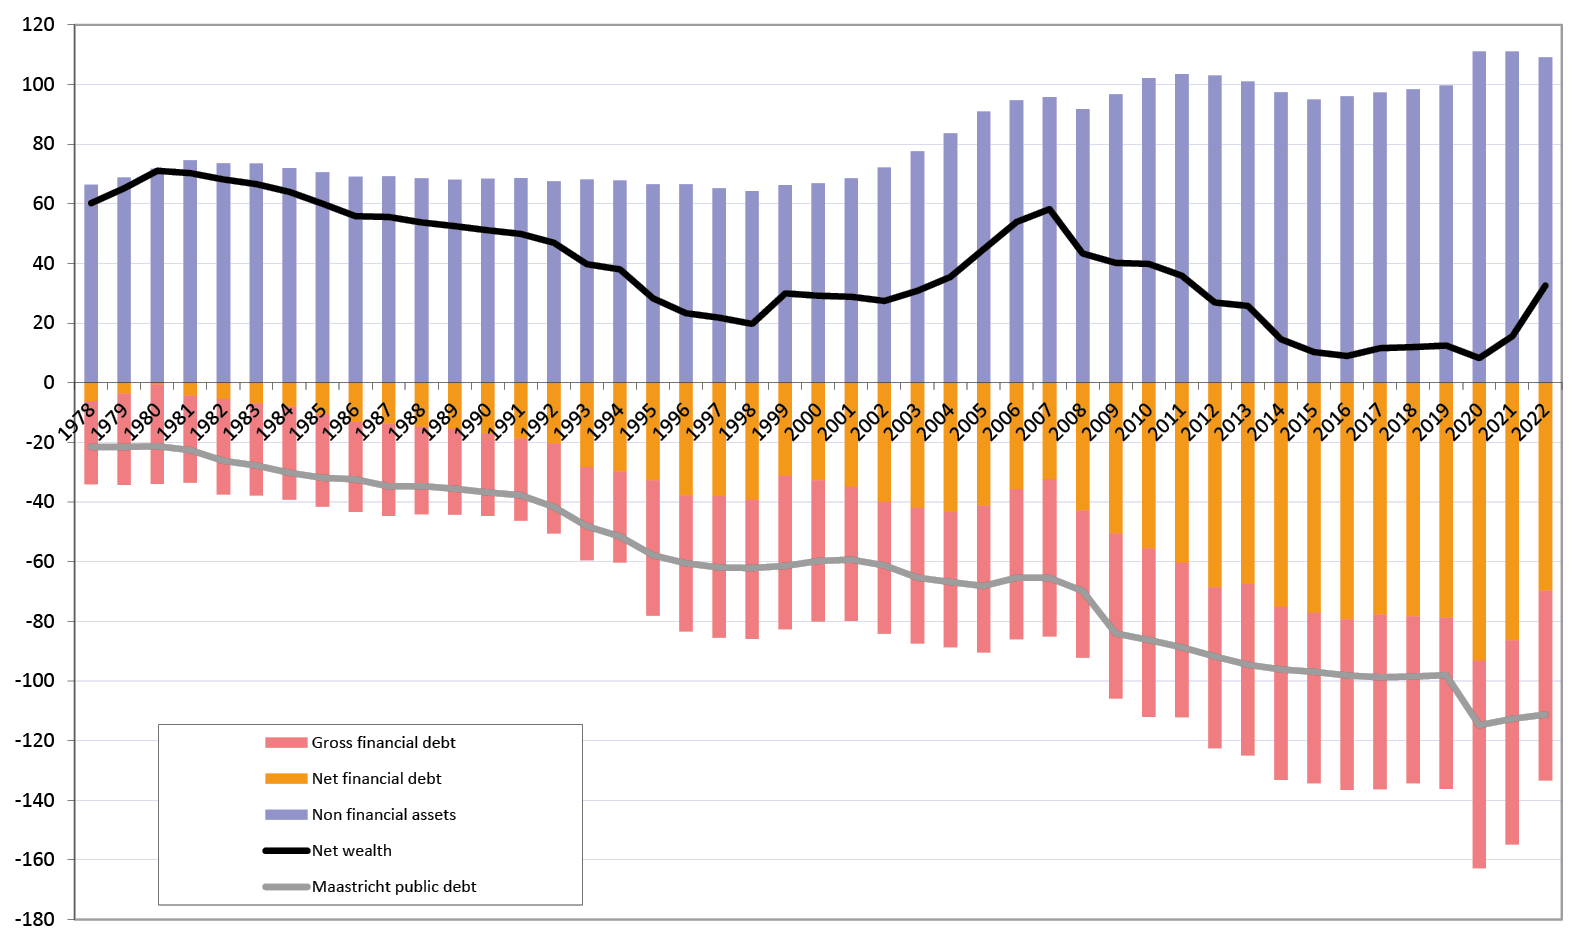
Fig. 2.4 Evolution of general government net wealth as a percentage of GDP. Source: Insee.
|
Online resources for Figs. 2.1–2.4 are available at |
|

2.5. Industrial Policies in France: A Perspective
2.5.1 A “Preference for the Present” More Marked than Ever
From the outbreak of the COVID-19 crisis in March 2020 until the legislative elections of July 1, 2024, the economic policy of French governments has been dominated by an explicit desire to support the industrial sector and to contribute to the reindustrialization of the country. This is even more noticeable considering that, from 2000 to the subprime crisis in 2008, France was committed with its European partners to the Lisbon Strategy: then, the aim was for the EU to become “the most competitive knowledge-based economy in the world”. In other words, it was tacitly assumed (and accepted) by policy makers, who sought remedies to revive flagging growth and productivity in Europe, that low value-added manufacturing activities were going to migrate to other countries and that Europe’s salvation laid in innovation and moving up in the value-added ladder. Hence the imperative to increase the national R&D effort to 3% of GDP. Not only has this objective not been achieved, but the indicator has even stagnated at 2.2% of GDP since 2000, with both public and private investment in R&D remaining below their target.
Then came the 2008 crisis. Admittedly, in terms of public investment, the main response imagined by President Sarkozy was to undertake a “major loan” to finance “investments for the future”: this approach was therefore still part of the “Lisbon” logic oriented towards specialization in high value-added sectors and developing new knowledge. But very quickly the focus shifted, and for the entire decade of the 2010s (and beyond), industrial policy was dominated by a new imperative: “restoring competitiveness”, the key concept of the report submitted to the Prime Minister Jean-Marc Ayrault in 2012 by Louis Gallois, former CEO of Airbus Group. The business world and public officials, at that time, no longer spoke of innovation, research or technological breakthroughs. On the contrary, they focused mainly on the effects on immediate competitiveness to be expected from reduction in costs. First, the massive reductions in employers’ social contributions granted by the government, which went from €26 billion in 2012 to €53 billion in 2018 (mainly to absorb unskilled unemployment but also to boost the price competitiveness of exporting companies); second, the reduction in production taxes by several governments in the past decade and the public support for the modernization of industrial sectors. In a sentence, even when it was about promoting new technologies, the focal point of industrial policies was no longer in the research laboratories but returned to the workshops and factories. The shared view was that thanks to the positive effects of labour costs moderation on cost competitiveness, businesses could invest in the upgrading of their productive apparatus. In other words, the State decided to support industry hic et nunc and seemed to have given up on the target of 3% of GDP in R&D, as if the development of the technologies of the future had become a less pressing emergency.
A new crisis, COVID-19, a new upheaval. Since the early days of the lockdown, in 2020, the notion of “industrial sovereignty” has very quickly eclipsed that of competitiveness. It is worth looking into this term, which in the current context has little to do with economics. The notion of “industrial sovereignty” appeared in the public debate after the response to the pandemic shock brought the economy to a standstill. Soon after that, the Russian invasion of Ukraine (which has considerably strained European energy supplies) and other traumatic events, such as the shortage of semiconductors during the recovery from the pandemics, also marked the spirits as confirmations that a political shift was necessary and urgent. Well beyond France, the “preference for the present” shaped policy responses to these crises, with a risk of giving excessive importance to their contingent causes, and of introducing biases in the subsequent recovery plans. In a tense international context, between China’s uncooperative state capitalism and the uninhibited protectionism of the United States, today we have reached a point where, to use the expression of a business leader, “politics has taken over”.8 In the United States, the Inflation Reduction Act (IRA) was introduced in August 2022 (White House 2023). The plan, which mobilizes almost $1400 billion in a variety of instruments including subsidies and tax incentives over ten years, is less a green transition policy than an industrial policy with several objectives: sovereignty, energy transition and catching up on infrastructure and all the physical assets in the United States. Europe’s response arrived only in February 2024, too late and too little, in the form of a very watered-down version of the European sovereignty fund proposed in 2022 by Ursula Von der Leyen (2022) during her State of the Union to support certain critical technologies: the Strategic Technologies for Europe Platforms (STEP). STEPs will leverage funding in support of critical technologies under existing EU programs and funds, up to €10 billion (European Commission 2023)—no comparison with the US budget. The most frequently stated objective of French policy makers is that of increasing the share of manufacturing value added in the economy by two or even five points of GDP, thanks to a plurality of public interventions: (a) ring-fencing of one of the most generous research tax credits in the world (€7.2 billion in 2021, of which around 60% mechanically benefits the industrial sector); (b) support for the reindustrialization of territories (€2 billion committed over three years by various public operators as part of the “Territoires d’industrie” operation); (c) state aids to promote the decarbonization of industrial processes (for example via €850 million in aid for the decarbonization of ArcelorMittal’s steel sites) and the establishment of giga-factories in the field of batteries (€1.5 billion in subsidies for ProLogium, €659 million for Verkor, among others) and so on.
Today, in Washington and Brussels as well as in Paris, there is no hesitation in considering or even calling for bold and interventionist industrial policies, driven by short-term political gains even when their long-term economic effectiveness remains uncertain. Paradoxically, this attitude presents two different and even quite independent starting points: a logical premise (Chinese industrial and environmental dumping and its effects on the American attitude, that call for a response from the EU) and a chronological beginning (the COVID-19 shock, which has propelled to the top of the political agenda the need to ensure “strategic autonomy” in the access to critical goods, from with masks and paracetamol to energy and semiconductors). The fact remains that, since 2020, a growing number of economists have joined their voices to those of business leaders, calling for the protection of European industry from global competition that is increasingly seen as unfair. Whether the “trade aggression’ first came from the United States (for several decarbonized industries such as low-carbon steel or green hydrogen for example, subsidized by the Inflation Reduction Act, see Blot et al. 2024), or came from China and triggered an American response (electric vehicles, photovoltaic panels, sovereign ambitions over Taiwan and its semiconductor industry), the conclusion is always formulated in the same terms: the European Union would be very “naïve” (this is the recurring term) not to protect its industry from a flood of Chinese and American imports. Not to mention the need for our continent to diversify its supplies of critical materials (lithium, rare earths, etc.) to succeed in its low-carbon transition while, once again, getting rid of dependence from China. We can see how this doctrine of public intervention differs from the two previous ones: it is no longer a question of betting on market mechanisms and free competition, nor of conditioning state aid to the broad objective of innovation, but rather of adopting a logic of capacity. There is no doubt that the COVID-19 crisis and the rise in international tensions have constituted an unprecedented framework within which the rethinking of industrial policies has taken place, but one cannot help but note that this new, widespread, doctrine has not yet been the subject of an in-depth examination of its effectiveness.
2.5.2 A Geological Stack of Public Investment Policies
In the ministerial titles and the formulation of the government’s strategic priorities, this substitution of competitiveness by sovereignty is total. Such a semantic shift is also in tune with the international environment: Chinese dumping, colossal fiscal spending in the United States, promises of industrial and energy independence by the pro-Brexit advocates in the United Kingdom, and affirmation of an objective of industrial sovereignty in Korea... The French goal of supporting “industrial sovereignty” is in the spirit of the times.
However, it remains contradictory in the sense that, on the ground, more precisely in the details of the policy mix currently active in France, the public investment channels from these different eras coexist, like fossils of different ages imprisoned in their respective geological layers. Thus, from the “Lisbon” period, France has retained the measures to support technology and certain disruptive innovations, a strong encouragement for public-private cooperation and business creation in the additional credits for public research, the already mentioned research tax credit, competitiveness clusters to promote innovation in the territories, etc. From the following period of “cost competitiveness”, we already mentioned the massive reductions in employer social contributions, which today are higher than ever (almost €74 billion in 2022), the gradual reduction of production taxes, which benefits above all medium-sized enterprises, and the support for firms in their effort to upgrade to 4.0 solutions. Finally, the “sovereignty” phase is exemplified by the already mentioned “Build the France of 2030” investment programme which emphasizes targeted, top-down, State aids (in particular the decarbonization of the main greenhouse gas emitting sites, the revival of defence programs, support for supply security strategies, etc.).
2.5.3 A Strong Point: A Refocusing of Strategic Decision-Making
From what precedes, it is clear that French industrial policies are currently at the service of a plurality of objectives, stemming from layers of very different visions of “market failures” that justify public investment. And yet, the business world—that loves nothing more than predictability—today does not seem particularly critical of this panoply of interventions. There are several reasons for this. The first, obvious one, is that the rise of a political narrative of protecting the industrial sector has given economic actors a positive image of the role they play for the economy as a whole and specifically in certain regions. The fact that the public investment programs are piling up in a somewhat disorderly manner is not enough to obliterate the (correct) impression among businesses that there is growing attention paid to their daily difficulties and survival conditions. A second explanation is that, amid this plurality of financing tools, a few emerge in a central, visible position and quite close to the central government. Thus, the General Secretariat for Investment (Secrétariat général pour l’investissement, SGPI) stands out as the major player in charge of coordinating several strategic investment channels, as part of the “Build the France of 2030” programme. Additionally, the powerful Caisse des Dépôts (CDC) is increasingly attentive to the fate of industry within the context of its investment projects for territorial development and infrastructures. This is where the French government has some fiscal space to finance priority investments (apart from defence), beyond the mechanical renewal of the commitments made by the ministries and other dedicated agencies. Powerful operators with a good public image, such as Bpifrance, the Banque des territoires (a subsidiary of CDC) and Ademe9 are in fact the armed wings of CDC and SGPI in terms of industrial policy. For example, the Banque des territoires plans to spend more than €1 billion to reindustrialization over 2023–2027 period, financing “turnkey” plants and industrial projects. All in all, since 2020, the Banque des territoires has provided €1.2 billion in equity financing for 260 projects, including 40 new plants (Charlet 2024).
Finally, a third reason why the business world does not seem concerned with a somewhat chaotic set of interventions may be that, in the current economic and geopolitical environment, what is perceived by businesses as the most urgent need is a properly functioning framework for doing business: managing energy prices and production ramp-ups (gas, carbon-free electricity and hydrogen, etc.), adapting human capital and skills to the new needs and attracting talents, securing the supply of critical assets, guaranteeing access to land resources that seem increasingly scarce as conflicts and environmental constraints become more important, economic and geopolitical stabilizing of global supply chains, and so on. These are the concerns that top the list of businesses surveyed: not the fiscal aid to support price competitiveness nor the technological sources of non-price competitiveness.
2.6 Conclusion. A Lack of Readability, Reflecting a Lack of Doctrine
The main weakness of France’s industrial policies today is not a “simple” problem of disorderly accumulation of policies but, more fundamentally, a lack of doctrine. The common belief that industry must be supported through ad hoc public investments has certainly gained momentum, but it has also become more cacophonous. It does not seem excessive to conclude that French policy makers no longer know what they are looking for in this area: is it a question of raising industrial employment to the point of “reindustrializing the country”? Of restoring the competitiveness of businesses to stop the deterioration of the trade deficit? Of supporting the development of innovations, green or not, which will prepare tomorrow’s industrial activity? To put an end to the widening of economic gaps between territories? To defend France’s place in a turbulent geopolitical environment...? All these goals—and others—are explicitly mentioned at the same time, sometimes even accompanied by sets of key performance indicators.
Realistic policies inherently require balancing multiple objectives; but it must be acknowledged that these objectives can only be partially achieved, a concession that is not often voiced these days. It is undeniable that the deindustrialization of developed countries has led to several disastrous collateral effects; however, it is far more doubtful that the resources currently available for public policies are sufficient to fully address them. As it stands, a great deal of emphasis is therefore placed on industrial policies, but no one knows how to measure whether success will be possible in a few years; time, which may seem problematic in an unstable political climate, when there is, more than ever, the need for clarity.
References
Blot, C., J. Créel, H. Kempf, S. Levasseur, X. Ragot, and F. Saraceno (2024) “Sailing in All Weather Conditions the Next 25 Years: Challenges for the Euro”, Paper Prepared for the European Parliament ECON Committee Monetary Dialogue, February.
Bubbico, R. L., P. B. Brutscher, and D. Revoltella (2020) “Europe Needs More Public Investment”, in F. Cerniglia and F. Saraceno (eds), A European Public Investment Outlook. Cambridge, UK: Open Book Publishers, pp. 17–32, https://doi.org/10.11647/OBP.0222.01
Charlet, V. (2024) Ce que l’industrie attend des banques. Paris: Presses des Mines.
European Commission (2023) “EU Budget: Commission Proposes Strategic Technologies for Europe Platform (STEP) to Support European Leadership on Critical Technologies”, European Commission.
Pisani-Ferry, J., and S. Mahfouz (2023) “Les Incidences Économiques de l’action Pour Le Climat”, May 22, France Strategie, Rapport à La Première Ministre, https://www.strategie.gouv.fr/publications/incidences-economiques-de-laction-climat
Plane, M., and F. Saraceno (2021) “From Fiscal Consolidation to the Plan de Relance’, in F. Cerniglia et al. (eds), The Great Reset―2021 European Public Investment Outlook. Cambridge, UK: Open Book Publishers, pp. 33–46, https://doi.org/10.11647/OBP.0280.02
Von der Leyen, U. (2022) “State of the Union”, 14 September, European Commission, https://state-of-the-union.ec.europa.eu/state-union-2022_en
White House (2023) Building a Clean Energy Economy: A Guidebook to the Inflation Reduction Act’s Investments in Clean Energy and Climate Action. Washington, DC: The White House, https://www.whitehouse.gov/wp-content/uploads/2022/12/Inflation-Reduction-Act-Guidebook.pdf
1 Fabrique de l’industrie.
2 Observatoire Français des Conjonctures Economiques (OFCE) Sciences Po.
3 Observatoire Français des Conjonctures Economiques (OFCE) Sciences Po and Luiss Institute for European Analysis and Policy (LEAP).
4 The Central government and the Social security represent respectively 36% and 45% of total public expenditure.
5 The “Build the France of 2030” plan, worth €54 billion over five years, aims to develop industrial competitiveness and the technologies of the future.
6 According to the Pisani-Ferry Mahfouz (2023) report, the need for additional financing in 2030 for the energy transition to meet our climate commitments would represent €67 billion per year, of which €34 billion would be public investment (1.2 pp of GDP).
7 The difference between Maastricht debt and the financial liabilities of public administration is significant, as these two concepts are used in different accounting and economic contexts, although both relate to public debt. Maastricht debt includes the financial commitments of public administrations in the form of debt securities (bonds), loans (bank loans, credits), and deposits (debts to depositors) but commercial debts (unpaid bills, arrears) and financial derivatives (such as swaps) are not included in this definition but are included in financial liabilities.
8 This quote is attributed to Pierre-André de Chalendar, when he was president of Saint-Gobain.
9 Bpifrance is the French public bank dedicated to venture investment (reindustrialization, green transition, Deep Tech…). The “Banque des territoires” is its counterpart dedicated to public investment in regions (infrastructures, sustainable mobility, ICT equipment…). The Ademe is the national agency devoted to energy transition and savings.