
5. Public Investment and Structural Transformation in Spain
Ignacio Álvarez1 and Jorge Uxó2
©2024 Ignacio Álvarez and Jorge Uxó, CC BY-NC 4.0 https://doi.org/10.11647/OBP.0434.06
During the decade of 2010–2019, public investment experienced a profound decline in Spain, because of the fiscal austerity policies implemented during the Great Recession. Even with the recovery of economic growth starting in 2015, public investment did not improve and the net capital stock decreased. The COVID-19 pandemic introduced an important change in trend, with a general turnaround in fiscal policies accompanying the disbursement of Next Generation EU funds. These European Union funds will allow the implementation of an industrial transformation strategy focused on key specific sectors with high pulling power and strong multiplier effects.
5.1 Introduction
For several reasons, public investment is essential to any country’s economic and social development. It finances the construction and maintenance of crucial infrastructures such as roads, bridges, hospitals, schools, and transport networks. It stimulates aggregate demand in the short term and economic growth in the medium and long term by increasing the economy’s productive capacity. Funding for research and development fosters innovation, technical change, and competitiveness. It can contribute to economic stabilization, particularly during economic recessions, when the private sector withdraws its investment. It helps to reduce regional and social inequalities as economic policy can direct this investment towards essential activities or regions where the private sector does not always invest. Investment in education and health also strengthens human capital, key for productivity development. Also, public investment is a necessary lever to ensure the success of structural transformation processes in modern economies (the transition towards a green economy, the reduction of dependence on fossil fuels, or the progress of digitalization).
Public investment, therefore, plays a vital role in the development of a sound and competitive economy, providing some of the foundations for society’s long-term well-being. However, despite this importance, public investment in Spain has experienced a worrying performance over the last decade, with a sustained contraction that has only recently begun to change.
5.2 Trends and Patterns of Public Investment in Spain
In Spain, public investment has experienced a very irregular trajectory over the last few decades, traditionally characterized by pro-cyclical behaviour. From its admission into the European Union in 1986 until the arrival of the Great Recession in late 2007, Spain experienced an intense investment process, always above the European Union (EU) average when measured as a ratio over GDP. However, with the arrival of the Great Recession and austerity policies, public investment fell sharply and remained on the back burner for years.
As we can see in Figure 5.1, from 1986 to 2009, public investment in Spain reached an average of 4.2% of GDP, approximately one percentage point above the European Union average, thus favouring the Spanish economy’s convergence with neighbouring countries. However, after the Global Financial Crisis, public investment fell to an average of close to 2% of GDP, one point below the EU average.
Indeed, this remarkable reduction in the investment effort in terms of GDP also translated into a significant cutback in the absolute levels of public investment. As can be seen in Figure 5.2, between 2010 and 2015, Spanish public investment fell by more than 100% (€33 billion), and the recovery of economic growth from 2015 onwards has not even allowed to return to previous levels. Public investment at the end of 2023 was still 40% lower than in 2009 and similar in nominal terms to 2002, two decades earlier.
Public investment was pro-cyclical during the 1980s and early 1990s, growing with the expansion (1986–1991) and shrinking during the subsequent crisis (1992–1993). This pattern repeated in the following decades: public investment participated in the expansionary trend during the real estate boom of 1995–2007 and, although they remained counter-cyclical in the first years of the financial crisis (2008–2009), they finally collapsed from 2010 onwards. Thus, instead of playing a stabilizing role during the Great Recession, the evolution of public investment contributed to deepening the crisis. This pro-cyclical nature of Spanish public investment is related to its use as an adjustment variable by successive governments. It is increased when fiscal resources are available and reduced when they are lacking (Pérez and de Guevara 2024).
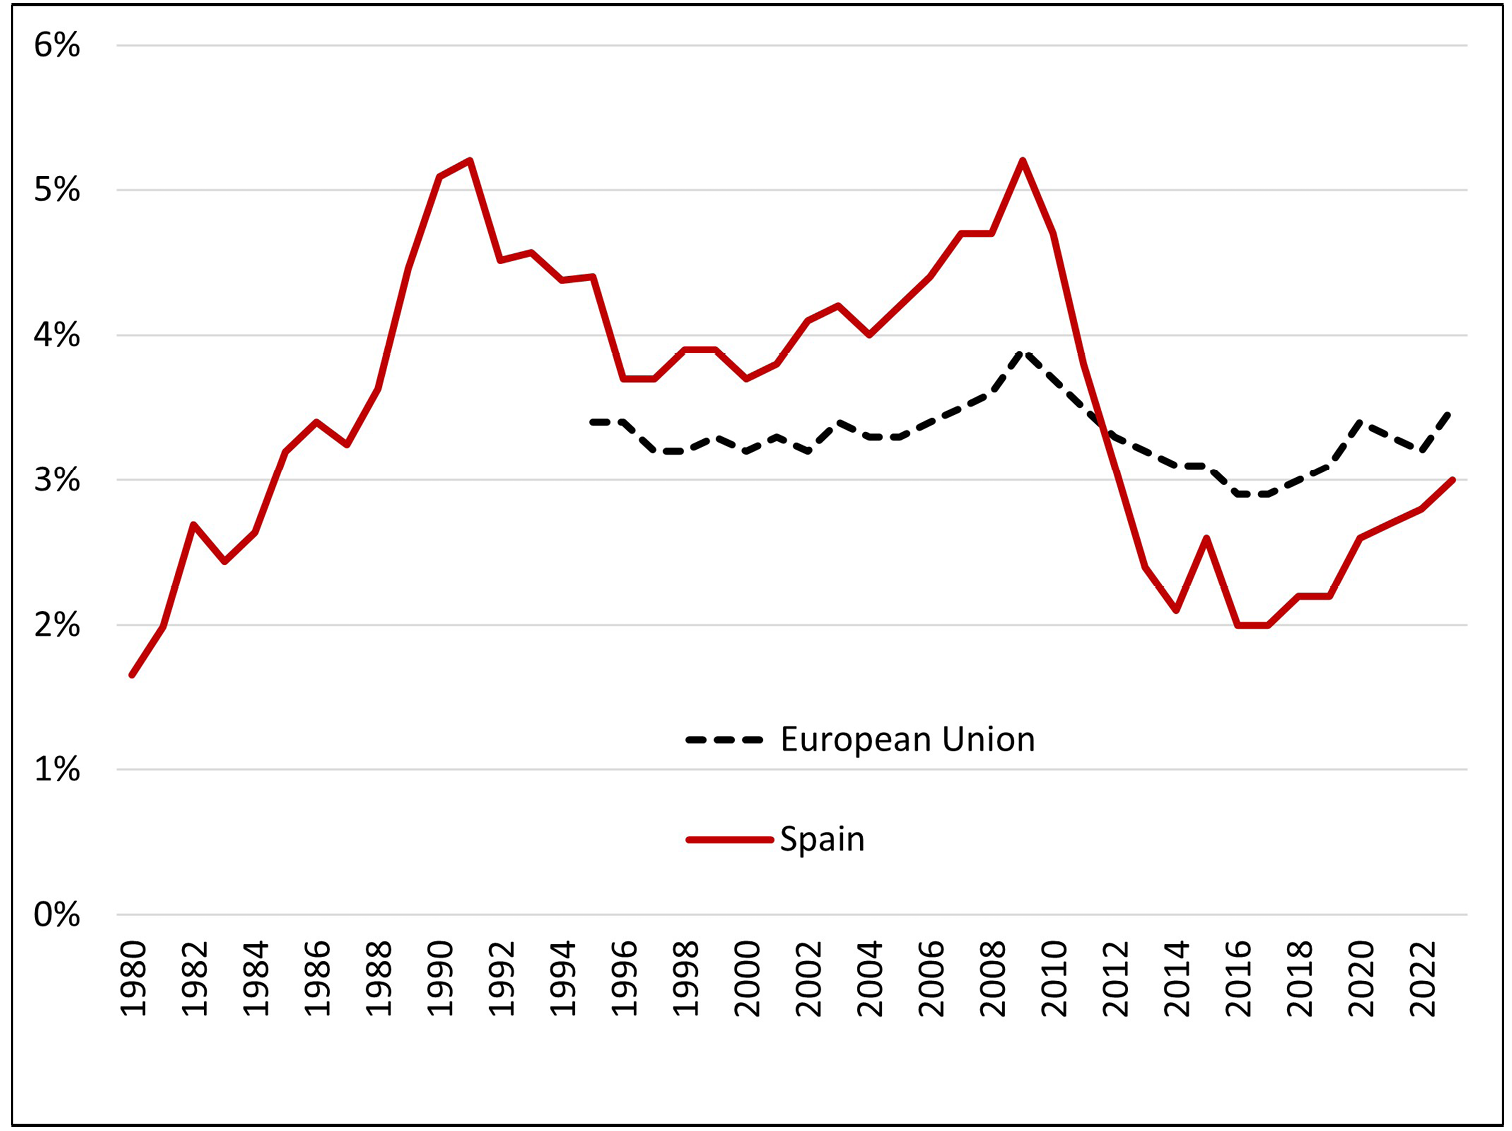
Fig. 5.1 Gross public investment (as a percentage of GDP). Source: Spanish National Accounts, National Institute of Statistics (INE) and AMECO.
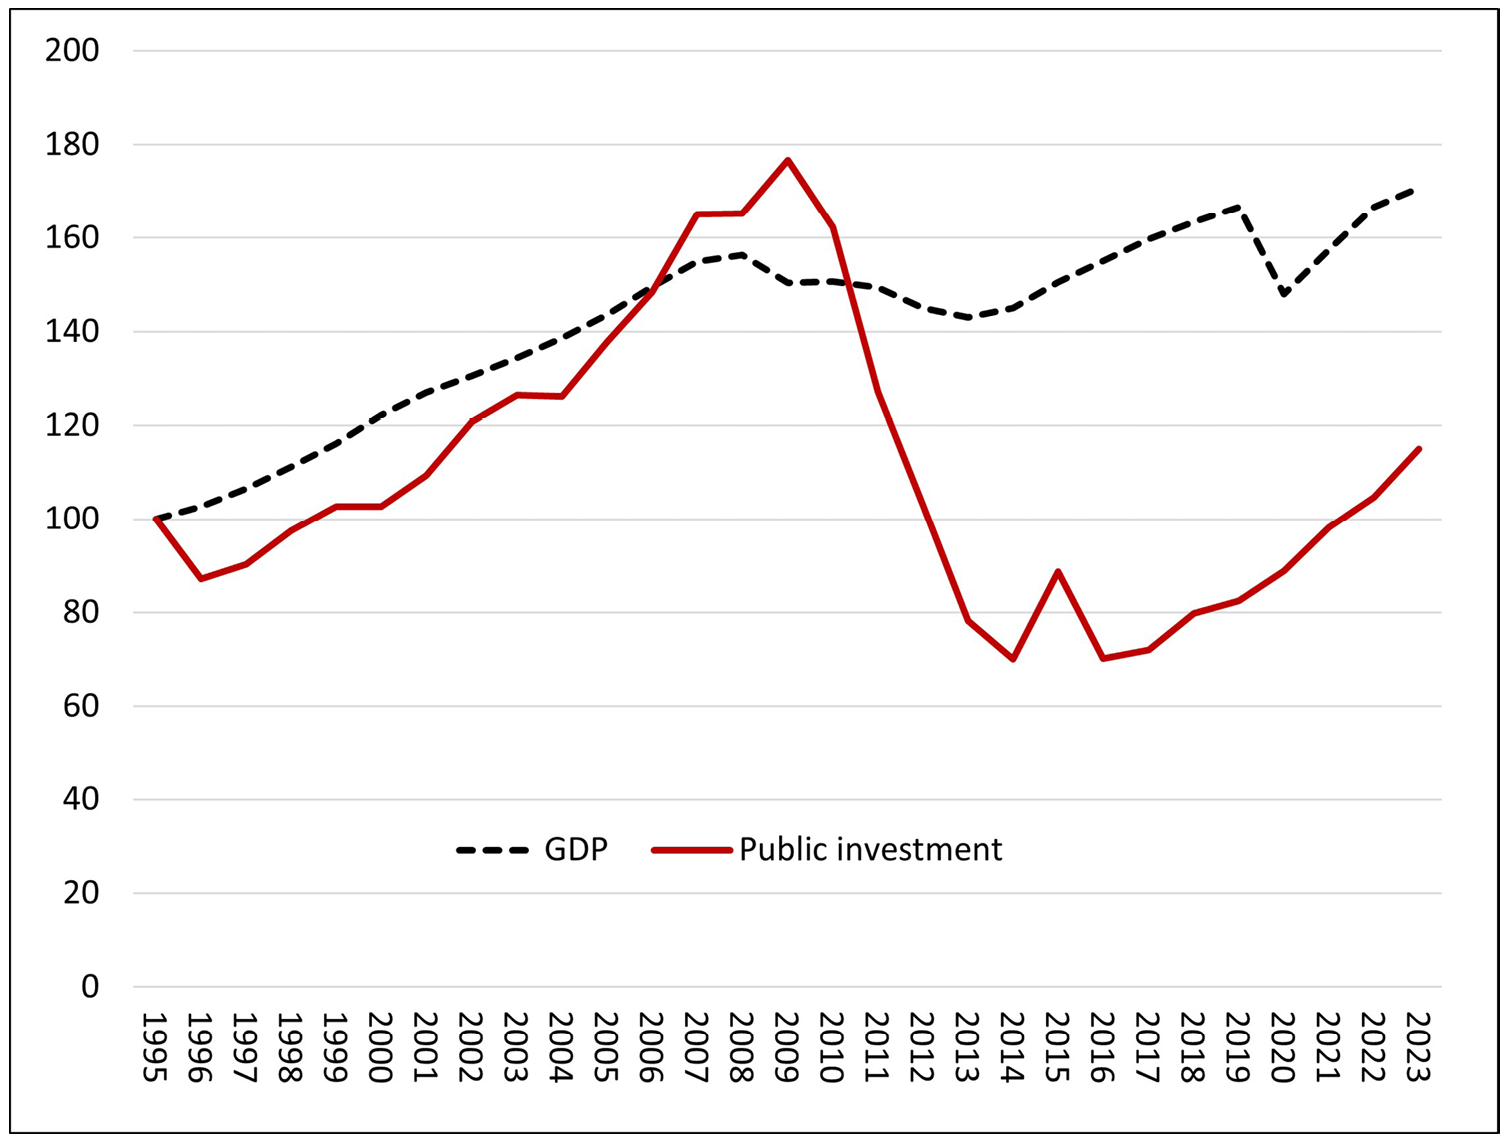
Fig. 5.2 Evolution of gross public investment and GDP in Spain (real, 1995=100). Source: AMECO.
The fall in public investment from 2010 onwards was notable both for productive infrastructures (transport, energy, and urban infrastructures) and for social infrastructures (education, health, or social services). They fell sharply from 2010 to 2014 and stagnated considerably in subsequent years (Fig. 5.3).
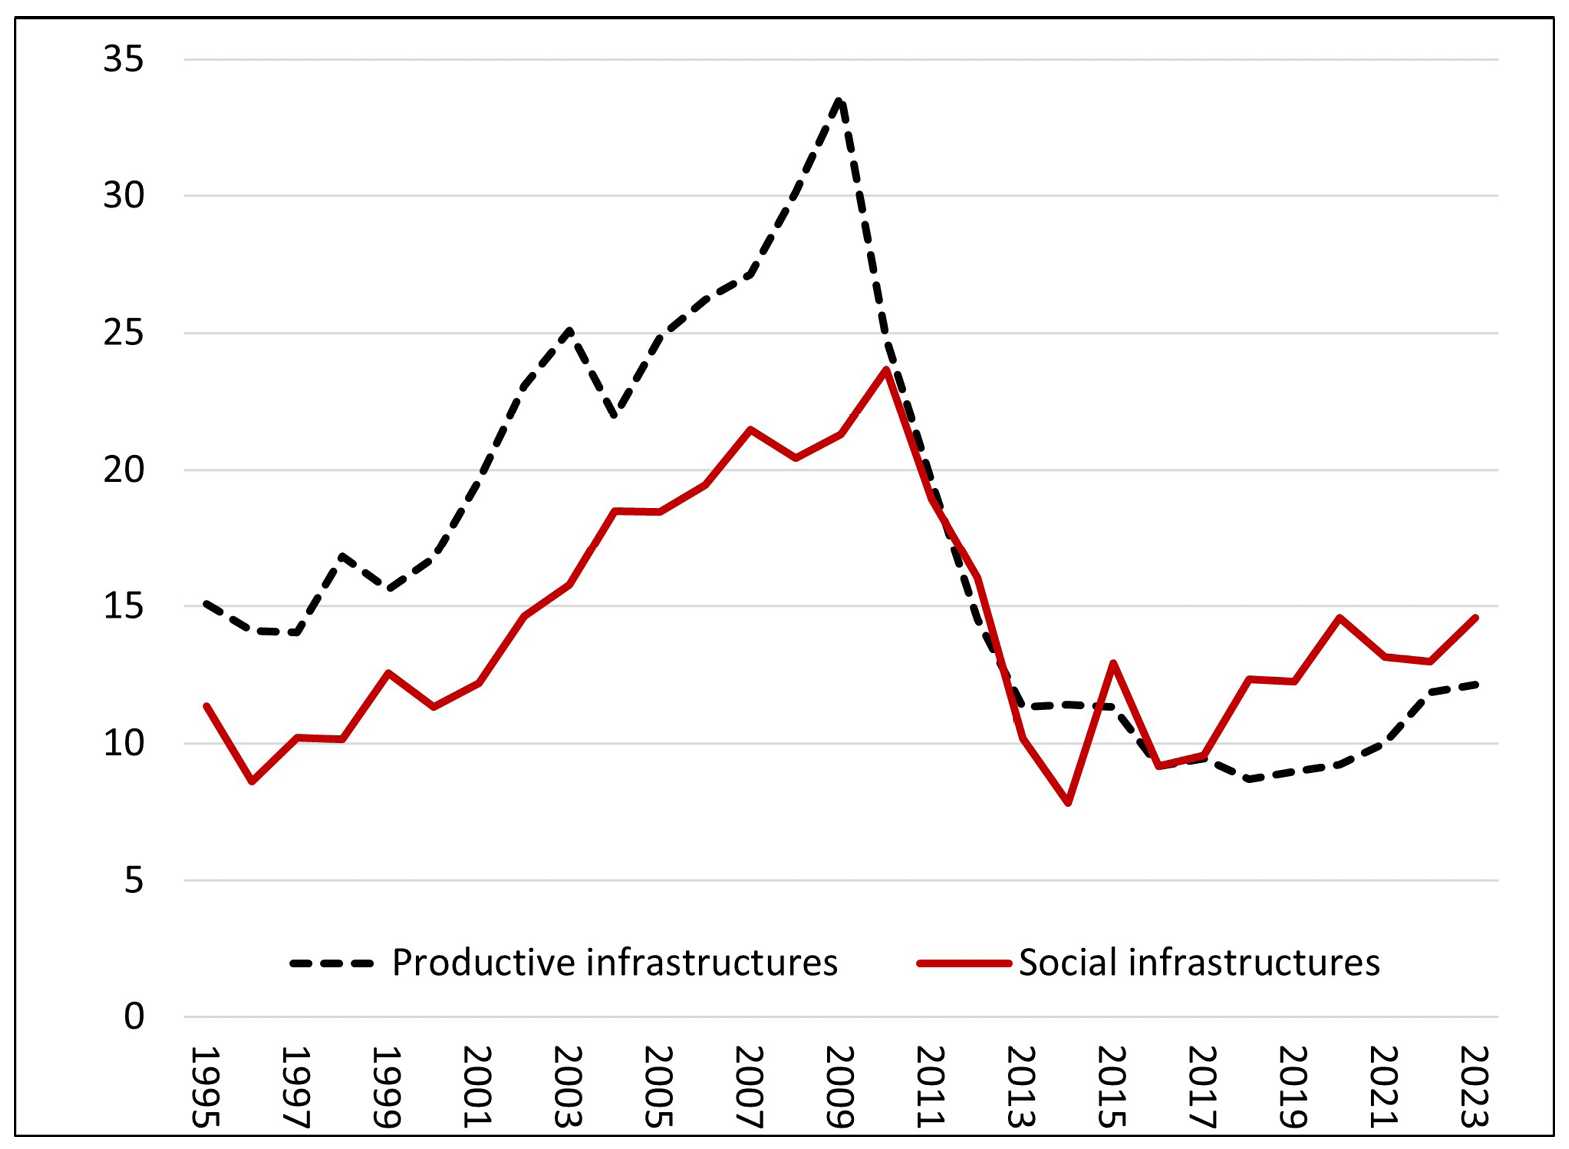
Fig. 5.3 Public infrastructure investment, Spain, 1995–2022 (billions of 2015 euros). Source: BBVA Foundation-IVIE and authors’ calculations.
Moreover, starting in 2010, Spain entered a period in which the public sector’s net fixed capital formation—that is, investment once capital consumption has been subtracted—was negative for a whole decade and did not even cover public capital’s depreciation (Fig. 5.4).
The turning point in this anaemic evolution of Spanish public investment is not linked to the recovery of economic growth. In fact, the economy returned to solid growth between 2015 and 2019, and yet public investment remained stagnated as national authorities tried to rapidly reduce the public deficit by adjusting public investment downward.
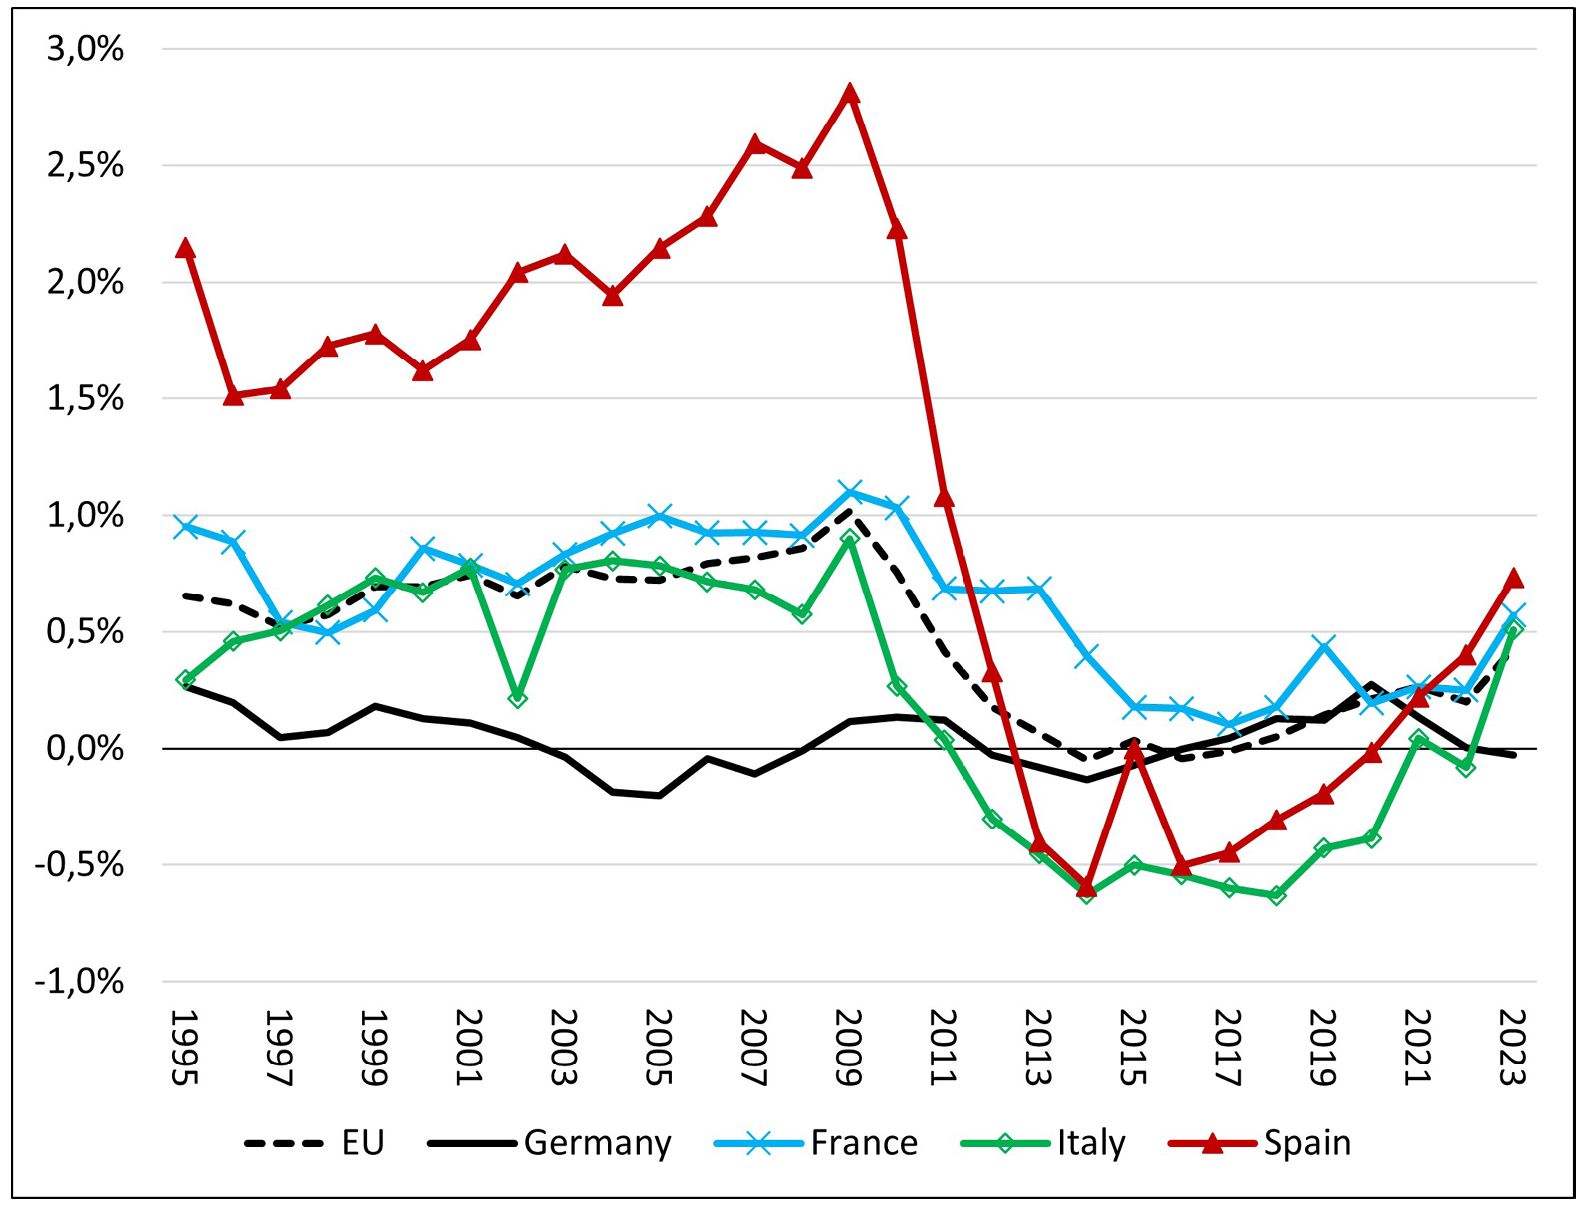
Fig. 5.4 Net public investment (as a percentage of GDP). Source: AMECO.
The change in the trend of public investment did not arrive until the COVID-19 pandemic, with a general turnaround in fiscal policies accompanying the disbursement of Next Generation EU funds. This has allowed both the investment effort as a percentage of GDP (Figs 5.1 and 5.4) and public investment levels (Fig. 5.2) to begin to rise. However, the critical question now is whether this change in trend will continue in the future, after the end of Next Generation funds and the reinstatement of fiscal rules.
5.3 From Investment to Capital Accumulation: The State of the Public Capital Stock in Spain
The evolution of the investment effort (flow) seen in the previous section is reflected in the public capital stock. During the 1990s and 2000s—and in parallel with the expansion of the economy itself—the stock of public capital grew rapidly in Spain, doubling in these years. This growth was maintained during the first years of the Great Recession (in 2008–2009), thanks to the so-called Plan E (a public investment program with which the government tried to tackle the recession at the time). However, the adoption of fiscal austerity policies in 2010 initiated a new phase, in which gross public investment could not even cover the depreciation of existing public capital and the stock began to progressively shrink (decreasing by 2% between 2010 and 2020, Figure 5).
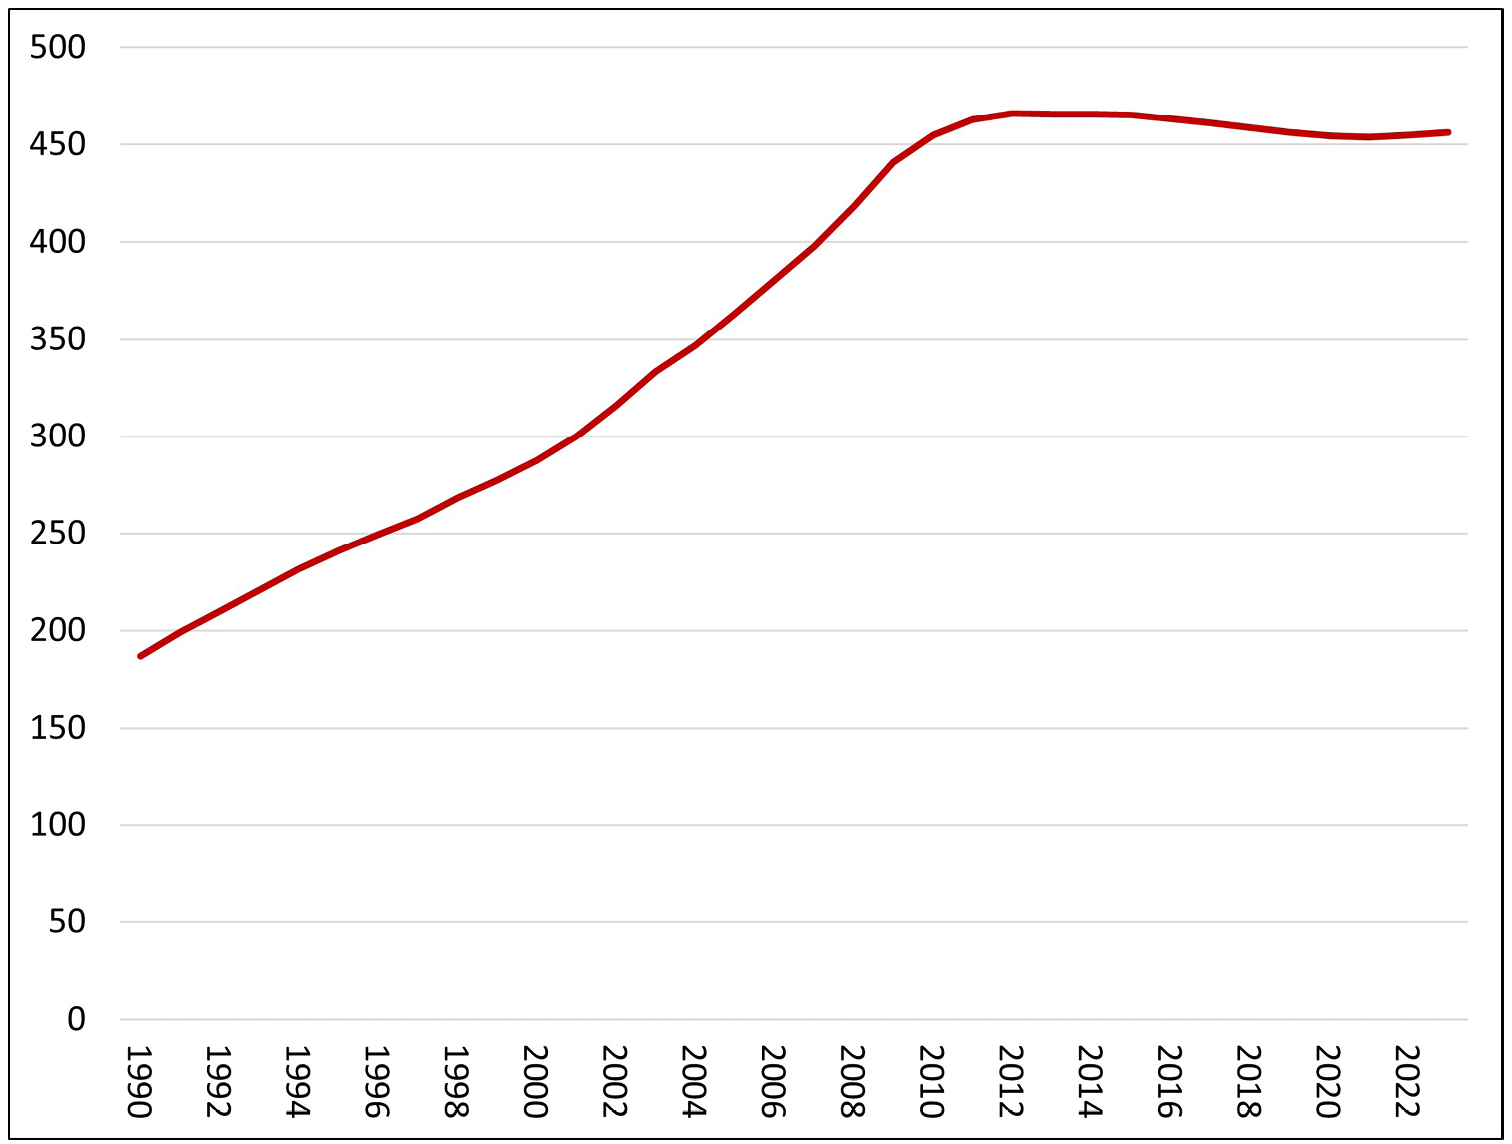
Fig. 5.5 Evolution of Net Public Capital Stock in Spain, 1990–2023 (billions of 2015 euros). Source: BBVA Foundation-IVIE.
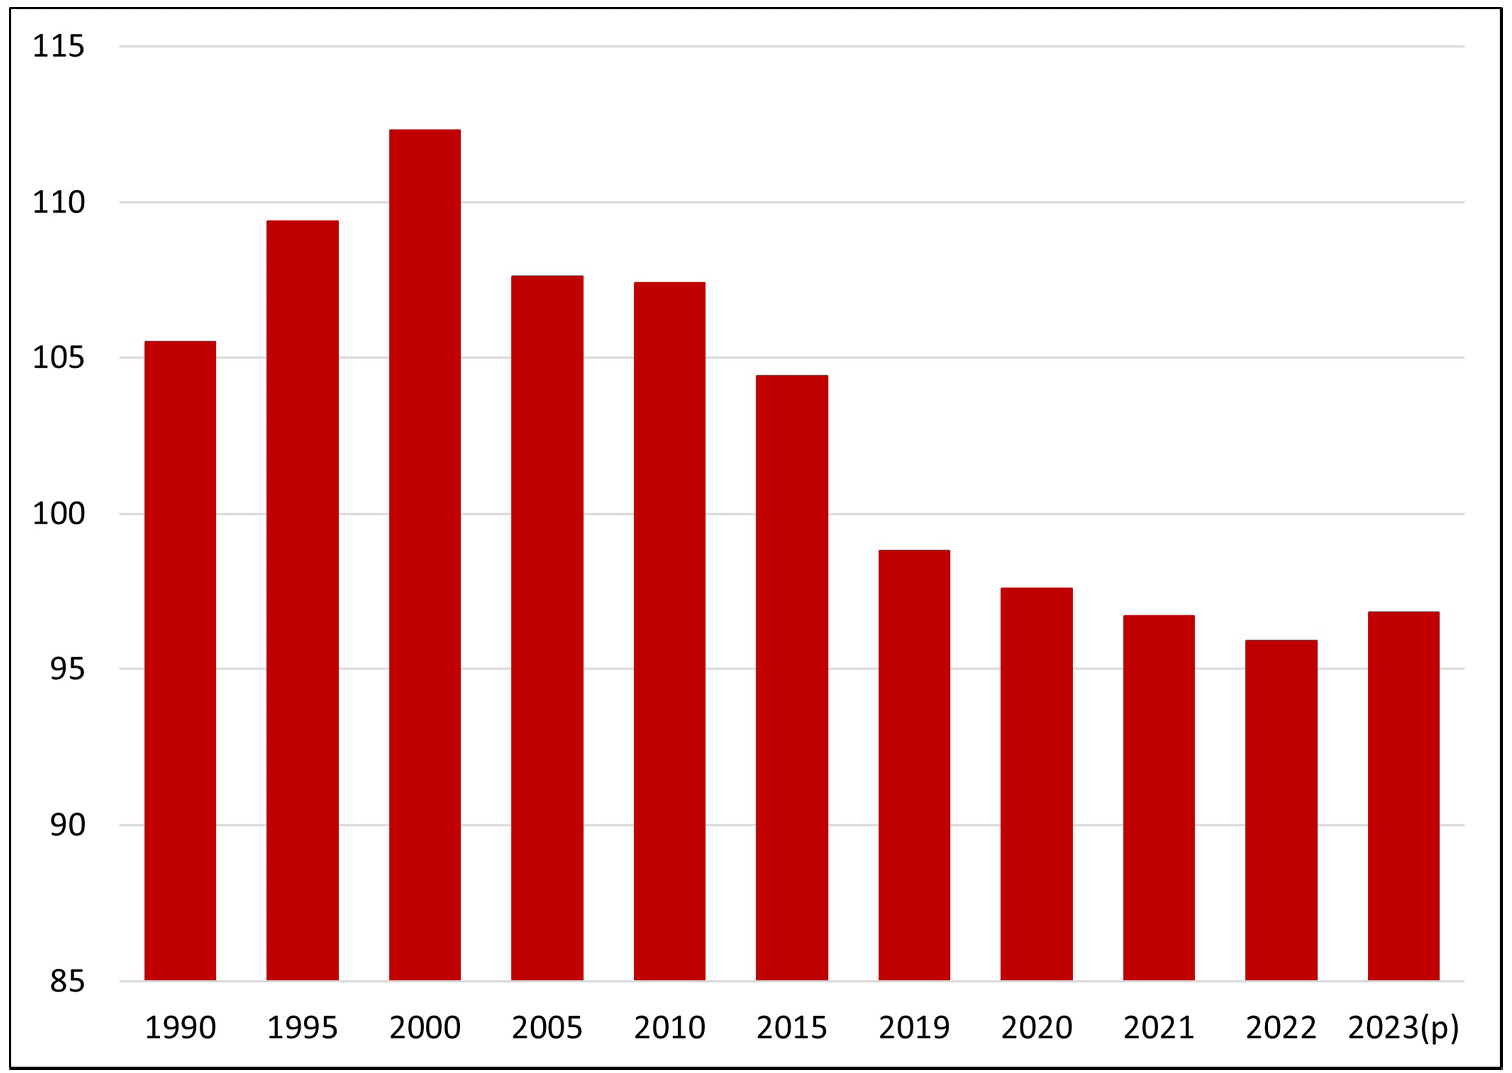
Fig. 5.6 Public capital stock per capita (Spain-Eurozone ratio, Eurozone=100). Source: Bank of Spain and authors’ calculations.
This evolution of the public capital stock after the Great Recession has led to a “lost decade” in Spain in terms of new infrastructure development. As shown in Figure 5.6, Spain’s public capital stock per capita moved away from the Eurozone average after the Great Recession due to the aforementioned short-circuit in public investment. In fact, between 2010 and 2019, the scarce investment flows have not been sufficient to maintain existing infrastructure in good condition, with the consequent loss of public capital and the aging of these infrastructures.
Looking at the evolution of public capital stock by asset types, we can observe a remarkable growth in all kinds of infrastructures up until the financial crisis (Fig. 5.7). Between 1995 and 2010, the share of transport infrastructure, particularly roads and railways, increased. Although on a smaller scale, the growth of airport infrastructure was also notable in Spain during these years. From 2010 onwards, however, hydraulic infrastructure and airports were particularly affected by the impossibility of covering the depreciation of their value.
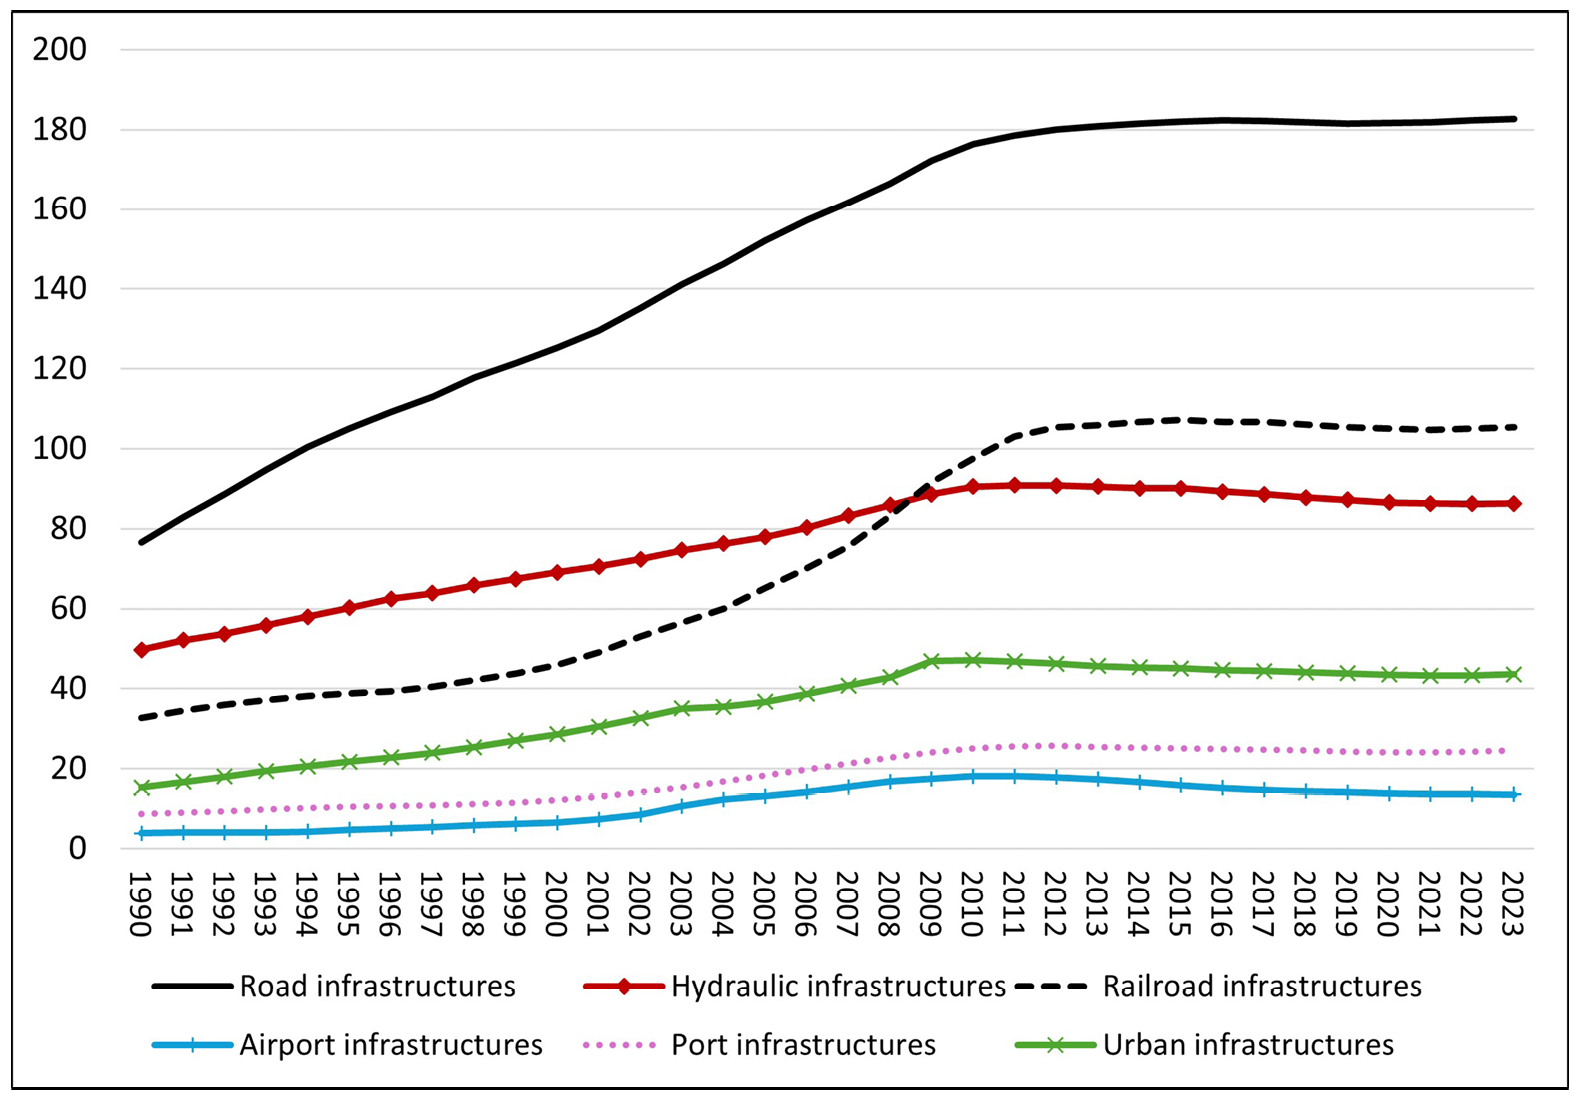
Fig. 5.7 Evolution of Net Public Capital Stock in Spain by type of asset, 1990–2023 (billions of 2015 euros). Source: BBVA Foundation-IVIE.
A consequence of the slow investment pace and depreciation of the public capital stock during 2010–2019 has been the progressive aging of assets. In 2007, the average age of Spanish infrastructure was very low compared to neighbouring countries. However, after a decade of not covering capital depreciation, this age increased sharply: assets older than twenty years represented 11% of total public infrastructure in 2007, having risen to 22.5% in 2016 (Fundación BBVA-IVIE 2019). If this slow pace of investment had been maintained, the percentage of infrastructure over twenty years old in 2030 would exceed 50% in the case of road (51%), rail (52.5%), and water (71%) infrastructure.
The inability of the Spanish economy to ensure the renewal of the capital stock during the decade following the financial crisis constitutes a very worrying dynamic, given that it could undermine the medium-term evolution of productivity and future growth. But at the same time, the Spanish experience should make us reconsider the need to thoroughly assess the costs and returns of certain inefficient infrastructure investments, such as some regional or local airports or certain road infrastructures. In the wake of this experience, there is a clear consensus on the need to prioritize those investments that are capable of driving the structural transformations that the country needs: for example, investments that lead the energy transition and allow Spain to change its competitiveness model from one based on low wages to another (more promising) one based on attracting industry thanks to clean, safe, and cheap energy.
5.4 Recovery, Transformation, and Resilience Plan: Impact in Spain
It is very unusual for the same generation to experience two major economic crises in a short period and thus be able to compare them. Nevertheless, this happened precisely with the Global Financial Crisis of 2008–2013 and the COVID-19 pandemic, when completely different economic policy measures were applied. Moreover, public investment is one of the areas where we can best see this change in economic policy strategy.
The response to the 2007 Global Financial Crisis was fiscal austerity, with significant cuts in public spending and investment. However, the response to the COVID-19 crisis was a stark contrast, in the form of an ambitious fiscal expansion program. This program, which includes more than €800 billion in loans and grants until 2026 to the different EU countries (€160 billion to Spain), has marked a shift in the use of public investment as an “adjustment variable” in the face of a crisis.
Figure 5.8 compares the pattern of public investment during the 2007 crisis and the COVID-19 pandemic. Between 2007 and 2011, public investment contracted by 21.3%, with public education (down 40%) and social services (cut by 32%) being the most affected components. The response to the COVID-19 crisis was very different. Not only did total investment not fall, but it grew by 19.2%, and so did its various components: education (41%), public health (29%) and social services (60%).
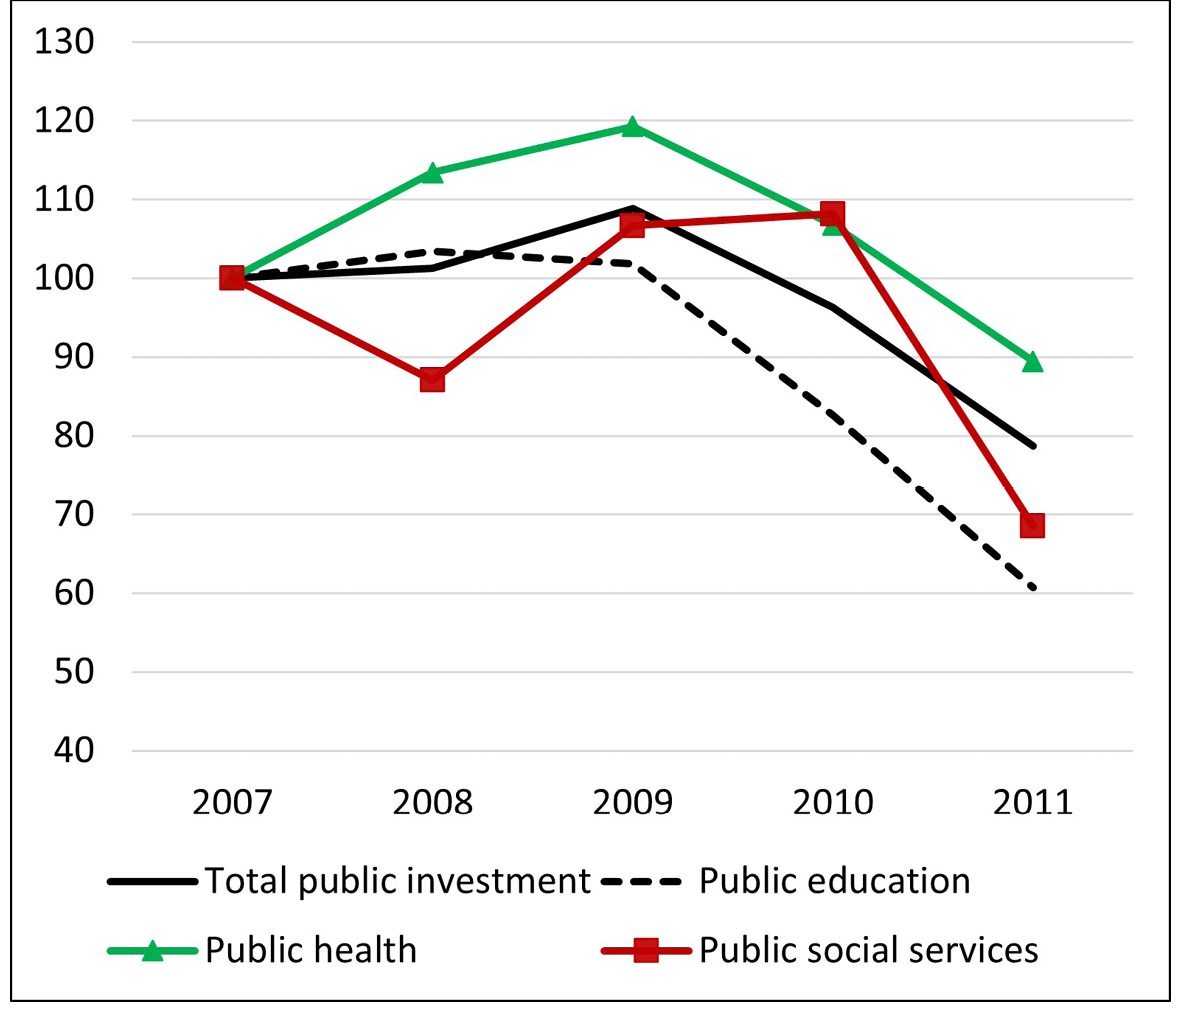
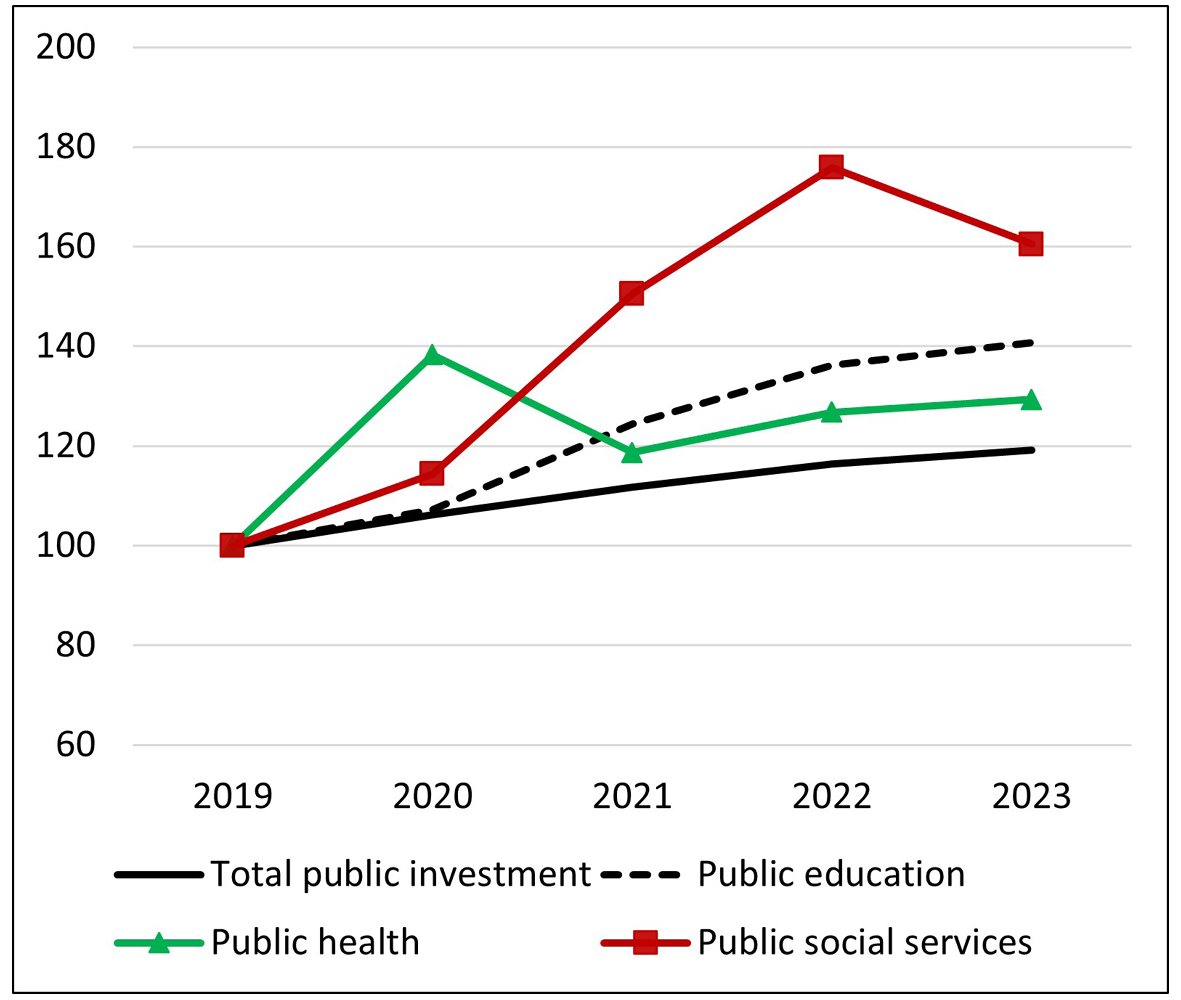
Fig. 5.8 Gross public investment. Great Recession compared to COVID-19 (Index 2007=100 and 2019=100). Source: BBVA Foundation-IVIE and authors’ elaboration.
Spain is one of the countries with the largest allocation of Next Generation EU funds. Specifically, it has approximately €77 billion in transfers and up to €83 billion in loans, resources that have already been partially channelled into the economy during 2021–2023. This European funding has helped Spain to incorporate in its General State Budgets for 2021, 2022, and 2023 an average of around €30 billion per year in new public investment, making it one of the EU countries that is implementing the Recovery, Transformation, and Resilience Plan most rapidly. This implementation has been designed in two phases: a first one during the three-year period 2021–2023, focused on achieving a solid counter-cyclical impact, and a second one in 2023–2026, aimed at strengthening and completing the highest impact projects through the mobilization of loans.
This Recovery Plan has not only allowed a turning point in the dynamics of Spanish public investment, boosting aggregate demand and guaranteeing the growth of the country’s public capital stock. It has also been accompanied by a new industrial policy—negotiated with the European Commission—selecting a series of priority sectors for this investment. Thus, twelve Strategic Projects for Economic Recovery and Transformation (PERTEs, in Spanish) have been launched, bringing together a total public investment of more than €40 billion and aiming to act as “missions” following Mariana Mazzucato’s philosophy. These unique, large-scale projects aim to transform the country’s productive structure to address major economic, social, and environmental challenges. To this end, these large projects coordinate efforts between public and private sectors, focusing fiscal stimulus on specific key sectors with high pulling power and strong multiplier effects. Table 5.1 shows the twelve PERTEs of this new industrial policy, as well as the amount of public investment allocated to each of them.
Table 5.1 Strategic Projects for Economic Recovery and Transformation (PERTEs), November 2023. Public investment in millions of euros. Source: Recovery, Transformation, and Resilience Plan, Government of Spain (2023).
|
Development of the electric vehicle |
4.120 M€ |
|
Advanced healthcare |
1.640 M€ |
|
Renewable energy, hydrogen and storage |
10.797 M€ |
|
Agrifood supply chain |
1.357 M€ |
|
New language economy |
725 M€ |
|
Circular economy |
792 M€ |
|
Shipbuilding industry |
150 M€ |
|
Aerospace industry |
931 M€ |
|
Digitization of the water cycle |
3.485 M€ |
|
Microelectronics and semiconductors |
12.250 M€ |
|
Social and care economy |
1.766 M€ |
|
Industrial decarbonization |
3.170 M€ |
This public investment plan, focused on some strategic projects, presents a second novelty: its link with an extensive and ambitious program of new structural reforms. These reforms are aimed at modernizing the Spanish productive structure and the Administration, renewing the regulatory framework to increase productivity and potential GDP, achieving more sustainable long-term growth, reducing job insecurity and strengthening the Welfare State and social cohesion. Table 5.2 shows the main advances in the structural reforms corresponding to Spain’s Recovery Plan, which are directly linked to the above-mentioned public investments.
Table 5.2 Main advances in the Recovery Plan reforms (November 2023). Source: Recovery, Transformation, and Resilience Plan, Government of Spain (2023).
|
Business climate |
Bankruptcy Reform |
|
“Create and Grow” Law |
|
|
Startups Law |
|
|
Securities Market Law Reform |
|
|
Reform of the Entrepreneur Support Law |
|
|
Improvement of the antitrust framework |
|
|
Digitalization and innovation |
5G Cybersecurity Law |
|
General Telecommunications Law |
|
|
Audiovisual Law |
|
|
National Security Scheme |
|
|
Spanish AI Supervisory Agency |
|
|
AI Sandbox |
|
|
Science Law |
|
|
Green transition |
Climate Change Law |
|
Waste and Contaminated Soil Law |
|
|
Energy efficiency in housing |
|
|
Spanish Circular Economy Strategy |
|
|
Reform of the Water Law |
|
|
Low Emission Zones |
|
|
Employment and social protection |
Labor market reform |
|
Rider Act |
|
|
Law for Reduction of Temporary Employment |
|
|
Employment Law |
|
|
Remote Work Law |
|
|
Regulation of hiring incentives |
|
|
Pension System Reform |
|
|
Minimum income scheme |
|
|
Culture and education |
Education Law |
|
Vocational Training Law |
|
|
Statute of the Artist |
|
|
Sports Law |
|
|
University System Law |
|
|
Spain Audiovisual Hub of Europe |
|
|
Intellectual Property Registry Regulation |
|
|
Modernization of public administrations |
National Public Procurement Strategy |
|
Civil Service Reform |
|
|
Digitalization of the Justice System |
|
|
Strengthening inter-regional cooperation |
|
|
Reform of Local Administrative Regimes |
The economic impact of this investment program on Spanish economic growth is noteworthy. As is well known, an increase in public investment can positively affect economic growth for two reasons. First, it has a positive short-term impact on aggregate demand, increasing private investment, employment, and household consumption. Second, public investment also has a supply-side effect, boosting—as mentioned above—the economy’s capital stock and, consequently, its efficiency and productive capacity in the medium and long term.
Empirical literature consistently highlights that the value of fiscal multipliers can significantly fluctuate depending on a variety of factors, such as the phase of the economic cycle, the level of public debt, the exchange rate regime and the degree of economic openness (Fatas and Mihov 2009; Gechert and Rannenberg 2014). However, there is a strong consensus that public investment’s short- and medium-term multipliers, particularly in downturns, are notably high and almost always greater than 1 (IMF 2014; Auerbach and Gorodnichenko 2012).
This multiplier effect has been empirically tested in the case of the Spanish economy over the last three years. The Ministry of Economy estimates that over 2021–2023, the impact of the public investment program on GDP was 0.3% in 2021, 1.2% in 2022, and 1.4% in 2023, as we can see in Figure 5.9. These estimates are in line with the analysis of the Bank of Spain (Fernández Cerezo et al. 2023). In fact, economic authorities estimate that the economy recovered its pre-COVID-19 GDP level in 2022, two years ahead of schedule, thanks to the impact of the Recovery Plan. And they further expect the positive impact of public investment on GDP to remain high for the next three years, with an average annual impact of 1.2 % until 2026.
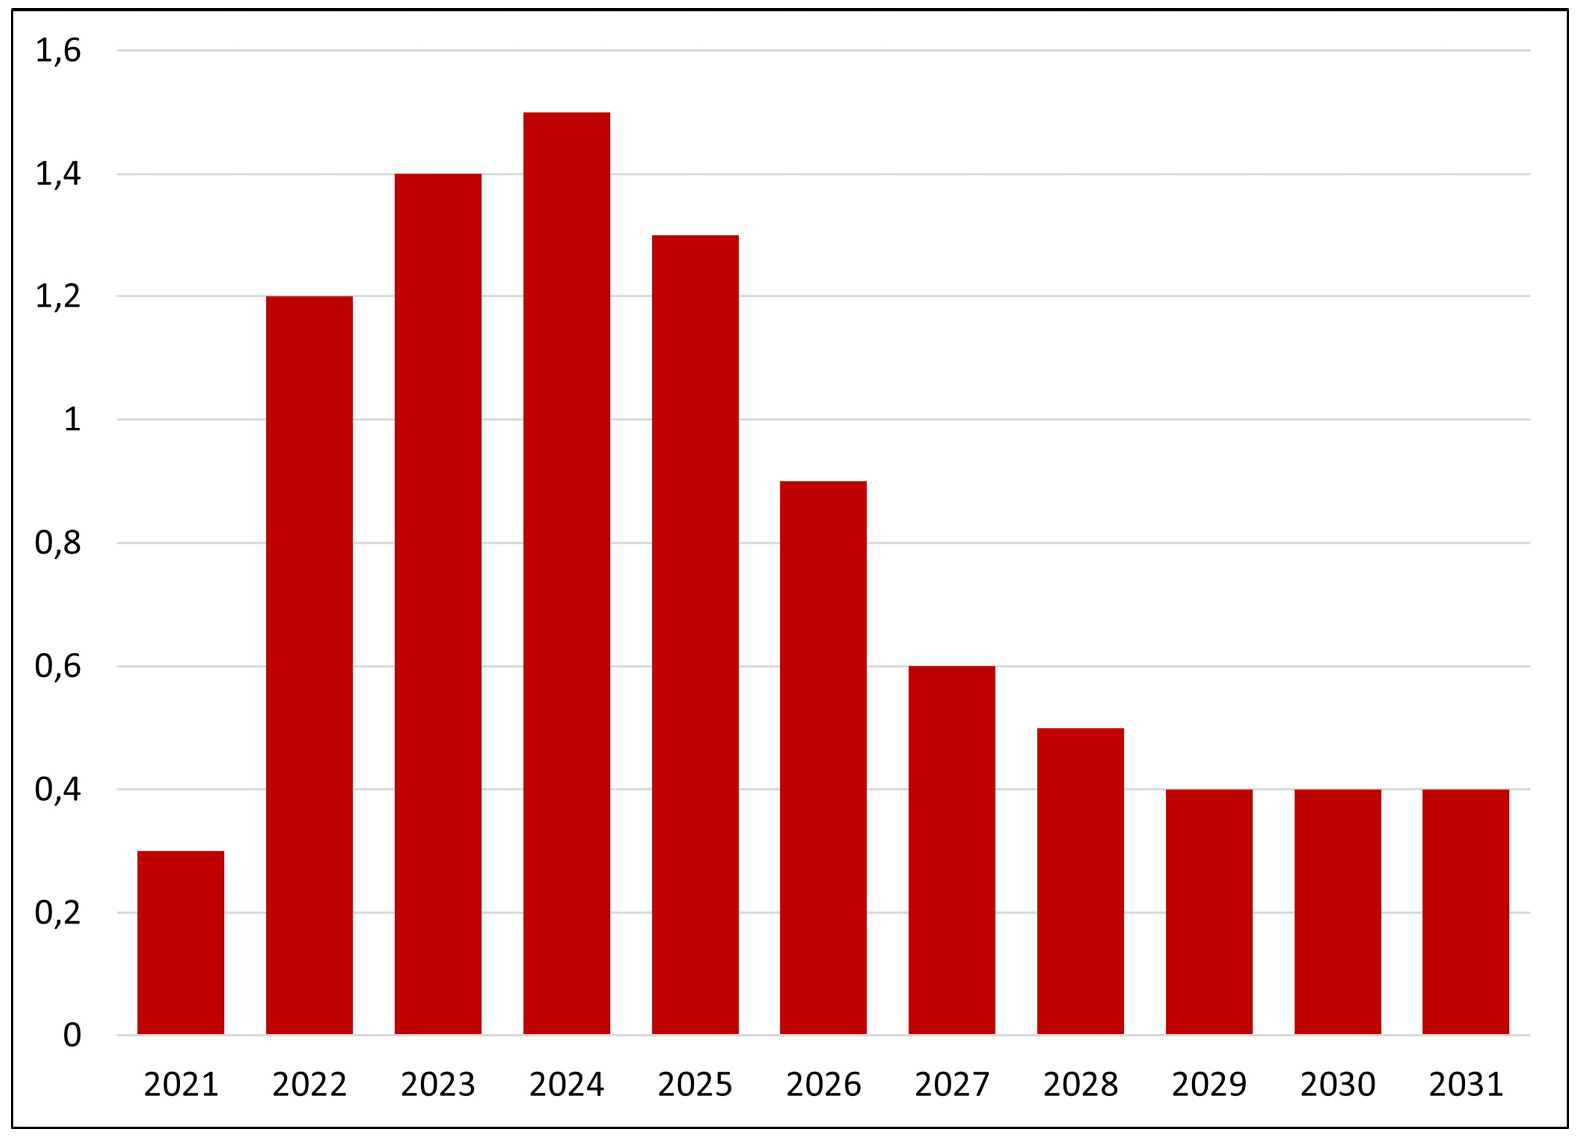
Fig. 5.9 Impact on GDP of public investments within the Recovery, Transformation, and Resilience Plan (percentage points of GDP over inertial path). Source: Ministry of Economy, Spain (2023).
The contribution of each type of investment to economic growth is certainly variable. As shown in Figure 5.10, sub-programs related to sustainable infrastructure, urban and rural development, and digitalization lead the impact of investment on GDP, concentrating 66% of this impact. Within these sub-programs, projects for the deployment of high-speed networks and other railway infrastructures, the MOVES plan (for electric mobility), and investment in broadband networks (digitalization) are particularly important.
These investments are followed by the science and health sub-program, which accounts for 11% of the total impact of the plan to date. Within this sub-program, investments related to health infrastructures, research projects in personalized precision medicine and the development of the Artificial Intelligence strategy stand out. In addition, the important process of modernization and digitization of public administrations contributes more than 7% of the total impact of investments on GDP.
Finally, investments directly related to the energy transition sub-program, as well as the launching of a new vocational training system, are of particular importance.
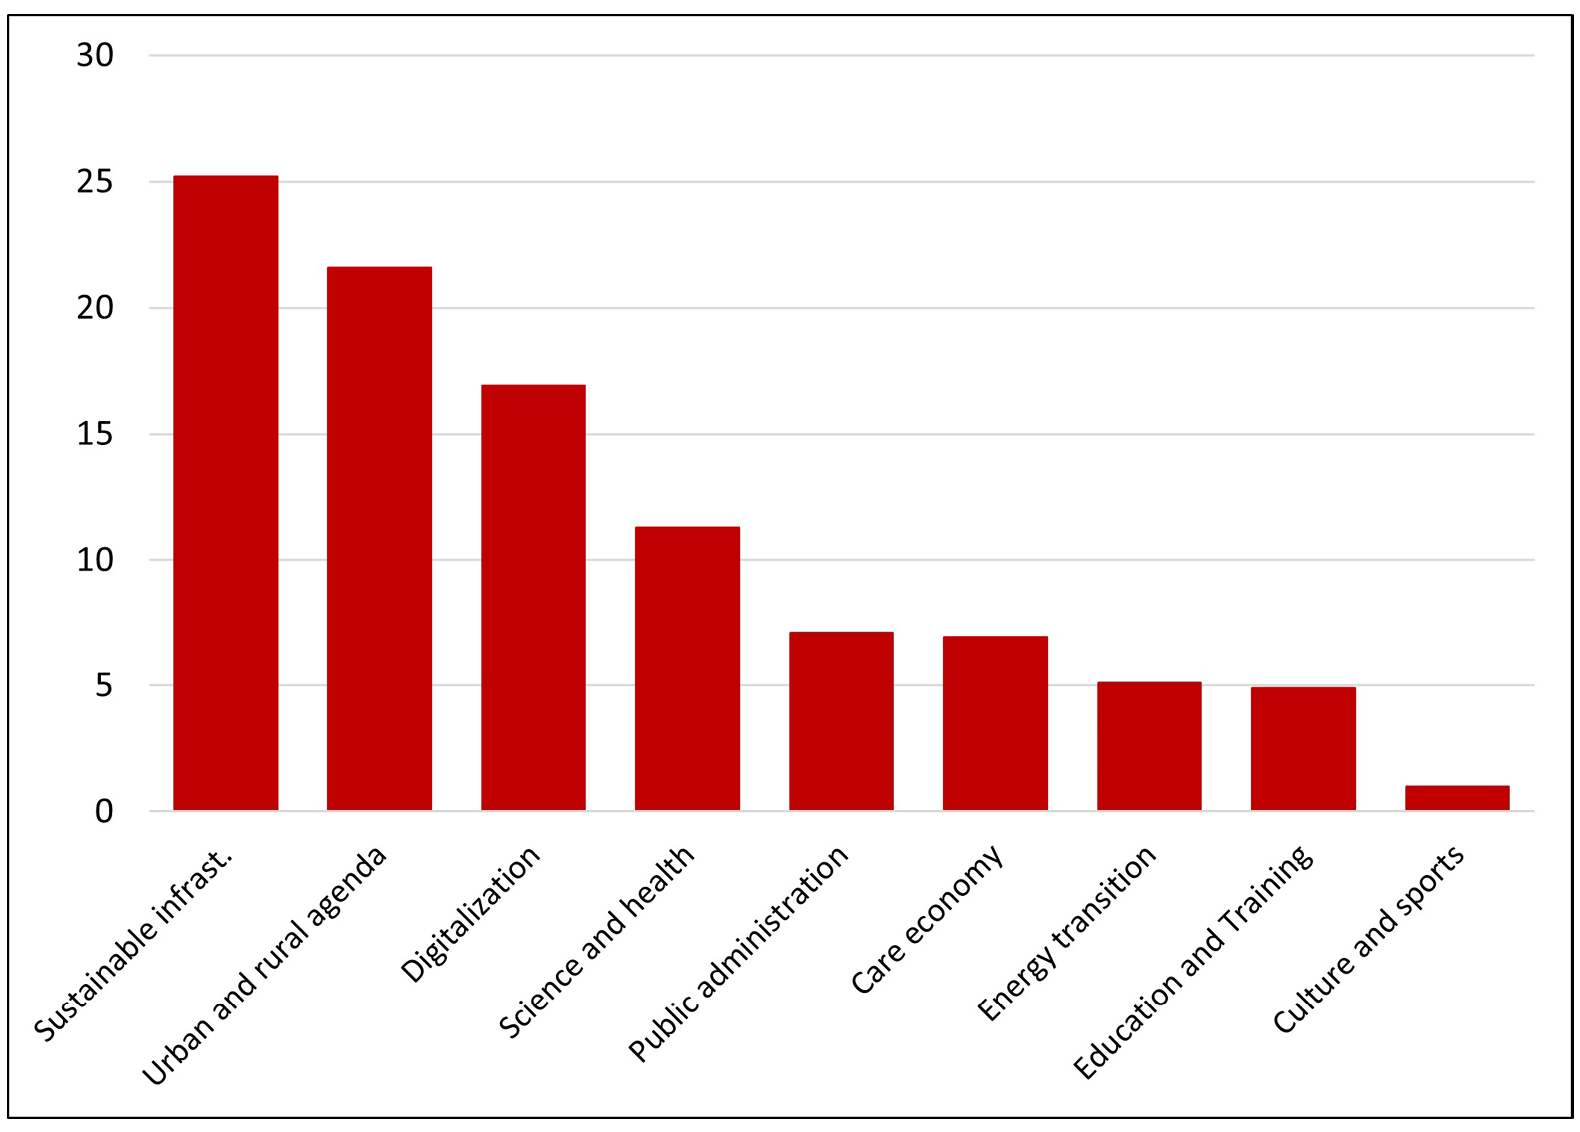
Fig. 5.10 Contribution of public investments to total investment impact on GDP (% of total investment impact, 2021–2023). Source: Ministry of Economy, Spain (2023).
5.5 Conclusions
The challenges ahead for the European Union are enormous, and member states need to take firm steps to ensure the green transition, the digitalization of the economy and the strengthening of industry while guaranteeing social cohesion. To meet the European Commission’s own investment targets, the European Central Bank’s Fiscal Policies Division recently estimated (Bouabdallah et al. 2024) that EU countries need to leverage additional public investment above what is already being implemented under the Next Generation EU funds. Specifically, they estimate the need to mobilize more than €900 billion for the whole of the EU during the period 2025–2031. Assuming that Spain takes up 10% of this investment (equivalent to the share of its GDP in the Eurozone), this would imply the need for an additional increase of almost €13 billion per year for the period 2025–2031, i.e. an increase of close to 1% of Spanish GDP in net public investment in the coming years (Fig. 5.11). The recent Draghi report on European competitiveness sets even more ambitious investment targets.
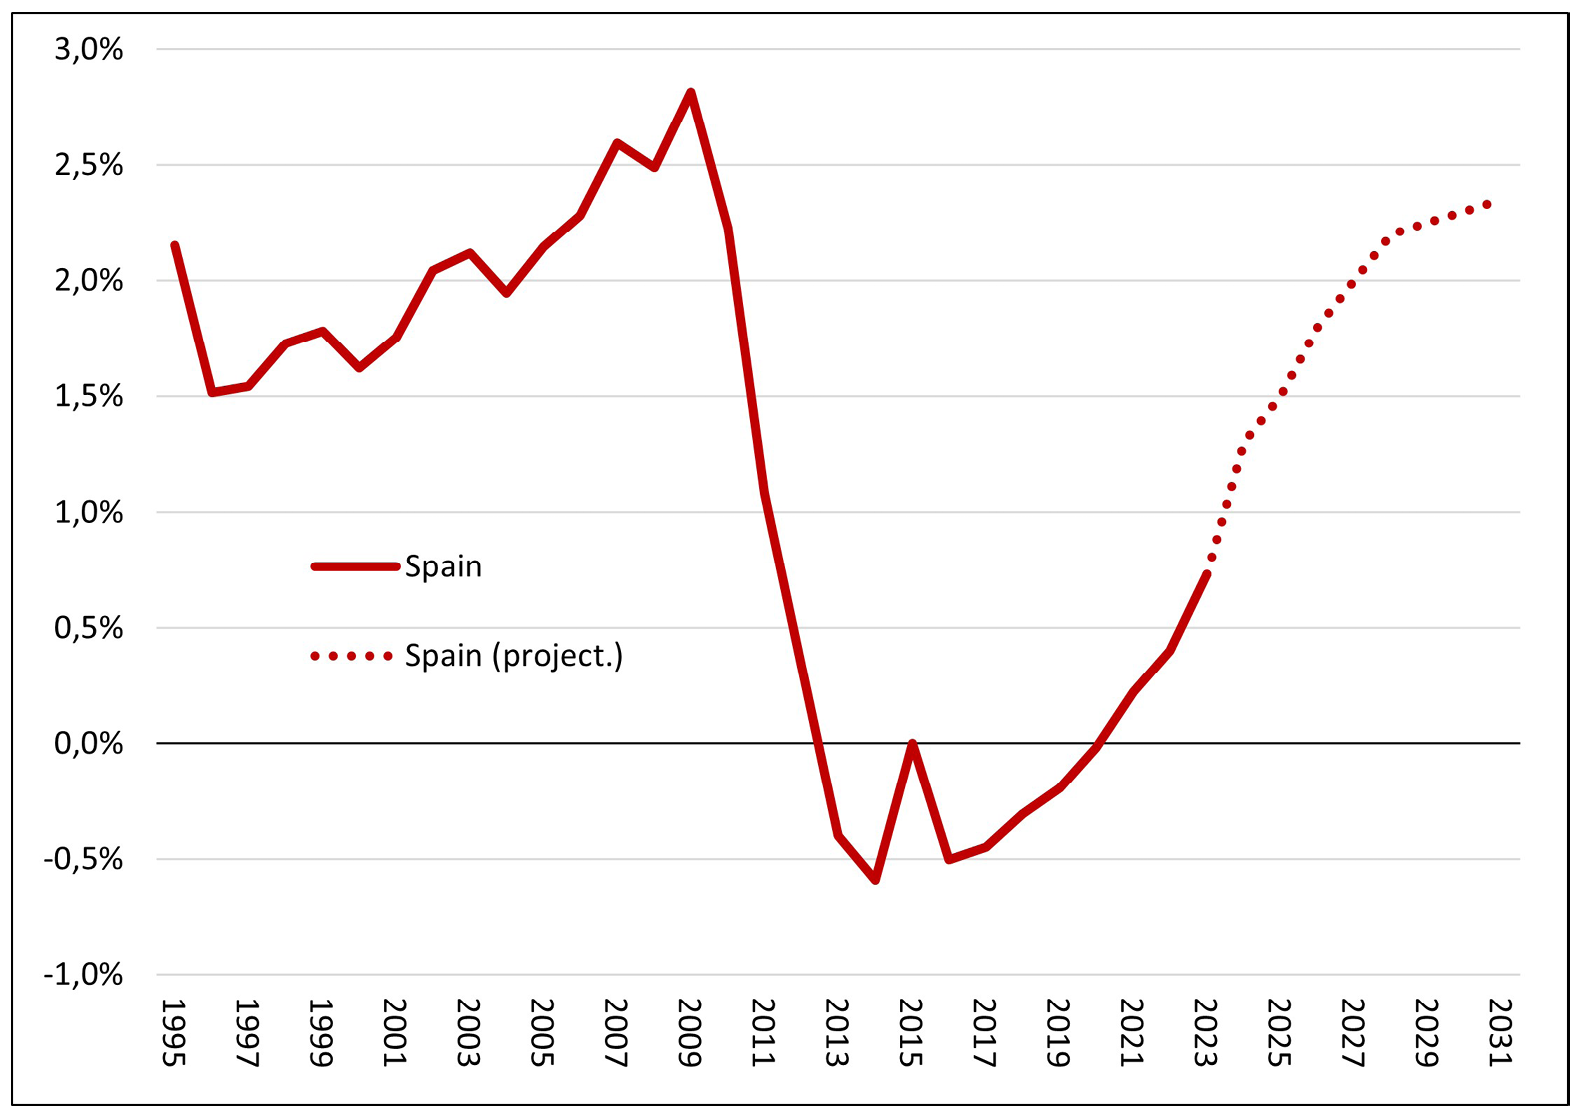
Fig. 5.11 Net public investment (as a percentage of GDP). Source: AMECO and authors’ calculations. Note: Projection to meet the goals established by the European Commission, according to estimates developed by Bouabdallah et al. (2024).
Like the rest of its European partners, the critical debate facing the Spanish economy is evident: to what extent can these crucial investment needs be reconciled with the new fiscal rules?
Over the last few decades, numerous voices—from academia, governments and the business world—have questioned the Stability and Growth Pact due to its fiscal rigidity, its pro-cyclical nature and its inability to cope with recessions and economic crises, as well as its continuous contractionary effect on public investment. In March 2020, the European Commission activated its “general escape clause”, which allowed the pandemic to be dealt with swiftly and flexibly. It also contributed to highlighting the need to reform the fiscal rules. This reform took place in the first half of 2024 and was approved by the European Parliament in April this year.
However, the new fiscal rules, despite being made more flexible in some aspects, still maintain a general orientation marked by the need to meet strict fiscal consolidation thresholds and have not incorporated any kind of Golden Rule to protect public investment. Therefore, there is a relevant threat of short-circuiting the recovery process of public investment in Spain and other countries, depending on how these new fiscal rules are implemented in the following year.
Last June, the European Commission opened the excessive deficit procedure for France, Italy, and five other EU countries. Spain has not been included in this procedure. However, the new fiscal rules establish that countries will be obliged to reduce their structural deficit by 0.4% per year, not only until the observed deficit reaches 3%, but also until the structural deficit reaches 1.5% to create a fiscal buffer for times of adversity. This implies that fiscal consolidation will have to continue over the coming years, also in Spain.
How should this fiscal consolidation be understood? The Directorate-General for Economic and Financial Affairs of the European Commission recently published “The Implications of Public Investment for Debt Sustainability” (Motyovszki et al. 2024: 1), which states that “without offsetting fiscal adjustments via the primary balance, a temporary increase in public investment implies a lasting increase in the debt-to-GDP ratio […] In other words, debt stabilization would require subsequently higher primary surpluses, implying that public investments must eventually be paid for by fiscal adjustments”.
In fact, according to Darvas et al. (2024), fiscal adjustments required under the new Stability and Growth Pact would be substantial for Spain: to achieve the intended structural primary balance objectives, the average annual fiscal adjustment would have to rise to 0.8% of GDP (in the case of a four-year adjustment period) and to 0.5% (in the case of a seven-year adjustment period).
The risk that this approach poses for public investment in countries like Spain is stark: the idea that a lasting increase in public investment is only feasible through continuous primary surpluses (probably sustained at the expense of public services) could undermine the current recovery of Spanish gross fixed capital formation, which has already been dragged down for a whole decade, as we have seen.
Moreover, this approach does not fit with recent empirical evidence from countries like Spain. We have already seen how fiscal consolidation in Spain was carried out during the Great Recession at the expense of public investment, which acted as an “adjustment variable” suffering massive cuttings. Paradoxically, this approach not only hindered effective fiscal policy but also damaged the very sustainability of public finances that it was intended to ensure, due to its contractionary effects on the economy (Labat-Moles and Summa 2023; Di Bucchianico 2019; Rosnick and Weibstrot 2015). However, over the last three years, Spain has adopted a very different approach to reducing deficit and debt over GDP ratios. Between 2020 and 2023, Spain has reduced them faster than was achieved in the 2010–2016 austerity period (Fig. 5.12). This has been possible through various tax reforms that have improved public revenues and, above all, due to economic growth, which has allowed the debt and deficit to be reabsorbed.
Obviously, the continuity of this growth is not independent of the fiscal policy pursued. As shown in Uxó et al. (2024), it is possible to design a fiscal policy strategy for Spain based on an expansion of public investment and an increase in public revenues (currently below the European average in the case of Spain).
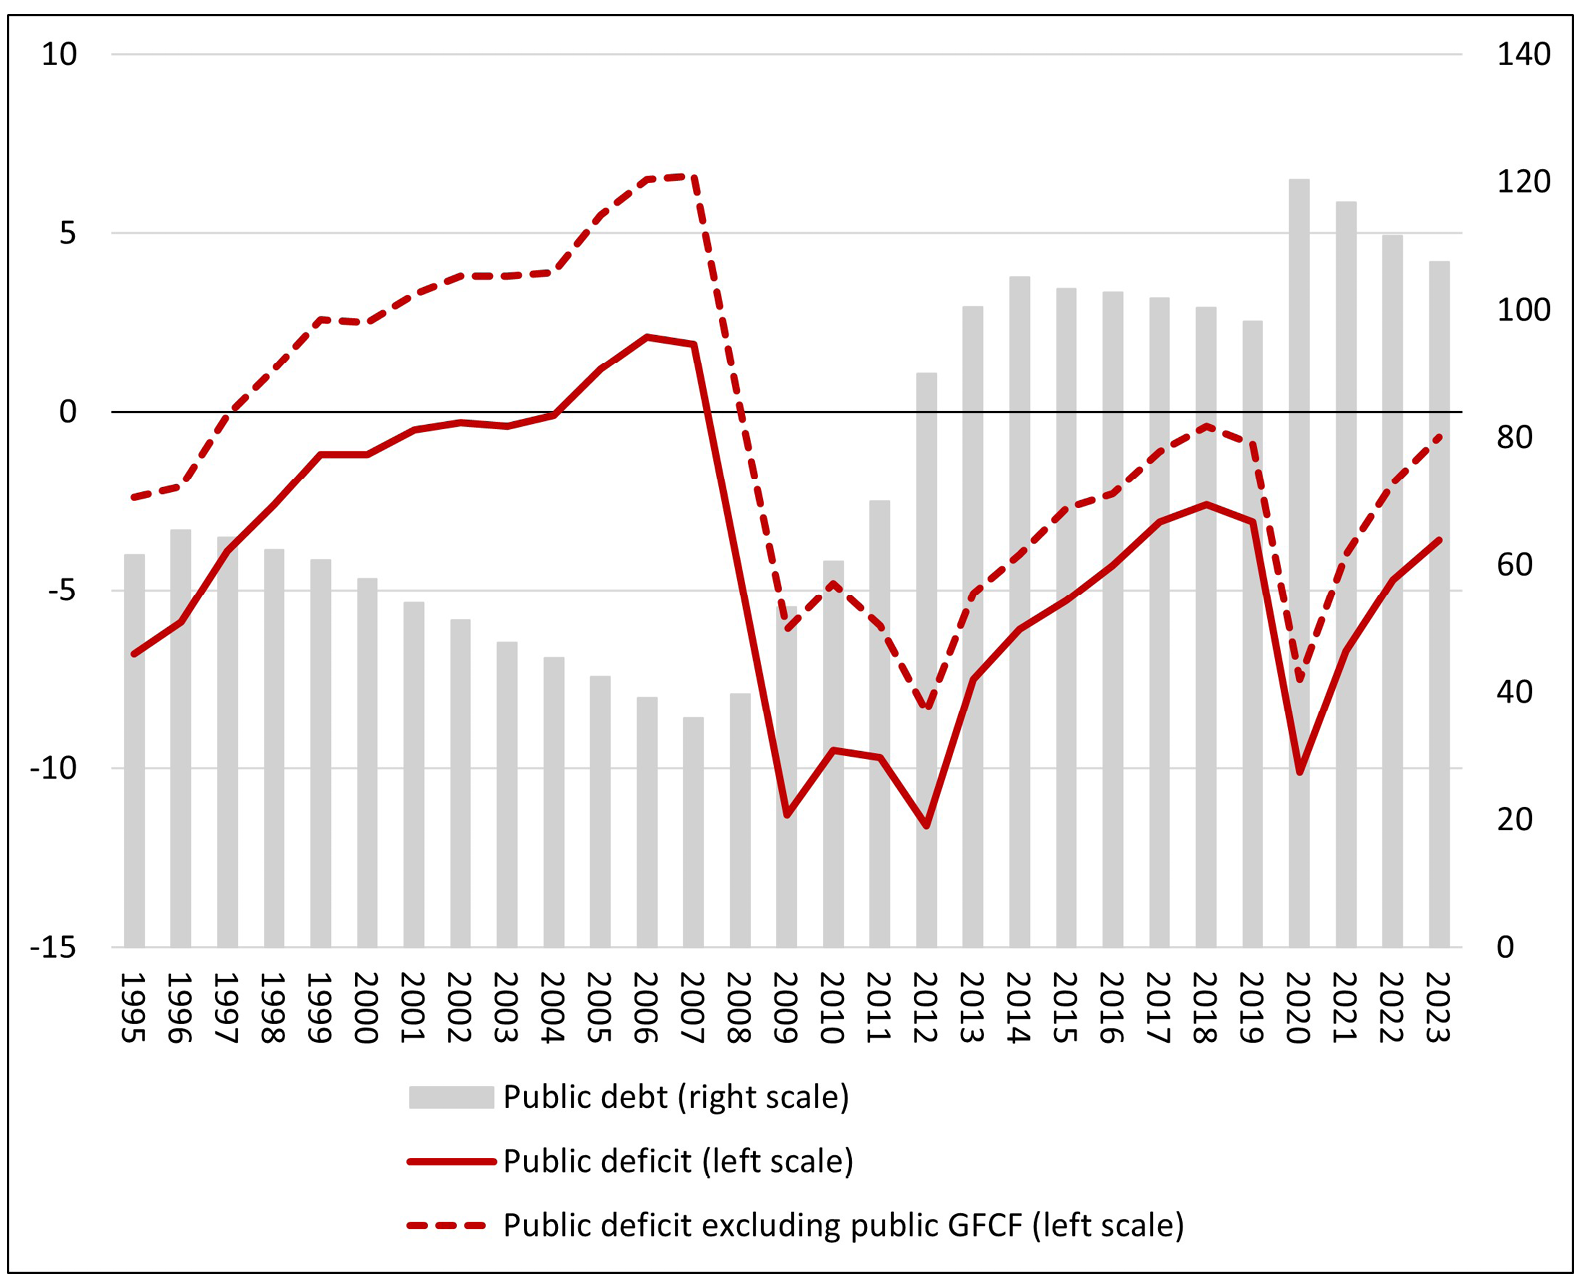
Fig. 5.12 Public debt and public deficit (Spain, % of GDP). Source: AMECO.
|
Online resources for Figs. 5.1–5.12 are available at |
|

This partially balanced budget expansion would allow the structural challenges of the Spanish economy to be faced, mobilizing more investment and reducing the unemployment rate while continuing to consolidate the public debt to GDP ratio. On the contrary, fiscal policies explicitly designed to reduce public deficit through freezing public expenditure will probably prove counterproductive.
Furthermore, and as we can see in Figure 5.12, the Spanish public deficit, excluding public gross fixed capital formation, is already nearly zero. Returning to the logic of public investment acting as the “adjustment variable” of fiscal consolidation and reducing this investment to ensure sustainable primary surpluses would be a policy mistake. It would reduce medium- and long-term economic growth potential, lower aggregate demand, and ultimately undermine fiscal sustainability itself.
References
Auerbach, A., and Y. Gorodnichenko (2012) “Fiscal Multipliers in Recession and Expansion”, NBER Working Paper 17447, National Bureau of Economic Research, Cambridge, Massachusetts.
Bouabdallah, O. Dorrucci, E. Hoendervangers, L. and Nerlich, C. (2024) “Mind the Gap: Europe’s Strategic Investment Needs and How to Support Them”, The ECB Blog, 27 June, https://www.ecb.europa.eu/press/blog/date/2024/html/ecb.blog240627~2e939aa430.en.html
Consejo Económico y Social (2020) La inversión pública en España: situación actual y prioridades estratégicas, Colección Informes, Número 01/2020, Consejo Económico y Social.
Darvas, Z., L. Welslau, and J. Zettelmeyer (2024) “Incorporating the Impact of Social Investments and Reforms in the EU’s New Fiscal Framework”, Bruegel Working Paper 07/2024, https://www.bruegel.org/working-paper/incorporating-impact-social-investments-and-reforms-european-unions-new-fiscal
Di Bucchianico, S., (2019) “A Bit of Keynesian Debt-to-GDP Arithmetic for Deficit-capped Countries”, Bulletin of Political Economy 13(1): 55–83.
Fatas, A., and Mihov, I. (2009) “Why Fiscal Stimulus Is Likely to Work”, International Finance 12(1): 57–73
Fernández-Cerezo, A., E. Moral-Benito, and J. Quintana (2023) “The Recovery, Transformation and Resilience Plan and its Macroeconomic Impact from a Sectoral Standpoint”, Economic Bulletin, Bank of Spain, 2023/Q1, https://repositorio.bde.es/bitstream/123456789/29539/1/be2301-art12e.pdf
Gechert, S., and A. Rannenberg (2018) “Which Fiscal Multipliers Are Regime‐Dependent? A Meta‐Regression Analysis”, Journal of Economic Surveys 32(4): 1160–1182. https://doi.org/10.1111/joes.12241
Fundación BBVA-IVIE (2019) El stock de capital en España y sus comunidades autónomas. Evolución de la edad media de las inversiones y envejecimiento del capital, Fundación BBVA-IVIE.
Gobierno de España (2023) Plan de Recuperación, Transformación y Resiliencia. IV Informe de Ejecución del Plan de Recuperación, Gobierno de España, December.
International Monetary Fund (2014) “Is It Time for an Infrastructure Push? The Macroeconomic Effects of Public Investment”, in World Economic Outlook, October 2014: Legacies, Clouds, Uncertainties. Washington, DC: International Monetary Fund, pp. 75–112.
Labat-Moles, H., and R. Summa (2023) “A Supermultiplier Demand-led Growth Accounting Analysis Applied to the Spanish Economy (1998–2019)”, European Journal of Economics and Economic Policies: Intervention 21(1): 42–72, https://doi.org/10.4337/ejeep.2023.0115
Motyovszki, G., P. Pfeiffer, and J. Veld (2024) “The Implications of Public Investment for Debt Sustainability”, Discussion Paper 204 (June), Directorate-General for Economic and Financial Affairs, European Commission, https://economy-finance.ec.europa.eu/system/files/2024-06/dp204_en.pdf
Pérez, F., and J. F. de Guevara (eds) (2024) El stock de capital en España y sus Comunidades Autónomas 1995-2023. Cambios recientes en la composición de la inversión y en las respuestas a la crisis, Documentos de Trabajo 1-2024, Fundación BBVA.
Rosnick, D., and M. Weibstrot (2015) “Has Austerity Worked in Spain?”, Center for Economic and Policy Research, https://cepr.net/documents/Spain-2015-12.pdf
Uxó, J., E. Febrero, I. Ayala, and P. Villanueva (2024) “Debt Sustainability and Policy Targets: Full Employment or Structural Balance? A Simulation for the Spanish Economy”, Structural Change and Economic Dynamics, 69: 475–487, https://doi.org/10.1016/j.strueco.2024.03.005