List of figures and tables
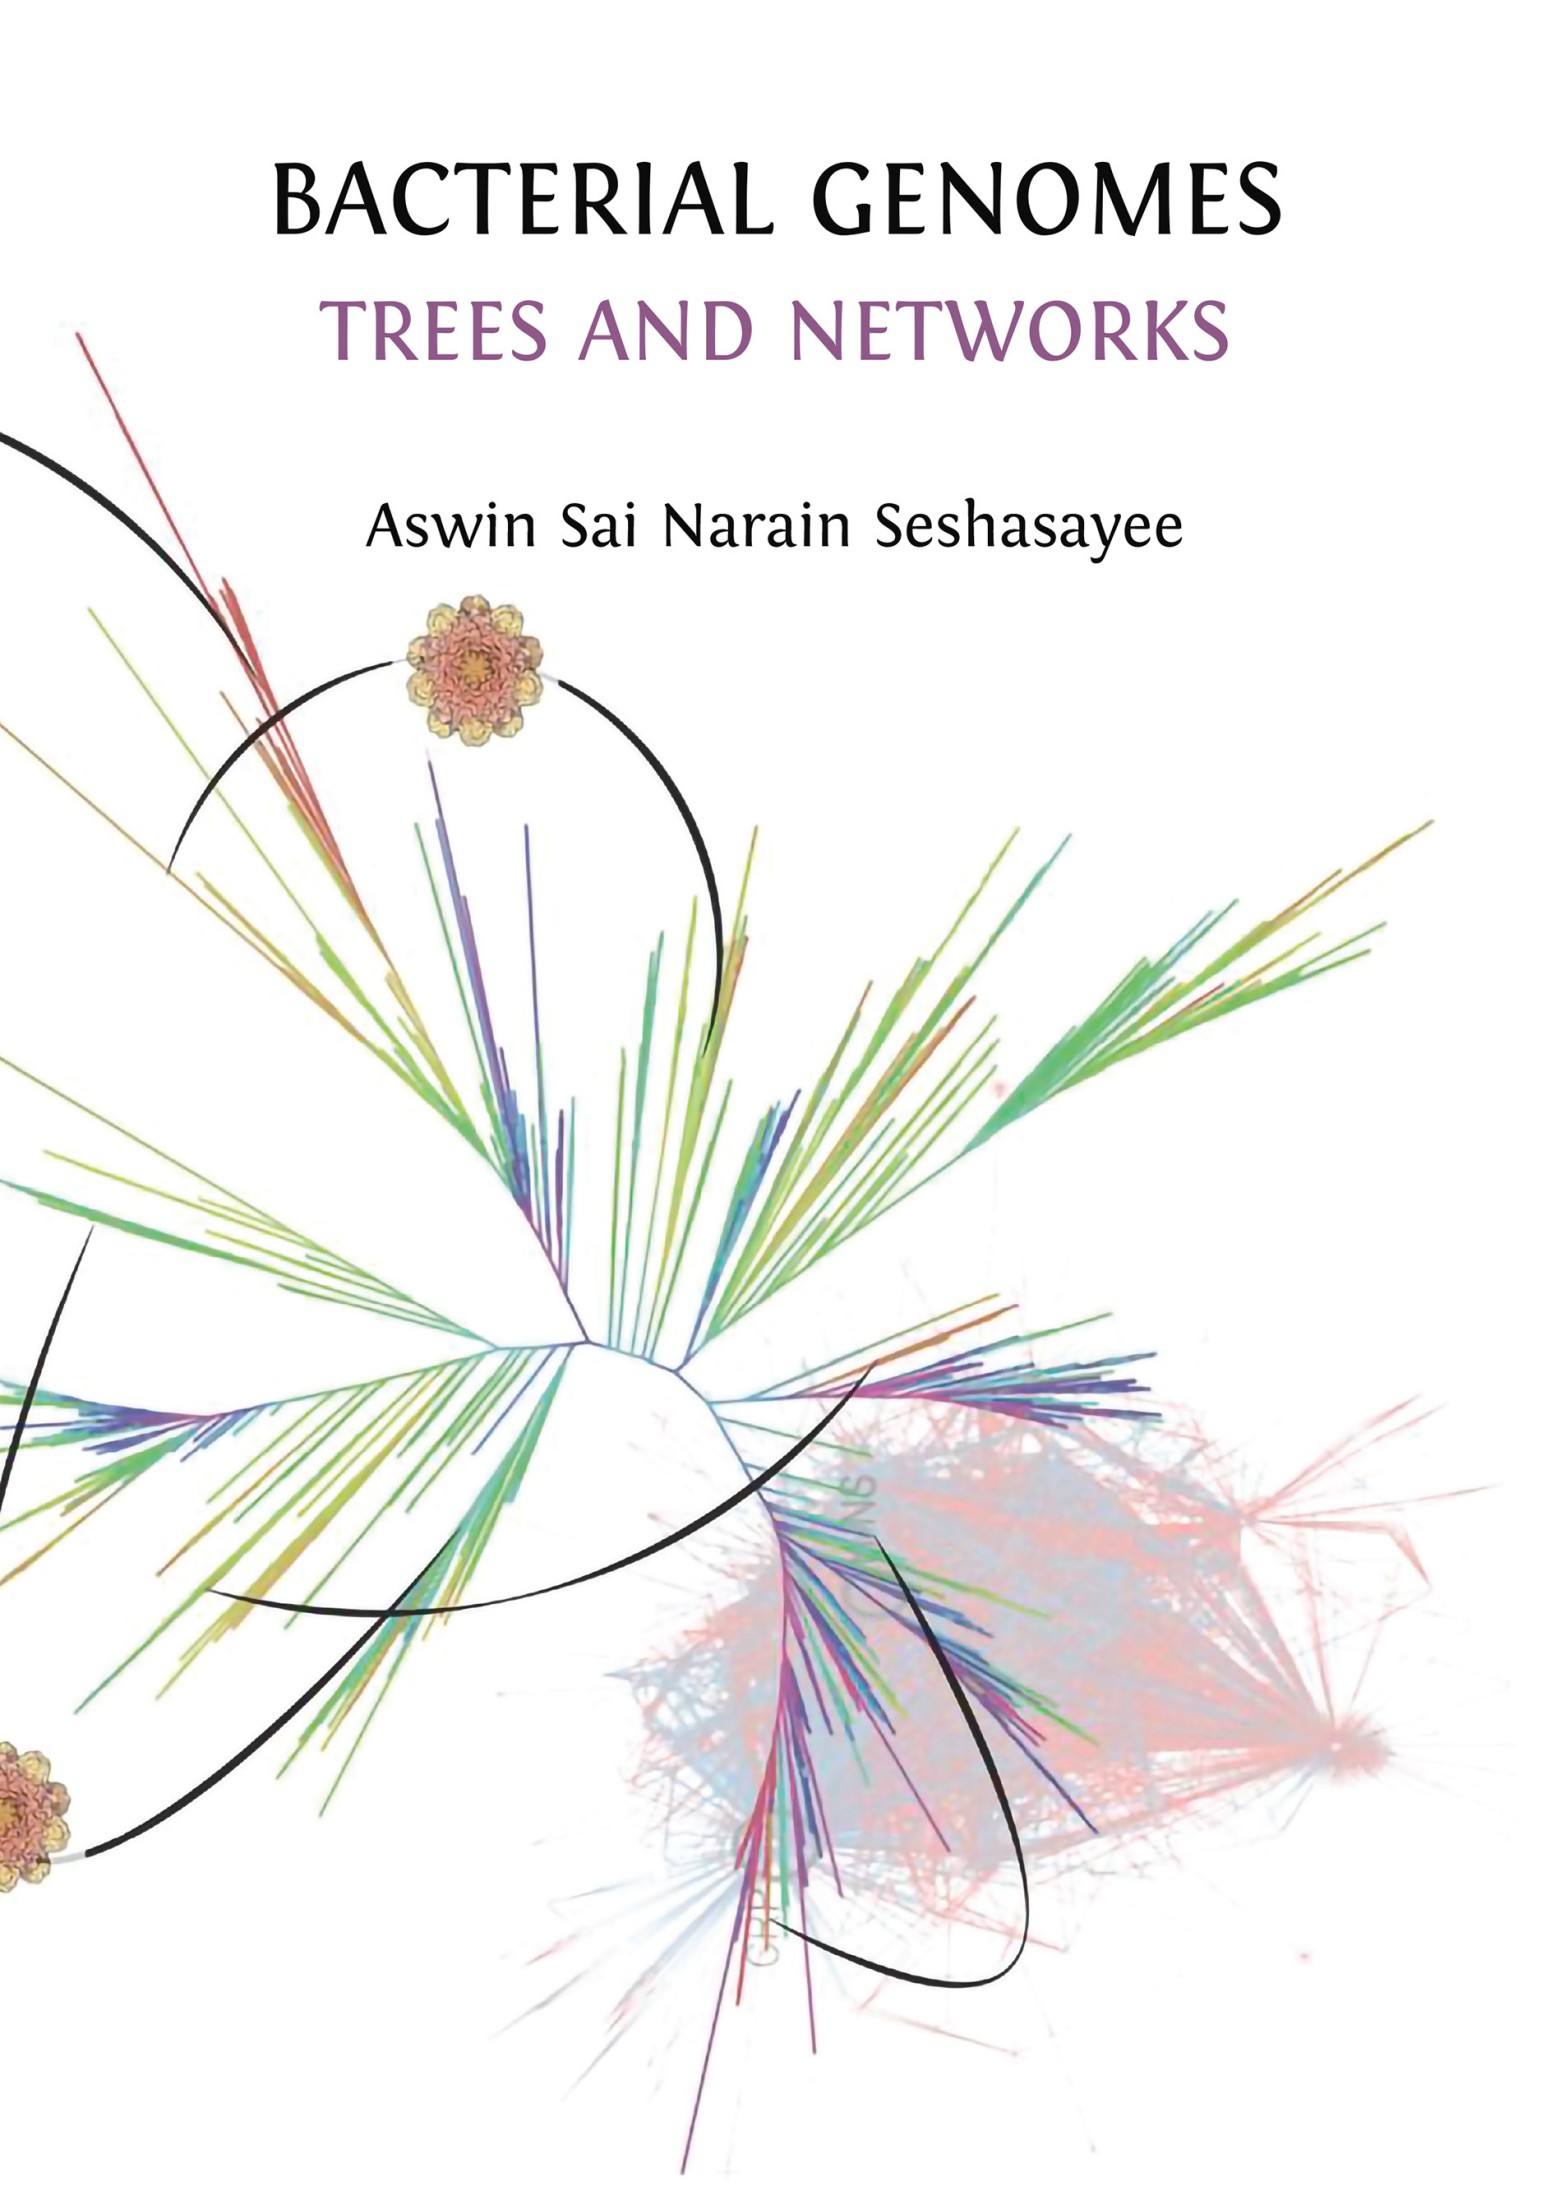
A 16S rRNA-based unrooted phylogenetic tree of bacteria and archaea, coloured by inferences of genome size, approximated by maximum-likelihood ancestral state reconstructions of the number of KEGG orthologous groups. Black, curved lines represent horizontal gene transfers, some involving bacteriophages. Note: this schematic illustration ignores the narrow target specificity of bacteriophages to avoid clutter. Bottom left (background): image of the transcriptional regulatory network of E. coli (prepared using Cytoscape by Ganesh Muthu). Phylogenetic tree, and the data and inferences used to colour it, by Prerana Sudarshan, and rendered using FigTree. Image of the bacteriophage (phiX174) from the Protein Data Bank ‘Molecule of the Month’ series, rendered by David Goodsell, CC BY. Illustration assembled by Ashitha Arun, Inder Raj Singh and Madhumitha K.
A tree of life. A tripartite tree of life from iTOL (https://itol.embl.de) showing bacteria, archaea, and eukarya. Latest iTol paper: I. Letunic and P. Bork, ‘Interactive Tree of Life (iTOL) v6: recent updates to the phylogenetic tree display and annotation tool’, Nucleic Acids Research 52 (2024), W78–W82.
Comparison of H. influenzae and M. genitalium genomes. (A) This figure shows linear representations of the H. influenzae and M. genitalium genomes, with lines marking genes sharing homology between the two genomes. On the right is a zoom-in of a small region of the two genomes. Figure generated using the stand-alone Artemis Comparison Tool (http://sanger-pathogens.github.io/Artemis/ACT/) by Ganesh Muthu. (B) This figure shows the percentage of genes from different gene functions, as defined by the KEGG database, that are conserved in the genomes of H. influenzae and M. genitalium. Note that most genes involved in translation or protein synthesis are present in both genomes. In general, genes involved in genetic information processing are more conserved than those involved in metabolism. Figure generated based on data available in the KEGG database, by Nitish Malhotra.
Gene functions in the minimal cellular genome. This table lists the set of gene functions and some example gene names present in the hypothetical/theoretical minimal genome for cellular life. Based on the work described in Gil et al. (2004), which presents a full, detailed table.
Metabolic complementarity between endosymbiont genomes. This figure shows that the metabolic production in Baumannia is focused on vitamins and a couple of amino acids, whereas Sulcia is an amino acid producing machine. Originally published as Figure 4 in D. Wu, S.C. Daugherty, S.E. Van Aken, G.H. Pai, K.L. Watkins, H. Khouri, L.J. Tallon, J.M. Zaborsky, H.E. Dunbar, P.L. Tran, N.A. Moran, and J.A. Eisen, ‘Metabolic complementarity and genomics of the dual bacterial symbiosis of sharpshooters’, PLoS Biology 4 (2006), e188, Creative Commons Attribution License.
c-value paradox. Figure showing the relationship between gene count and genome size for different categories of organisms on the log10 scale. Note that the variation in gene count fails to match variation in genome size for higher eukaryotes such as plants and animals. Figure produced by Ganesh Muthu using data from NCBI Genomes database.
Variation in protein sequences. This figure shows a sequence alignment of fragments of (A) the catalytic subunit of RNA polymerase (RPOB), an essential protein, and (B) FNR, a non-essential regulator of gene expression (see chapter 5). Note the higher number of residues conserved across the various examples of the catalytic subunit of the RNA polymerase than in FNR. Figure produced using Uniprot (https://www.uniprot.org) and OrthoDB (https://www.orthodb.org).
Repetitive DNA in eukaryotic genome expansion. This figure shows the correlation between genome size and its repetitive DNA content for fishes called mudminnows. Originally published as Figure 3B in R. Lehmann, A. Kovařík, K. Ocalewicz, L. Kirtiklis, A. Zuccolo, J.N. Tegner, J. Wanzenböck, L. Bernatchez, D.K. Lamatsch, and R. Symonová, ‘DNA Transposon Expansion is Associated with Genome Size Increase in Mudminnows’, Genome Biology and Evolution 13 (2021), evab228, CC BY 4.0.
Trees showing bacteria undergoing genome reduction. This figure shows extracts from the iTOL Tree of Life (https://itol.embl.de), showing (A) the E. coli – Buchnera branch, (B) the Rhizobium / /Bradyrhizobium – Rickettsia branch, and (C) the Bacteroidetes/Porphorymonas – Chlamydia branch. Latest iTol paper: I. Letunic and P. Bork, ‘Interactive Tree of Life (iTOL) v6: recent updates to the phylogenetic tree display and annotation tool’, Nucleic Acids Research 52 (2024), W78–W82.
Pseudogenes in M. leprae. This figure shows a small fragment of the M. leprae genome (top) and the corresponding segment of M. tuberculosis genome (bottom). Pseudogenes in M. leprae are shown in cyan. There are no pseudogenes for this region in M. tuberculosis. Figure produced by Ganesh Muthu using the Artemis Comparison Tool (https://www.sanger.ac.uk/tool/artemis-comparison-tool-act/).
Gene loss in Prochlorococcus. This figure shows the number of genes gained (black, positive integers) and lost (red, negative integers) across different branches in the Prochlorococcus-Synechococcus tree. Originally published as Figure 2 in Z. Sun and J.L. Blanchard, ‘Strong genome-wide selection early in the evolution of Prochlorococcus resulted in a reduced genome through the loss of a large number of small effect genes’, PLoS One 9 (2014), e88837, under Creative Commons Attribution License.
Gene gain and loss in E. coli. Figure shows a tree showing the relationships between different E. coli and Shigella (which is considered as part of E. coli). Each branch is labelled with the number of genes gained (red) and the number lost (black) along the branch. The numbers on top of each branch represent the number of genes gained/lost, whereas the numbers at the bottom are the number of inferred gene gain/loss events. A single event can cause the gain or loss of multiple genes. The pie charts show the functions of genes gained in each branch. For a colour key, refer to Supplementary Table 5 in the original source cited below. Originally published as Figure 7 in M. Touchon, C. Hoede, O. Tenaillon, V. Barbe, S. Baeriswyl, et al., ‘Organised genome dynamics in the Escherichia coli species results in highly diverse adaptive paths’, PLoS Genetics 5 (2009), e1000344, under Creative Commons Attribution License.
Horizontal gene transfer in Streptomyces. This figure shows the rate of horizontal gene transfer in Streptomyces as (A) a simplified phylogenetic tree of the species, showing rates of transfers within and to a lesser extent across clades, and (B) as a scatter plot showing the rate of horizontal gene transfer (y-axis) against the phylogenetic relatedness between two Streptomyces genomes (x-axis). Originally published as Figure 3 in B.R. McDonald and C. Currie, ‘Lateral gene transfer dynamics in the ancient bacterial genus Streptomyces’, mBio 8 (2017), e00644–17, CC BY 4.0.
Within-host horizontal gene transfer. This figure shows that the rate of horizontal gene transfer between members of bacterial communities within the same human host is significantly greater than that across hosts. Originally published as Figure 2A in A.G. Kent, A.C. Vill, Q. Shi, M.J. Satlin, and I.L. Brito, ‘Widespread transfer of mobile antibiotic resistance genes within individual gut microbiomes revealed through bacterial Hi-C’, Nature Communications 11 (2020), 4379, CC BY 4.0.
Cholera toxin in V. cholerae. This figure represents a short fragment of the genome of V. cholerae ElTor. The fragment includes the cholera toxin genes (ctxA and ctxB, highlighted in cyan). The track at the top gives shows the local G+C content, with the horizontal line marking the genomic average (~47%). Note the extraordinarily low G+C content of ctxA and ctxB compared with the genomic average.
Horizontal gene transfer of photosynthesis genes. This figure shows gene trees for two genes involved in photosynthesis, (A) psbA and (B) psbD, in Prochlorococcus and Synechococcus. These trees show the close relationship between these genes found in bacteriophages and those in the bacteria. These suggest transfer of these genes from the bacteria to the bacteriophage. This can potentially provoke further transfers to other bacteria through the bacteriophage. Originally published as Figures 1 and 2 in M.B. Sullivan, D. Lindell, J.A. Lee, L.R. Thompson, J.P. Bielawski, and S.W. Chisholm, ‘Prevalence and evolution of core Photosystem II genes in marine cyanobacterial viruses and their hosts’, PLoS Biology 4 (2006), e234, under Creative Commons Attribution License.
Dominance of horizontal gene transfer in bacterial gene family expansions. This figure shows that a majority of genes representing protein family expansions in bacterial genomes were gained by horizontal gene transfer. Originally published as Figure 2 in T.J. Treangen and E.P.C. Rocha, ‘Horizontal transfer, not duplication, drives the expansion of protein families in prokaryotes’, PLoS Genetics 7 (2011), e1001284, under Creative Commons Attribution License.
Antibiotic resistance mutations in Mycobacterium tuberculosis. This figure shows correlations, as measured by mutual information, between gene sequence variants and resistance to antibiotics in M. tuberculosis. High vertical bars indicate high association between the two. One gene, which shows the highest correlation, has been highlighted for each antibiotic. Originally published as Figure 1 in E.S. Kavvas, E. Catoiu, N. Mih, J.T. Yurkovich, Y. Seif, N. Dillon, D. Heckmann, A. Anand, L. Yang, V. Nizet, J.M. Monk, and B.O. Palsson, ‘Machine learning and structural analysis of Mycobacterium tuberculosis pan-genome identifies genetic signatures of antibiotic resistance’, Nat Commun 9 (2018), 4306, CC BY 4.0.
Adaptive mutations and stress. This figure shows that bacteria showing high tolerance to ethanol, obtained after laboratory evolution, also show high mutation rates. Originally published as Figure 3 in T. Swings, B. Van den Bergh, S. Wuyts, E. Oeyen, K. Voordeckers, K.J. Verstrepen, M. Fauvart, N. Verstraeten, and J. Michiels, ‘Adaptive tuning of mutation rates allows fast response to lethal stress in Escherichia coli’, Elife 6 (2017), e22939, CC BY 4.0.
Bacterial genome dynamics. This figure shows excess of gene loss over gene gain events in bacteria, especially in some clades such as Burkholderia and Staphylococcus. Originally published as Figure 3 in P. Puigbó, A.E. Lobkovsky, D.M. Kristensen, Y.I. Wolf, and E.V. Koonin, ‘Genomes in turmoil: quantification of genome dynamics in prokaryote supergenomes’, BMC Biology 12 (2014), 66, CC BY 4.0.
Relationship between population size and number of genes in a genome. This figure shows the relationship between the number of genes encoded in a bacterial genome and Ka/Ks ratio (also referred to as dN/dS ratio), and estimated Ne. Originally published as Figure 1 in I. Sela, Y.I. Wolf, and E.V. Kooni, ‘Theory of prokaryotic genome evolution’, Proceedings of the National Academy of Sciences USA 113 (2016), 11399–11407, under the PNAS Open Access option.
Evolution of restriction-modification systems in bacteria. (A) Restriction-modification systems can be intact, retaining genes for both the restriction enzyme and the methyltransferase; they can be degenerate, carrying a highly divergent (and presumably inactive) restriction enzyme; or they can be an orphan methyltransferase, having lost the restriction enzyme gene. (B) This figure shows decoupled sequence divergence of the components of degenerate (blue) restriction-modification systems compared to intact (grey) systems. (C) This figure shows the degree of conservation of degraded (blue) restriction-modification systems and orphan (green) methyltransferases, showing that the latter are more conserved. Grey dots represent an average of the two. Originally published as part of Figure 3 in A.S.N. Seshasayee, P. Singh, and S. Krishna, ‘Context-dependent conservation of DNA methyltransferases in bacteria’, Nucleic Acids Research 40 (2012), 7066–7073, CC BY-NC 3.0; copyright owned by the author of this book.
Transcription initiation. (A) This figure shows the formation of an RNAP holoenzyme by the binding of the RNAP core enzyme with a σ-factor. The structure of the RNAP inside the oval is from PDB: 7MKP, and that of a fragment of a σ-factor is from PDB: 1SIG. (B) This figure shows the interaction of an RNAP holoenzyme with the promoter. The image of the DNA is from SMART-Servier Medical Art, part of Laboratoires Servier, via Wikimedia Commons, available freely CC BY-SA 3.0.
Base composition upstream of genes regulated by DNA supercoiling in E. coli. This figure shows that genes that are induced by DNA relaxation are more A+T-rich than the average gene, whereas the reverse holds for genes that are induced by negative supercoiling. Along the x-axis, values to the left of ‘0’ indicate positions upstream of genes, and positions to the right indicate the gene body and further beyond. Originally published as Figure 5B in B.J. Peter, J. Arsuaga, A.M. Brier, A. Khodursky, P.O. Brown, and N. Cozzarelli, ‘Genomic transcriptional response to loss of chromosomal supercoiling in Escherichia coli’, Genome Biology 5 (2004), R87, CC BY 2.0.
Activation and repression by transcription factors. This figure shows a sample of simple ways by which (A) repressors (red-bordered triangles) and (B) activators (green-bordered triangles) act to regulate transcription initiation. The structure of the lac repressor filling the red triangle is from PDB: 1LB1, and that of CRP filling the green triangle is from PDB: 4N9H. The images of the DNA are from SMART-Servier Medical Art, part of Laboratoires Servier, via Wikimedia Commons, available freely under CC BY-SA 3.0.
The E. coli regulatory network. This figure shows a representation of the E. coli transcriptional regulatory network. Each line indicates a regulatory interaction between a regulator (mostly, but not necessarily, TFs) and a target gene. Red lines mark repressive interactions, whereas blue lines indicate activating interactions. Global regulators CRP and FNR are marked. Figure produced by Ganesh Muthu using the regulatory network available in the RegulonDB database (https://regulondb.ccg.unam.mx/) and Cytoscape (y-Force layout; https://cytoscape.org/ and https://www.yworks.com/products/yfiles-layout-algorithms-for-cytoscape).
Targets of various σ-factors in E. coli. This figure shows the sizes of various regulons (sets of targets of a regulatory protein) for E. coli σ-factors. σ38 is an alternative name for σS, and σ70 for σD. Originally published as Figure 2D in B.-K. Cho, D. Kim, E.M. Knight, K. Zengler, and B.O. Palsson, ‘Genome-scale reconstruction of the sigma factor network in Escherichia coli: topology and functional states’, BMC Biology 12 (2014), 4, CC BY 2.0.
Complex regulation of σS-σD competition. (A) A schematic showing the set of interactions involved in the regulation of σS-σD competition by the protein Rsd and the non-coding RNA 6S RNA. (B) Figure shows calculated transcription rate when Rsd is removed and when 6S RNA levels are increased in the absence of Rsd. (C) Figure shows calculated transcription rate when 6S RNA is removed, and the effect of the observed decrease in Rsd and core RNAP and increase in σS in the absence of 6S RNA. (B) and (C) show how functional connections between 6S RNA and Rsd appear to be important in determining the outcome of the competition between σS and σD. Originally published as part of Figure 6 in A. Lal, S. Krishna, and A.S.N. Seshasayee, ‘Regulation of Global Transcription in Escherichia coli by Rsd and 6S RNA’, Genes Genomes Genetics 8 (2018), 2079–2089, CC BY 4.0.
Binding of H-NS to virulence genes. This figure shows the binding of H-NS (enrichment, on the y-axis) to pathogenicity-determining genes belonging to (A) SPI-1 and (B) SPI-2 pathogenicity islands in Salmonella enterica Typhimurium. Originally published as Figures 3D and 3E in S. Lucchini, G. Rowley, M.D. Goldberg, D. Hurd, M. Harrison, and J.C. Hinton, ‘H-NS Mediates the Silencing of Laterally Acquired Genes in Bacteria’, PLoS Pathogens 2 (2006), e81, Creative Commons Attribution License.
Compensation for the loss of the H-NS gene silencing system. (A) Figure shows that mutations that change StpA and those that delete clusters of pathogenicity-related genes compensate for the loss of H-NS in Salmonella. Originally published as Figure 3 in S.S. Ali, J. Soo, C. Rao, A.S. Leung, D.H. Ngai, A.W. Ensminger, and W.W. Navarre, ‘Silencing by H-NS potentiated the evolution of Salmonella’, PLoS Pathogens 10 (2014), e1004500, Creative Commons Attribution License. (B) Figure shows that a duplication of nearly 40% of the chromosome centred around ori (which is located at ~3.9e06 on the x-axis) partially compensated for the lack of H-NS and StpA in E. coli. Originally published as Figure 3E in R. Srinivasan, V.F. Scolari, M.C. Lagomarsino, and A.S.N. Seshasayee, ‘The genome-scale interplay amongst xenogene silencing, stress response and chromosome architecture in Escherichia coli’, Nucleic Acids Research 43 (2005), 295–308, CC BY 4.0.
Adaptive mutations in the RNAP. (A) This figure shows the structure of the RNAP, highlighting sites showing adaptive mutations in light green. (B) and (C) These figures show that adaptive mutations in the RNAP occur close to the active site of the enzyme, which is involved in performing the transcription reaction. Originally published as Figure 2 in Y. Cohen and R. Hershberg, ‘Rapid Adaptation Often Occurs through Mutations to the Most Highly Conserved Positions of the RNAP Core Enzyme’, Genome Biology and Evolution 14 (2022), evac105, CC BY 4.0.
Transcriptional regulatory interactions are not conserved. (A) This figure shows correlation in gene expression between pairs of genes belonging to the same operon and therefore expected to be co-regulated, those regulated by the same TFs, and random pairs; (B) This figure measures the same correlations as (A), but for B. subtilis. Compare the distribution of co-expression measures between genes that are known to be regulated by the same TFs in B. subtilis (‘true regulons’) and those that are predicted to be co-regulated based on the E. coli regulatory network (‘putative regulons’). Originally published as Figures 5A and 5E in M. Price, P.S. Dehal, and A.P. Arkin, ‘Orthologous transcription factors in bacteria have different functions and regulate different genes’, PLoS Computational Biology 3 (2007), e175, Creative Commons Public Domain declaration.
TF evolution in bacteria. A population of bacteria beginning to adapt to a new environment accumulates mutations in TFs, especially global TFs. Over longer timescales, of the order of divergence of a whole species like E. coli, TFs show low sequence diversity. As the niche changes to Y, adaptation may proceed through TF repertoire changes created by gene loss and horizonal gene transfer. Originally published as Figure 8 in F. Ali and A.S.N. Seshasayee, ‘Dynamics of genetic variation in transcription factors and its implications for the evolution of regulatory networks in Bacteria’, Nucleic Acids Research 48 (2020), 4100–4114, CC BY 4.0.
Evolution of TFs by horizontal gene transfer. This figure shows that a majority of TFs in E. coli were likely acquired by horizontal gene transfer. This does not hold true for global regulators, most of which are ‘native’ or not recently acquired. This was published as Figure 6 in Price et al. (2008). Genome Biology, CC BY 2.0.
Model of transcription and supercoiling. This figure shows the process of transcription, highlighting positive supercoils forming in front of and negative supercoils behind of the elongating RNAP. Originally published as Figure 1 in C.J. Dorman, ‘DNA supercoiling and transcription in bacteria: a two-way street’, BMC Molecular Cell Biology 20 (2019), 26, CC BY 4.0.
Gene organisation in fast- and slow-growing bacteria. (A) This figure shows the division of the bacterial chromosome into four bins referred to in B and C. (B) This figure shows the enrichment of translation related genes (referred to as ‘COG category J’) in the ori-proximal region across bacterial genomes; inset shows the difference between fast-growing (R > 1) and slow-growing (R <= 1) bacteria. (C) As in B, but this figure shows the depletion of horizontally-acquired genes in ori-proximal regions in both fast- and slow-growing organisms but more so in the former. (D) This figure shows that gene order conservation (ρGOC) between pairs of closely-related bacteria after correcting for phylogenetic relatedness is correlated with the growth rate of bacteria. Originally published as part of S. Khedkar and A.S.N. Seshasayee, ‘Comparative genomics of interreplichore translocations in bacteria: a measure of chromosome topology?’, Genes, Genomes, Genetics 6 (2016), 1597–1606, CC BY 4.0.
Chromosome rearrangements maintaining gene dosage along the ori-ter axis. (A) This figure shows that inter-replichore translocations tend to be symmetric about the ori-ter axis. Dinter refers to the distance of the translocated pair of genes on either replichore from ori. The smaller the distance, the more symmetric the translocation. The dotted line shows what would be expected if translocations occurred between random sites across replichores. Originally published as Figure 5A in S. Khedkar and A.S.N. Seshasayee, ‘Comparative genomics of interreplichore translocations in bacteria: a measure of chromosome topology?’, Genes, Genomes, Genetics 6 (2016), 1597–1606, CC BY 4.0.
Non-random organisation of repeats in bacterial genomes. (A) This figure shows that fast growing genomes contain more inter-replichore inverted repeats. This is especially clear in the zoomed-in version shown in the inset. Blue dots are for fast-growing bacteria and yellow for slower growing ones. Originally published as Figure 6E in N. Malhotra and A.S.N. Seshasayee, ‘Replication-Dependent Organization Constrains Positioning of Long DNA Repeats in Bacterial Genomes’, Genome Biology and Evolution 14 (2022), evac102, CC BY-NC 4.0; copyright held by the author of this book. (B) Inter-replichore inverted repeat pairs are more symmetric about the ori-ter axis in fast-growing bacteria. Originally published as Figure 7H in Malhotra and Seshasayee (2022).