


7. Why inequality is bad
© 2018 Daniel Nettle, CC BY 4.0 https://doi.org/10.11647/OBP.0155.07
Macro-level data are characterized by inherent limitations in what they can tell us about individual-level processes.
–Thomas V. Pollet and colleagues1
Richard Wilkinson and Kate Pickett’s book The Spirit Level: Why More Equal Societies Almost Always Do Better caused something of a stir when it was published in 2009.2 The thesis of the book is clear from its title. What many were struck by was the vast range of statistical evidence that the authors brought to bear in defence of their central claim. For outcome after outcome—life expectancy, physical health, mental health, crime, teenage births, social trust—they showed the same pattern. Economically equal countries such as Japan and those of Scandinavia have the best societal outcomes; the unequal USA fares badly; and there is a graded relationship across the countries in between. The average income of a country (as long as it is reasonably high) explains little of the variation in health and social problems; it is the inequality of the distribution of income amongst inhabitants that matters. Never can you have encountered a single explanatory factor that turns out to matter for so many outcomes, and, intriguingly, turns out to matter in exactly the same way for all of them.
The purpose of this essay is not to dispute that inequality is bad. I agree with Wilkinson and Pickett on this point—the evidence is incontrovertible, and they performed a major intellectual service in placing the issue of inequality so centrally on the political table. My interest lies more in their argument for why inequality is bad. They have a particular take on this, which we will get to below. It may have some merit. However, there is a more parsimonious alternative explanation for their central results that merits equal consideration. What interests me is why they don’t really discuss this alternative in their book (even to refute it), despite the fact that they must be well aware of it.
The centerpiece of Wilkinson and Pickett’s evidence is a series of scatterplots, backed up with regression analyses, showing that more inequality (on the x-axis) goes with lower average levels of good stuff (like trust) or higher average levels of bad stuff (like mortality or crime) on the y-axis. Figure 2 reproduces a couple of them. The remarkable thing about these scatterplots is how similar they all look to one another; however diverse the outcome, you always end up with a roughly linear relationship, with some (aptly enough for a scatterplot) scatter, and a few interesting cases that look like they are doing a bit better or worse than you might predict. As a working scientist who understands how messy data are, I find myself crying out for one analysis that didn’t work out that way. If it’s a non-trivial association, it ought to sometimes not be there, or else you start to worry that it is somehow an artefact of the method. (Spoiler alert: it’s not an artefact of the method, but it may be the inevitable product of a very general principle about money, as we shall see later).
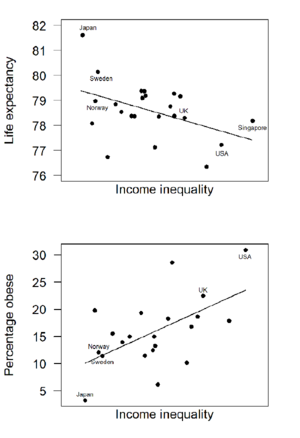
Figure 2. Scatterplots of (top) country-level average life expectancy against income inequality, and (bottom) percentage of adults who are obese against income inequality, redrawn from The Spirit Level. I have omitted most of the country names for clarity.
The important thing to appreciate about these scatterplots is the following: the data points on them are not individual people. They are large aggregates of people, sometimes countries as in figure 2, but also in some of their analyses, US states. In some sense, this has to be so, because inequality is not a property of any individual person: it is necessarily a group-level property, exactly because it concerns how stuff is shared out across the social group. I have no objection to the idea that group-level properties such as the inequality of the distribution of national wealth affect the well-being of individuals. Clearly, they do. It’s just that we have to be very careful about reasoning from statistical relationships that exist at the aggregate level, such as between countries’ inequalities and their average health outcomes, and processes going on in individual bodies and minds.
Wilkinson and Pickett’s explanation for the universal association between high inequality and poor welfare is an appealing one, and it is roughly the following. In societies where there are large gulfs between people, no-one can feel secure. Everybody is stressed: not just those at the bottom the heap, but also those in other social positions, who constantly need to feel worried about slipping down into penury, and feel they have to battle to hang on to their currently favourable position. In short, everyone is worse off when there is more inequality because everyone is more stressed about either moving up, or staying where they are. In a more equal world, these kinds of stresses and motivations are relaxed, making way for more balanced and healthful approach to life. This in turn leads to fewer negative emotions, more trust and compassion, better mental health, better physical health, less crime, and so on.
Appealing as this narrative is, note what it has done. It has explained an association that exists at the aggregate level (comparing nations to each other) by a process in individual minds, by simply transposing the pattern we see when we compare groups into the head of every individual. As figure 2 shows, at the level of countries, you find poorer average well-being where inequality is higher; Wilkinson and Pickett explain this by saying that for every individual, their well-being goes down if the level of inequality in the surrounding society is higher. That could be true, but it need not be true to explain patterns like those in figure 2. We are entering the terrain here of the dreaded ‘ecological fallacy’ (the fallacy of assuming that an association at the aggregate level is reproduced within each individual), and related ‘Yule-Simpson effect’ (statistical relationships at one level of aggregation can be absent or even reversed at a different level of aggregation). Much has been written about these issues.3
The quantities on the y-axes of figure 2 and the other scatterplots in The Spirit Level are rates or averages for the country or state. Differences in rates or averages can come about in a number of different ways. To obtain the high rate of obesity in the USA compared to Sweden, for example, it could be that every individual within each country has a particular probability of becoming obese, and that probability is much higher for a person from the USA than a person from Sweden. This would be the Wilkinson and Pickett explanation: everyone in the unequal USA is at a higher personal risk of obesity, because of the stress of the surrounding inequality, than anyone in equal Sweden.
Here’s an alternative explanation, though. Say there are two classes of people. The first class is people whose incomes are too low to buy good diets. Regardless of whether they live in the USA or Sweden, they have a 50% chance of becoming obese. The second class is people whose incomes are high enough to afford good diets. Regardless of whether they live in the USA or Sweden, they have a 10% chance of becoming obese. These two classes are both present in both countries. Individuals of neither class are directly personally affected by the level of inequality in their country; all they need ‘know’ is whether they have enough money to buy a good diet or not, and this determines their risk of obesity. The difference between the countries arises from their different compositions in terms of the two classes. Sweden, say, consists of 95% people in the ‘high enough income’ category, and 5% of people in the ‘not high enough income’ category, whereas the USA consists of more like 50%: 50%. That could certainly produce the pattern shown in figure 2. And it’s not a ridiculous explanation. There is lots of evidence that many people in the USA are too poor to buy decent food.4 The thing about inequality is that it produces a big chunk of people who are really badly off given the general level of prices in their country. Smaller inequality produces a smaller chunk.
Wilkinson and Pickett could reasonably respond that they show, in still other scatterplots, that the average income of a country is not a very good predictor of health and social outcomes (given that we are comparing amongst countries that are all reasonably rich). Hence, it is not income per se that matters, but the inequality of its distribution. But again, those scatterplots are based on country-level average income not being a very good predictor of country-level averages or rates of health and social problems. What I am saying is that at the individual level, personal income might be very important—indeed causally the most important thing. This is quite compatible with a country’s average income not telling you much about the average level of health, since the kind of income the matters at the individual level is not the national average income, but one’s own.
§
As I mentioned earlier, the remarkable sensation one gets from reading The Spirit Level is how uniform a picture emerges from these scatterplots. Every single one shows the predicted positive or negative correlation. It becomes an almost incantational moment, repeated throughout the liturgy: the unveiling of the scatterplot. You can’t help but feel that these plots, diverse as they are in their data sources and outcome variables, must be revealing a principle of great generality. They are: the question is, exactly what principle is it?
The alternative to Wilkinson and Pickett’s ‘inequality around makes us all stressed’ explanation is the following. At the individual level, income has diminishing returns for the outcomes that matter in life. When you put it like that, it is obvious. For a man who is starving, £10 can be the difference between living and dying; for a man who is rich, it is a bagatelle. For a man on a low income, £100 a month increase in income can be life-changing because of the material improvements he could make. For a university professor such as myself, £100 a month increase in income would, to be honest, not change my life in any very appreciable way.
What does this principle—the diminishing welfare returns to income—have to do with why inequality is bad? Here we need to think hard about what happens as societies become more unequal. The income inequality of a country can be thought of as a measure of the dispersion of the income of its individual inhabitants around the average. Where inequality is high, the dispersion is large. Where inequality is low, the dispersion is smaller and every individual is tightly clustered around the country average. Thus, the only way for a country to become more unequal whilst maintaining the same average income is for the dispersion to increase around a fixed central point: some individuals have to move away from the average income in the positive direction, while others have to produce an equal and opposite moment by moving away from the average income in the negative direction.
Now let us combine this principle with the idea that there are diminishing returns to having more income. Let us say that the relationship between an individual’s income and his or her expected health (and here you can substitute, trust, stress, anxiety, probability of teenage conception, probability of committing a crime, any of the outcomes you like) is as shown in figure 3. This just puts onto a simple function the intuition that each increment of £100 in income is a little less beneficial for health improvement than the previous £100.
Now imagine we are going to increase the income inequality of the country without changing its average income. To achieve this, one group of individuals will have their income pushed away from the average in the positive direction, while another group will exactly offset this by having their income pushed away from the average in the negative direction. But, critically: the people who are pushed up in income will experience only a very small improvement in their health, because they are being pushed up across a zone where the income-health relationship is rather flat. By contrast, the people pushed down will experience a larger deterioration in their health, because they are being pushed across a zone where the income-health relationship starts to get steep. So the rich will get richer, but not much healthier, and the poor will get poorer, and much less healthy.
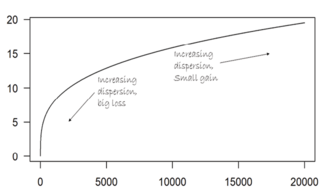
Figure 3. When there are diminishing health returns to income, increasing dispersion of incomes around a constant average produces a big health loss for the losers but only a small health gain for the gainers. Health is shown on an arbitrary scale.
So what will the average health be like for our hypothetical country after it has become more unequal without changing its average income? Well, its average health will be given by the following equation:
Average health after becoming more unequal =
The average health it had before +
a small improvement for those who did well in the increasing inequality −
a big deterioration for those who did badly in the increasing inequality
I hope you can see that ‘the initial thing + a small thing – a big thing’ has got to be of a lower value than the initial thing. In other words, if the relationship of income to health is of a diminishing-returns character, then it is necessarily the case that increasing inequality will make average health poorer. It is in fact a consequence of a general mathematical principle called Jensen’s inequality.5 For cases such as the obesity one, where the scatterplot shows a positive rather than negative trend, you have to assume that there are diminishing returns to income for avoiding obesity; then, the same explanation for the observed pattern then follows.
§
In case you are not yet convinced, I created a simple computer simulation. In my simulation, we study 30 countries, and from each we sample 100 inhabitants. The countries have the same average income per capita as one another (£10,000). They differ only in how unequally distributed this income is: the degree of dispersion around £10,000. Every individual’s health (measured on an arbitrary scale) is determined by the square-root of their income (hence, diminishing returns), plus a sizeable dose of randomly-distributed noise.6
It is important to stress that in this simulation, no individual ‘knows’ the inequality of his or her country directly. They don’t feel stressed by it, or fear falling into poverty, or feel the need to keep up with the Joneses. Their health is determined entirely by their personal income, plus random chance. Now, what happens when we compute the average health for each country, and plot it against the Gini coefficient, a standard measure of income inequality, for our virtual countries?
Figure 4 shows the results from four runs of the simulation. The association of higher inequality with poorer welfare is always there. The plots could have come straight out of the pages of The Spirit Level. Sometimes the association is stronger, sometimes a bit weaker, sometimes there are intriguing outliers or apparent non-linearities. But the point is: I have run this simulation hundreds of times. It is 17 lines of code (and I am not a very efficient programmer); there is no delicate psychology of shame and anxiety; no response of the individual to their psychosocial milieu; no representation of the society’s Gini coefficient in the head of any individual; and yet we see The Spirit Level’s central result every time. That’s mathematics for you. Under diminishing returns to income for some outcome, increasing dispersion in income will always decrease the aggregate level average of the outcome. This means any attempt to plot the correlation at the group level that is shown again and again in The Spirit Level is condemned to success by the laws of mathematics. No other assumptions about human psychology, stress, or anything else are required to explain this result.
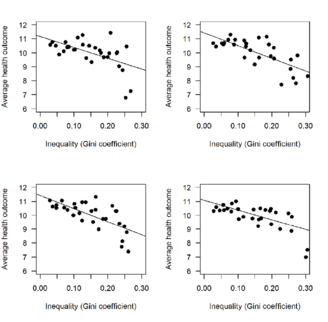
Figure 4. Income inequality against average heath for thirty simulated countries, four separate runs of the simulation, as described in the text.
We have two competing mechanisms that give rise to the same aggregate-level association: 1. More inequality in a society causes everyone in that society to feel worse; and 2. More inequality in a society produces winners and losers, and since the loss of the losers is bigger than the win of the winners, the average welfare becomes lower. Two competing mechanisms is good: this is the situation scientists like, because now you can try to test which is more important.
You can test between these mechanisms. One way is to gather what is called multilevel data. That is, you need datasets from multiple countries where the health and the income of every individual (not just the country average) is recorded. You also need to know the inequality of each country. Then you fit a statistical model that simultaneously estimates the effects of personal income and societal inequality on the individual’s health. Second, and crucially, when you do this you need to specify that at the individual level, the relationship between income and health is likely to be non-linear, for example by relating health to the logarithm of income.
Researchers working on the association of inequality and health are well aware of the danger of the ecological fallacy, and for this reason, they have conducted studies using multilevel data. In general, they haven’t done a very good job of estimating curvilinear relationships between income and health at the individual level. Epidemiologists seem keen on doing this by dividing income up into bands; this does allow for non-linearity, but dividing a continuum into bands always loses information, and therefore risks underestimating the magnitude effects of personal income. But anyhow, that’s how they tend to do it.
In some studies, effects of societal-level inequality remain statistically significant after accounting for individual income, while in others they do not. For example, in two of three studies reviewed by Kawachi et al.,7 there is no association between society-level inequality and individual health once the effects of personal income have been taken into account. In the third study,8 there is some evidence for an effect of inequality on health after accounting for personal income, but, (a) the effects of societal inequality are much weaker than the effects of personal income; and (b) the negative effects of societal inequality on health after accounting for income are strongest in the poorer sectors of societies. In fact, there is no evidence for a negative effect of inequality on the health of the richest people in societies. Findings are similar in other studies. So when people model the problem properly, they have to conclude that, at the very least, a big part of the mechanism linking inequality to average well-being is simply the distribution of personal incomes.9
§
If I am leaning towards the ‘diminishing returns from individual income’ mechanism being the main one in accounting for the cross-national pattern, I fear you might think I am saying the following: ‘Wilkinson and Pickett are wrong. Inequality is not really bad for societal outcomes. It is really just that there are diminishing returns to individual income. The group-level correlation is a kind of statistical artefact’.
On the contrary, I am saying: Wilkinson and Pickett are right that inequality is really bad for societal outcomes. Its negative effects may operate via a slightly different individual-level mechanism than they suggest. The group-level correlations between inequality and outcomes embody with the force of necessity a general truth that politicians should be aware of. Increasing inequality really is bad for societal outcomes exactly because there are diminishing returns to income. In general, in an affluent society, if you enact policies that make your society or group less equal, then well-being will get only a bit better for the winners, but well-being will get a lot worse for the losers. As a consequence, the aggregate well-being will be worse than it was before. Moreover, your social group will have to deal with all the knock-on costs of having sick, demoralized, hungry and desperate people around.
So, far from being a debunking of the idea that inequality is bad, this meditation leads me to affirm that inequality is bad. Indeed, it is potentially radical in its implications. The idea that the life returns to income might rather generally be diminishing is an argument in favour of reducing inequality (just as much as Wilkinson and Pickett’s account is). More specifically, it is an argument for progressive taxation, and other redistributive mechanisms (taking from the rich, for whom it won’t make much difference, and giving to the poor, for whom it could be life-changing). It is also a direct challenge to our prevailing cultural assumption that making a lot of money is a sensible and beneficial general aspiration for life.
I rather like the diminishing returns explanation for another reason. Accounts of why deprivation is bad for health have taken a rather ‘soft’ turn of late, in some quarters. If you want to read up on this, it’s the debate between the psychosocial comparison account and the neo-materialist account of health inequalities.10 The neo-materialist position is fairly obvious: disadvantage is bad for health because you can’t afford decent housing, food, eye tests, and so on. For the psychosocial comparison camp, what’s bad about disadvantage is that it produces feelings of shame, worthlessness and other negative emotions that arise when we compare ourselves to others.
It’s true enough that experiencing disadvantage gives rise to negative emotions. You can document this in as many surveys as you like. As a causal decomposition of why poverty and deprivation might be harmful, though, the focus on negative feelings is rather bourgeois in its sensibilities. It almost says: I can’t imagine that anyone is really poor in a country like contemporary Britain, not poor enough to actually starve or shiver or contract consumption or anything. It is just that, subjectively, coming last in the race makes people feel bad. But the idea that no-one in Britain has absolute problems of poverty—material rather than just subjective disadvantage—is a failure of imagination. If I may say so, it’s a failure of imagination particularly easy to succumb to if you aren’t poor yourself, and live in a neighbourhood where no-one is poor. In the West End of Newcastle, there are people, today, who do not have enough to eat. They don’t have enough money to heat their homes or dress well. These are absolute material problems. Bad feelings are at most the canary in the coalmine.
So whilst both psychosocial experience and material wants may have important roles to play, I have a personal bias towards the neo-materialist approach. This is related to my gravitation towards the diminishing-returns-to-income account of the group-level correlation between inequality and societal outcomes. It is a little dismissive, even trivializing, of the experiences of poor people to characterize their difficulties as largely constituted by negative subjective feelings. Their problems—as they see them—are largely constituted by not having enough money to live on, given how much everything costs.11 Similarly, I am uneasy with the argument that increasing inequality has hurt me, a university professor, as much as it has hurt a person on the minimum wage (I had to step over a homeless person on the way to the opera!). It hasn’t really. The inconvenient truth is that many of the policies that have made the lives of poor people in Britain worse have been popular with the upper-middle classes, who perceive their lives to be made better, not worse, by them. The problem is that their gain has been more than offset by big losses for others. This raises questions of fairness, as well as the chaos of picking up the consequent social problems.
§
Wilkinson and Pickett are very good researchers who are no doubt well aware of the theoretical issues—Jensen’s inequality, the ecological fallacy, and so on—we have discussed so far. They don’t talk about them in their book though. They just put forward their preferred mechanism and then give us scatterplot after scatterplot. This is despite the facts that: (a) diminishing welfare returns to individual income also predicts scatterplots showing the same pattern as their account; and (b) this has been widely known and agonized over in the technical literature for decades.12
I suspect this means Wilkinson and Pickett are smarter academics than I am, for two reasons. First: people in general (people like politicians, students, activists and the general public, as well as colleagues) will believe and reproduce an argument they find easy to understand and remember. Wilkinson and Pickett want you to believe and reproduce the idea that inequality is bad (as do I!). Wilkinson and Pickett’s mechanism linking societal inequality to individual health is easy to understand and remember. The diminishing returns thing is not.
Humans find reasoning about certain kinds of processes hard. One kind of process they find particularly hard is that requiring what the great biologist Ernst Mayr called ‘population thinking’.13 Population thinking requires tracking the way groups of things (biological populations, societies) change their aggregate properties over time through changes in their composition, not changes to any of their constituent individuals. Population thinking is effortful to do. It is easier to conflate the properties of the individuals and of the group in one’s mind, essentially to make the group itself a kind of representative individual.
For example, there is a large literature on popular understanding of biological evolution.14 This literature shows people struggling to grasp that what happens in evolution is continual change in the proportions of individuals with different characteristics in the population, not necessarily change to any of the individuals themselves. The individual animals and plants are just being how they are; they don’t know anything about the species or the direction of evolution. People find it easier to conflate what is happening at the individual level and at the species level. They believe that the species adapting to desert conditions over evolutionary time implies that individuals get better at living in deserts during their lifetimes (it needn’t); or they endow the species itself with needs, drives, goals and so forth, properties that actually belong to individuals (‘lemming X did something for the good of its species’). In short, people find it a lot easier to understand how one individual gets a longer neck by stretching it, than how the necks of giraffes could extend by a metre over evolutionary time without any individual changing their neck-length in their adult life, and despite offspring having the same length of neck as their parents on average.
The difficulty with population thinking crops up in trying to understand social phenomena, too. This may explain the widespread persistence of the ecological fallacy in social science research. I cannot tell you how many times I have tried to remember and transmit the following famous example. Amongst senators from the Northern states, a higher proportion of Democrats than Republicans voted for the 1964 Civil Rights Act. Amongst senators from the Southern states, a higher proportion of Democrats than Republicans voted for the 1964 Civil Rights Act. Amongst all the senators in the senate combined, a higher proportion of Republicans than Democrats voted for the 1964 Civil Rights Act. Eh? That can’t be right. Actually, it is. It’s quite straightforward. Most of the Republicans were from Northern states, where the support for the 1964 Civil Rights Act was high; more of the Democrats were from the South, where support was low. I can hang onto this one for about five minutes…no, it’s gone again.
The difficulty with population thinking, I suspect, is why Wilkinson and Pickett’s explanation for why inequality is bad has got such cultural legs. It says: the same thing is going on in the head of every individual as is going on the level of whole groups. As the inequality gets greater, the individual=group feels worse. No population thinking required. What happens is the same for every individual in the group, and the group-level correlation is just an individual-level correlation. By contrast, the diminishing-returns requires non-linear functions, and averages being affected by some people moving in one direction with one effect, and other people moving another way with different effects. It’s not catchy. It replaces a simple universal principle with a murky, nerdy statistical argument that could prove a cultural cul-de-sac. That does not help the cause.
The second reason that Wilkinson and Pickett’s argument is a shrewd one is that it appeals directly to the self-interest of rich people. ‘You too would be directly, personally better off if inequality were reduced’, it says. ‘Feeling stressed? Try lower inequality!’ By contrast, the diminishing returns story says: ‘you, the rich, might be slightly worse off under reduced inequality, but some other people would be much better off’. Wilkinson and Pickett offer us a free lunch for all; diminishing returns offers to make some (small) losers and some (big) gainers. Appealing to the self-interest of influential people is a smart move. It seems to have become much more normative in recent decades to assume that people can only be motivated to action by appealing to their self-interest. I doubt this is true: humans have complex moral emotions and perceived self-interest is certainly not the only factor influencing their endorsement of courses of action. But in the current climate, Wilkinson and Pickett’s argument is pragmatically effective.
This is especially true since those who stand to gain most from reductions in inequality—poor people—have been systematically demonized, portrayed as undeserving, feckless, and not like us, in the cultural representations of recent decades.15 This cultural situation risks making the argument that it is mostly poor people who would benefit from reducing inequality backfire rather badly. The argument that the rich would benefit too looks a better bet.
§
I conclude this essay, as so often, in a state of profound unease. I find myself quibbling with the details of Wilkinson and Pickett’s explanation of why inequality is bad, even though I admire their work and wish it to succeed in its broader social agenda. It would be easy, by raising complex alternative statistical explanations, to give succour to those who wish to dismiss the evidence that inequality is bad altogether. And there are plenty of those, such as Conservative former government minister David Davis, whose response was apparently: ‘It’s bullshit […]. It’s bullshit […] I think it’s one of those fashionable, stupid ideas. It’s easy to sell a book, but I don’t think it stands up’.16
If there is something you deeply believe, is it better to promulgate a simple explanation for it that people will immediately understand, support and remember, but is maybe a little simpler than what you, as a researcher, suspect to be really going on? Or is it better to be quite open about the uncertainties, the complexities, and the diversity of possible mechanisms that could underlie the phenomena we observe? Which one, ultimately, will increase the longevity and fecundity of the central idea? The media has for the most part made its mind up about this: I knew a TV producer who admitted to me that whenever an academic says, ‘There are several possible reasons. First…’, he quietly stopped his camera recording. No need to waste tape.
The issue is about the inherent complexity and uncertainty of scientific knowledge. As academics trying to make an impact on life, we could opt to express our doubt and uncertainty only behind closed doors, in lab meetings and the privacy of our studies; maybe in the technical literature, behind a screen of algebra. Then we could go out into to the world having decided what we believe, packaging it comprehensibly and appealingly, and defending it on all fronts with a greater certainty than we might privately hold. Or else, as I rather naïvely tend to do, we could stumble around in the world, incoherent and uncertain, with all our doubt, our qualifications, our evidential gaps, our multiple alternative mechanisms, our ‘on the one hand’s and changes of heart, in plain sight. It’s a difficult problem.
1 Pollet, T. V. et al. (2014). What can cross-cultural correlations teach us about human nature? Human Nature 25: 410–29, p. 412, https://doi.org/10.1007/s12110-014-9206-3
2 Wilkinson, R. and K. Pickett. (2009). The Spirit Level: Why More Equal Societies Almost Always Do Better (London: Penguin).
3 See Pollet, T. V. et al. (2014). What can cross-cultural correlations teach us about human nature? Human Nature 25: 410–29, https://doi.org/10.1007/s12110-014-9206-3
4 See: Gundersen, C., B. Kreider and J. Pepper. (2011). The economics of food insecurity in the United States. Applied Economic Perspectives and Policy 33: 281–303, https://doi.org/10.1093/aepp/ppr022; Ratcliffe, C., S. McKernan and S. Zhang. (2011). How much does the Supplemental Nutrition Assistance Program reduce food insecurity?. American Journal of Agricultural Economics 93: 1082–98, https://doi.org/10.1093/ajae/aar026
5 Jensen’s inequality: Roughly, the average of a function of X is not equal to that function of the average of X, unless the function is linear. See Denny, M. (2017). The fallacy of the average: On the ubiquity, utility and continuing novelty of Jensen’s inequality. Journal of Experimental Biology 220: 139–46, https://doi.org/10.1242/jeb.140368
6 You can download the R code for running the simulation from: http://www.danielnettle.org.uk/inequality-r-code/
7 See Kawachi, I. and B. P. Kennedy. (1999). Income inequality and health: pathways and mechanisms. Health Services Research 34: 215–27, p. 217. Download at: https://www.ncbi.nlm.nih.gov/pmc/articles/PMC1088996/
8 Kennedy, B. P. et al. (1998). Income distribution, socioeconomic status, and self-rated health in the United States: multilevel analysis. British Medical Journal 317: 917–21, https://doi.org/10.1136/bmj.317.7163.917
9 An even better approach than having multi-level observational data is using some kind of experiment or natural experiment. That is, we need to study a situation where people’s experience of inequality is randomly varied without altering their actual incomes. It’s hard, but there are some very interesting attempts to do it by studying the neighbours of lottery winners (Agarwal, S. et al. (2018). Does the relative income of peers cause financial distress? Evidence from lottery winners and neighboring bankruptcies. Working Papers of the Federal Reserve Bank of Philadelphia WP: 18–16, https://doi.org/10.21799/frbp.wp.2018.16), or by creating artificial micro-societies (Krupp, D. B. and T. R. Cook. (2018). Local competition amplifies the corrosive effects of inequality. Psychological Science 29: 824–33, https://doi.org/10.1177/0956797617748419). These kinds of research seem to me to give us the best window we can have on the causal properties of inequality itself.
10 See Lynch, J. W. et al. (2000). Income inequality and mortality: importance to health of individual income, psychosocial environment, or material conditions. British Medical Journal 320: 1200–4, https://doi.org/10.1136/bmj.320.7243.1200 and a response by Marmot, M. G. and R. G. Wilkinson. (2001). Psychosocial and material pathways in the relation between income and health: A response to Lynch et al. British Medical Journal 322: 1233–6, https://doi.org/10.1136/bmj.322.7296.1233
11 There is a wealth of research evidence supporting this claim. See for example: O’Brien, M. and P. Kyprianou. (2017). Just Managing? What it Means for the Families of Austerity Britain (Cambridge: Open Book Publishers), https://doi.org/10.11647/obp.0112, https://doi.org/10.11647/obp.0112; Daly, M and G. Kelly. (2015). Families and Poverty: Every Day Life on a Low Income (London: Policy Press), https://doi.org/10.1332/policypress/9781447318828.001.0001; Garthwaite, K. (2016). Hunger Pains: Life inside Foodbank Britain (London: Policy Press), https://doi.org/10.2307/j.ctt1t89f84; Taylor, A. and R. Loopstra. (2016). Too Poor To Eat: Food Insecurity in the UK, downloadable from https://foodfoundation.org.uk/wp-content/uploads/2016/07/FoodInsecurityBriefing-May-2016-FINAL.pdf.
12 An early reference to relevance of diminishing returns to personal income for aggregate welfare is found in Melville, L. (1939). Economic welfare. The Economic Journal 49: 552–3, https://doi.org/10.2307/2224836, and the principle is a standard one in welfare and taxation economics. Its application to the present issue is discussed, inter alia, by Ecob, R. and G. Davey Smith. (1999). Income and health: What is the nature of the relationship? Social Science and Medicine 48: 693–705, https://doi.org/10.1016/s0277-9536(98)00385-2
13 Mayr, E. (1982). The Growth of Biological Thought (Cambridge: Cambridge University Press).
14 Shtulman, A. (2006). Qualitative differences between naive and scientific theories of evolution. Cognitive Psychology 52: 170–194, https://doi.org/10.1016/j.cogpsych.2005.10.001; Nettle, D. (2010). Understanding of evolution may be improved by thinking about people. Evolutionary Psychology 8: 205–28, https://doi.org/10.1177/147470491000800206
15 See Jones, O. (2016). Chavs: The Demonization of the Working Class (London: Verso).
16 Quoted in Jones, O. (2016). Chavs: The Demonization of the Working Class (London: Verso, p. 83).

